Public strategy all correctSo far, everyone has made a profit by following the trading plan. We arranged short orders at 3032 and 3052 for gold, but the short-term trend was strong, so we all left the market at 3038! We collected another 80 points of profit! The operation idea is very clear.
News analysis: Why is 3026 so critical? Looking back at the rebound of gold prices in the past few days, it is not difficult to find that many previous rebounds have retreated near 3026. At the same time, this point is also the first time that gold prices have bottomed out and rebounded from 3056 before this round. After breaking through, it rebounded many times but failed to pass. This is a typical watershed between longs and shorts. In fact, yesterday's gold price had already meant to break upward, but the market tension was limited yesterday. The first wave of impact to 3038 this morning has already sounded the horn of the bulls' charge. Unfortunately, it was not sure whether 3026 could be held at that time. If the high position is near 3030, the defense should be placed below 3020, which is a little big. There is no reverse follow-up to keep up with the rhythm of this wave of rebound.
Technical analysis of gold: The current idea of the end of the trading day is very clear. We chose to take short positions below the previous historical high of 3055-57 for the second time. The short positions of 3050-52 have now retreated to around 3038. Since there has been a high-level decline, it shows that the bulls are not that strong. There has been no breakout in one go. The probability of breaking 3055 tonight is gradually decreasing. The end of the trading day will most likely remain in the 3030-50 range for consolidation, and the focus will be on tonight's closing point. If the high-level close is above 45, the gold price may set a new high tomorrow; if the closing line is below 35, it will maintain a high level of volatility tomorrow, Friday.
Operation strategy: If gold falls back to around 3030-35, you can take long positions. Gold can still be shorted around 3055-58
Trading discipline:
1. Don't blindly follow the trend: Don't be swayed by market sentiment and other people's opinions. Operate according to our operation plan. The information in the market is complicated. Blindly following the trend can easily lead to the dilemma of chasing ups and downs.
2. All short-selling profit-taking areas 3050-3045 are closed.
3. In gold trading, we will continue to pay attention to news and technical changes. Once there is a change, we will inform you in time and strictly implement trading strategies and trading disciplines to move forward steadily in a volatile market and achieve steady appreciation of assets.
Goldpreis
Gold shocks converge, trading strategy fully analyzedTechnical analysis of gold: Gold has slightly risen and fallen during the day, and the overall trend remains in a volatile trend. Gold is currently maintaining a narrow range of fluctuations on the daily trend, but the short-term moving average has gradually diverged downward, and there are signs of weakening in the short term on the daily line. The 4-hour level trend is temporarily maintained in a volatile state, and the price is temporarily compressed between 3010-3030. The short-term moving average continues to maintain a state close to adhesion and flattening, tending to maintain a volatile trend in the short term. It is necessary to pay attention to the continued downward trend after a small break in the 4-hour level trend. In the small-level cycle trend, after touching the previous support band, there are signs of stabilization again. Pay attention to the short-term adjustment.
Gold is about to explode in a big market. The obvious box-shaped oscillation triangle is converging, that is, it has become narrower, and the oscillation has lasted too long. If it can break through 3038 with consecutive positive lines, then today will basically continue a wave of pull-ups, so there is a high probability that the 4-hour middle track or the daily 5-day moving average will break. On the contrary, if the psychological barrier of 3000 is lost, the market may fall back to the support zone of 2971-2997 for correction. On the whole, today's short-term operation of gold suggests that callbacks should be the main focus, and rebound shorts should be supplemented. The top short-term focus is on the first-line resistance of 3030-3036, and the bottom short-term focus is on the first-line support of 3010-3012. Friends, you must keep up with the rhythm. Gold operation strategy: short gold rebound near 3028-3035, and go long on the pullback of 3015-3010.

How to break the position of gold as it narrows in shock?Technical analysis of gold: Gold has slightly risen and fallen during the day, and the overall trend remains in a volatile trend. Gold is currently maintaining a narrow range of fluctuations on the daily trend, but the short-term moving average has gradually diverged downward, and there are signs of weakening in the short term on the daily line. The 4-hour level trend is temporarily maintained in a volatile state, and the price is temporarily compressed between 3010-3030. The short-term moving average continues to maintain a state close to adhesion and flattening, tending to maintain a volatile trend in the short term. It is necessary to pay attention to the continued downward trend after a small break in the 4-hour level trend. In the small-level cycle trend, after touching the previous support band, there are signs of stabilization again. Pay attention to the short-term adjustment.
From the overall situation, gold is definitely in the bull market stage. At present, there is strong buying defense at the 3000 mark, and the "W" double bottom Zou shape has appeared below. If it successfully breaks through the 3035 watershed, it is expected to test the pressure near 3045 and the historical high of 3057. Now the low point of the callback begins to move up slowly, showing a small upward trend. First, we will overestimate and undervalue in the 3030-3010 range. We can see that the current gold trend is also narrowing. There is no problem with short-term shock operations, but pay attention to the breakout after continuous shocks. The daily cycle hovers around the angle of the short-term moving average. There is a choice of direction at any time. Follow the breakout. Overall, today's short-term operation strategy for gold is mainly long on callbacks, and short on rebounds. The short-term focus on the upper resistance of 3030-3036, and the short-term focus on the lower support of 3010-3012. Friends must keep up with the rhythm. Gold operation strategy reference: short gold rebounds near 3030-3034, with a target of 3020-3015, and long gold callbacks near 3010-3014, with a target of 3020-3025.
If your current gold operation is not ideal, I hope to help you avoid detours in your investment. The information I recently shared about the gold market has received a lot of feedback, and everyone said it was very helpful! If you don’t know when to enter the market, you can follow me 🌐, I will release specific signals in real time, remember to pay attention to the bottom 🌐 signal in time.

Gold has been in a good range recently, which is perfect!Congratulations to everyone for realizing the range idea again。It should be noted here that since the bulls rose strongly in the early stage, the market turned to bearish, or the rhythm of bullish adjustment will not be so fast. Therefore, yesterday's daily line turned positive, not the return of bulls, but a correction in the process of decline. On the one hand, the adjustment of bulls is not enough, and the indicators show that there is still further exploration. On the other hand, although the current shock has rebounded, the strength is not strong and the continuity is poor. It is a shock upward trend and may fall at any time. Be cautious when looking at bullish. Only by matching the market and the time point can you get the correct direction. Trading focuses on ideas and planning, and doing yourself well is more important than anything else.If your current gold operation is not ideal, I hope to help you avoid detours in your investment. The information I recently shared about the gold market has received a lot of feedback, and everyone said it was very helpful! If you don’t know when to enter the market, you can follow me 🌐, I will release specific signals in real time, remember to pay attention to the bottom 🌐 signal in time.
Gold hourly line pattern chart;
Gold once touched the 3002 line to stabilize, and the daily line level fell back three times in a row. There is still room for decline in the short term. Pay attention to the obvious support of the 3000 mark below. If it does not break, it will still be a repeated trend. On the contrary, there will be a continuous decline. In terms of operation, continue to go short on the rebound! Operation suggestion: short at 3025-3030. The target is 3016-3010. On the contrary, if it falls back to 3010-3005, go long and the target is 3020-3025.

So amazing! Accurate again, follow-up strategyToday, the first wave of gold price retreated from around 3026 to around 3013 in the Asian session. The lower support is obviously moving up gradually. Yesterday's white session also started to rise from above 2310. The two retracements before the US session only reached 3014 before rebounding quickly. At present, the focus on the upper side is the suppression of 3030-35. The hourly line of gold is now oscillating in the range box. Only after gold breaks through the box, will the gold market appear. Gold hit the 3035 line on Tuesday, but gold quickly fell back after hitting the high. We actually shorted at the 3032 line. The perfect harvest was harvested after stepping back. Gold did not break through the 3030-35 line suppression we mentioned above. If it breaks through the 3035 line and stands firm, then the bulls will rise and hit a new high. Our operation of stepping back to do more ideas remains unchanged, but we should not chase more directly, otherwise the adjustment of stepping back will be more uncomfortable. Be a steady hunter and wait quietly for the appearance of prey.
From the 4-hour trend, the upper short-term resistance focuses on 3030-35, and the lower support focuses on 3000-3005. Relying on this range, the layout of the long and short oscillation range is maintained. In the middle position, watch more and move less and chase orders cautiously, and wait patiently for key points to enter the market. I will inform you of the specific operation strategy in time. Gold operation strategy: 1. Go long when gold falls back to 3010-3000. If the subsequent market breaks through the 3035-3040 resistance line, we will adjust whether to go short based on the technical and news aspects and notify everyone in time.If your current gold operation is not ideal, I hope to help you avoid detours in your investment. The information I recently shared about the gold market has received a lot of feedback, and everyone said it was very helpful! If you don’t know when to enter the market, you can follow me 🌐, I will release specific signals in real time, remember to pay attention to the bottom 🌐 signal in time.

Interval oscillation, opportunities are within your graspMy dear friends, the gold range idea has been fulfilled again. Do you still remember the batch shorting gold strategy we laid out before? Facts have proved that our vision and judgment are extremely accurate! At present, the gold price has successfully reached the target area. Congratulations to everyone for making a profit again. This wave of operations is simply beautiful. I am honored to be recognized and encouraged by everyone. We set sail on the road of trading. I will bring my trading strategy plan, and you will bring your execution discipline. I believe we will definitely have good results.
But investment is never a one-shot deal. The current profit is only a phased result. The gold market has always been turbulent, and the subsequent trend is full of uncertainty. The operation strategy plan can first refer to the unchanged range thinking method I mentioned earlier, the high-altitude and low-multiple operation strategy, and conduct in-depth technical and news analysis. Gold will temporarily maintain a volatile thinking approach. The large range focuses on 3035-3000, and is in horizontal consolidation. In the 4H cycle, the Bollinger Bands are also in a closed state, and the K-line is interlaced at the middle track. In the short-term sideways consolidation and accumulation stage, the operation relies on 3035 as the critical point of adjustment. Below this position, continue to look at the callback, recover and stabilize, and then adjust the thinking. Pay attention to the support of 3012 and 3000 below. Maintain high-altitude and low-multiple operations as a whole, and follow up after the breakthrough. The specific operation is combined with the short-term pattern. Once there is a new change, I will inform you as soon as possible. Operation suggestion: Gold is short near 3030-35, and the target is 3020 and 3015! It is long near 3010-3000. The target is 3015 and 3026!If your current gold operation is not ideal, I hope to help you avoid detours in your investment. The information I recently shared about the gold market has received a lot of feedback, and everyone said it was very helpful! If you don’t know when to enter the market, you can follow me 🌐, I will release specific signals in real time, remember to pay attention to the bottom 🌐 signal in time.

Go long and win, then go short on the reboundToday, the layout of gold is to go long in batches near 3005-3008, and 3020 is a successful profit. Now the rebound continues to go short.
In terms of the daily line structure, yesterday's rebound of gold first touched the pressure of the 5-day line, and then the market retreated to the vicinity of the 10-day line. The overall trend is in line with expectations, fluctuating within the daily average range, and the rhythm of rising first and then falling also increases the expectation of the continuation of the short-term market adjustment. The pressure of the 10-day line can continue to be paid attention to on the upper side of gold during the day, but the 10-day line has now moved down to the vicinity of 3027, and today's market opened near the 5-day line 3012. Combined with the trend of the hourly chart, gold fell again to the vicinity of 3000 overnight, indicating that the short-term trend still follows the technical trend, but the main sentiment of the market is still controlled by the bulls. If the fundamentals unexpectedly break out with good news, the bulls' sentiment may go crazy at any time. In the day, we can pay attention to the pressure near the short-term trend line 3025 on the upper side of gold, and continue to pay attention to the competition around 3005-00 on the lower side. If 3000 is lost, we will look for a larger space to retrace. If the market has been fluctuating above 3000 today, the risk of short-term market variables will increase.
For specific operations, it is recommended to be short at 3020-3025, and look at 3015-3005.
If your current gold operation is not ideal, I hope to help you avoid detours in your investment. The information I recently shared about the gold market has received a lot of feedback, and everyone said it was very helpful! If you don’t know when to enter the market, you can follow me 🌐, I will release specific signals in real time, remember to pay attention to the bottom 🌐 signal in time.

The opening situation is clear, practical guideGold news:
The rise of the US dollar index benefited from Trump's tariff policy. Just yesterday, Trump suddenly announced: a 25% tariff on the purchase of oil and natural gas from Venezuela, and claimed that individual tariffs would be reduced. The market's tense nerves were released, and the US dollar index rose sharply. As the end of the month approaches, the market needs to rebalance its investment portfolio, increase the allocation of US dollars to hedge against unknown risks, and push the US dollar to continue to rise. Yesterday, the market news was light. Today, the market will welcome the speech of Federal Reserve Board Governor Kugler on "Economic Outlook and Entrepreneurship". Immediately afterwards, New York Fed Williams will speak at a public event. In addition, there is the March Conference Board Consumer Confidence Index at 10 pm. The above events and data are concentrated in the evening tonight, which will have a certain impact on the market and need to be paid attention to. The price of gold has begun to retreat from its historical high, and the power of safe-haven buying has eased. This retreat momentum is expected to intensify further, especially in terms of technology.
Gold technical analysis:
Currently, the price of gold is running in a similar triangle range, and the correction cycle is prolonged. On the one hand, the bulls rebounded after the pressure, and it was difficult to return to the strong position directly; on the other hand, the retracement was supported by the key top and bottom conversion support belt of 3005-3000. This trading day focuses on the gains and losses below the low of 3000 at the end of last Friday, and the breakthrough below the 3030 pressure line above. If it fails to break through, it is likely to fluctuate around this range during the day.
Gold operation suggestions: short near the rebound of 3020-3025, long near the retracement of 3000-3005.
The two orders of gold on Monday were perfectly grasped, and now everyone has made a profit. The two orders on Monday ended perfectly. If your current gold operation is not ideal, I hope I can help you avoid detours in your investment. The information I recently shared about the gold market has received a lot of feedback, and everyone said it was very helpful! If you don’t know when to enter the market, you can follow me 🌐, I will release specific signals in real time, and remember to pay attention to the bottom 🌐 signal in time.

Gold (XAU/USD) Technical Analysis – Bearish Rejection Expected fThis chart represents an analysis of Gold (XAU/USD) on a 30-minute timeframe. Below is a breakdown of the key elements:
Key Observations:
Downtrend Formation
The price is trading within a downward channel, marked by two descending trendlines.
The overall trend appears bearish, indicating potential further declines.
Supply Zone (Resistance) Around $3,025 - $3,030
The price is approaching this key resistance area.
If the price fails to break above, it could lead to a rejection and continuation of the downtrend.
Demand Zone (Support) Around $3,000 - $3,006
This is the target area where buyers may step in to support the price.
A downward move towards this zone is anticipated.
Projected Price Movement
The blue arrows suggest a bearish scenario.
A rejection from the supply zone is expected to push the price downward.
The final target is the demand zone near $3,000.
Conclusion:
Bearish Bias: The price is currently in a downtrend, with the expectation of a rejection from resistance and a move toward the lower support zone.
Confirmation Needed: Watch for price action signals, such as rejection wicks or bearish candlesticks, to confirm the downward move

3000 is not broken, the rebound points to a new trendIn the current gold market, the downward trend is more obvious. However, it is noteworthy that gold has tested the key point of 3000 many times, and each time it breaks through, it is unstable. This fully shows that the defense above the 2995-2990 support area is extremely strong and difficult to be effectively broken in the short term.
Combined with the downward momentum observed in the 3000 point range, although it is in a downward trend, the possibility of a sharp decline is extremely small. Judging from the comprehensive judgment of technical analysis and market sentiment, gold will not only not continue to fall, but will most likely rebound. It is initially estimated that the rebound target will reach the area around 3015, and it is very likely to extend further to the area around 3025-3035. Let us look forward to the performance of gold together!
The content I shared recently about the gold market has received a lot of feedback, and everyone said it was very helpful!If you don’t know when to enter the market, you can follow me 🌐, I will release specific signals in real time, and remember to pay attention to the bottom 🌐 signal in time.

Gold (XAU/USD) Bearish Outlook: Key Levels to WatchBuddy'S dear friend SMC Trading Signals Update 🗾 🗺️
This chart represents the price action of Gold (XAU/USD) on a 1-hour timeframe, showing potential areas of resistance, support, and liquidity zones. Here’s a breakdown of the analysis:
Analysis of the Chart:
1. Resistance Level (3,023-3,030 zone)
The price has reacted multiple times (red arrows), indicating strong selling pressure.
A fair value gap (FVG) is present, suggesting potential mitigation before further movement.
2. Current Price (3,011.76)
The price is trending downward after rejecting the resistance level.
It is approaching the diamond zone, a potential short-term support before continuation.
3. Key Support Levels:
Diamond Zone (~3,000 region)
Could cause a temporary bounce before further decline.
Order Block (~2,952-2,938 zone)
This is a strong demand zone and a potential target area for price action.
4. Target Levels:
The analyst expects a downward move toward 2,952, aligning with a liquidity grab scenario.
5. RSI Indicator:
RSI is at 44.27, suggesting bearish momentum, with the possibility of further downside.
A break below 40 RSI may confirm more selling pressure.
Mr SMC Trading point
Risk Management Considerations:
Entry: A possible short entry could be around the FVG level (~3,020-3,030) if price retraces.
Stop Loss: Above 3,035 to avoid being trapped in a fake breakout.
Take Profit: Around 2,952-2,938 as per the target point.
USD Update & Impact on Gold:
If USD strengthens, gold may drop further due to their inverse correlation.
Key upcoming economic data (interest rate decisions, inflation reports) could increase volatility.
Pales support boost 🚀 analysis follow)

Another Strong Start to the Week!Gold opened the week on a positive note without a significant pullback, rebounding quickly after touching a low of 3013. The overall price action remains range-bound with a bullish bias, though gold is still trading within the lower to middle Bollinger Bands. A clearer upside move may emerge once the correction phase concludes.
In the short term, resistance remains at the 3030-3040 zone. If this level holds, short positions can be considered. On the downside, key support levels to watch are 3012 and 3005, with the 3005-3000 range offering a potential buying opportunity.
Trading Strategy:
- Sell near 3030-3040resistance if it remains intact.
- Buy around the 3005-3000 support zone.
- Adopt a range-trading approach, focusing on shorting near resistance and buying near support.
I have always been glad that I can stick to my original intention. I can be dedicated to every friend who proposes cooperation. I will use my professional strength to help you make profits, recover your capital, and increase your funds. My reputation depends entirely on the publicity of customers. My strength has been honed in actual combat for a long time. Even if the road ahead is bumpy, as long as you give us trust, we will do our best to guide you and use your funds to the maximum effective limit, so that you can experience the feeling of profit in the ups and downs of the market! If you don’t know when to enter the market, you can pay attention to my 🌐 signal. I will release specific signals in real time. Remember to pay attention to the 🌐 signal in time.

GOLD ALERT | BIG DROP LOADING!🏦 Institutions Are Taking Profits – Are You Ready for the Next Move?
For the last 4 weeks, institutions have been reducing their long positions on #GOLD ( OANDA:XAUUSD ). This is exactly what I warned about – profit-taking from big players, signaling potential downside ahead.
technical down

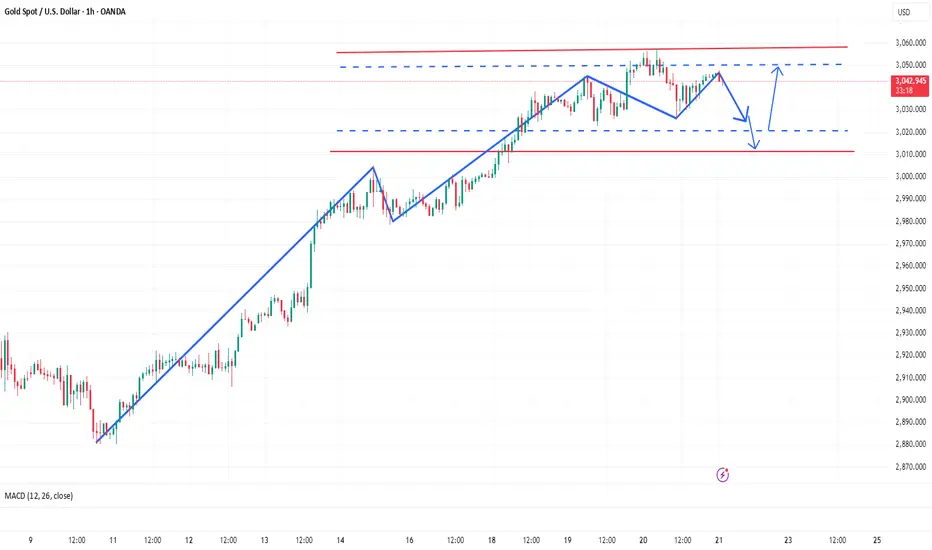
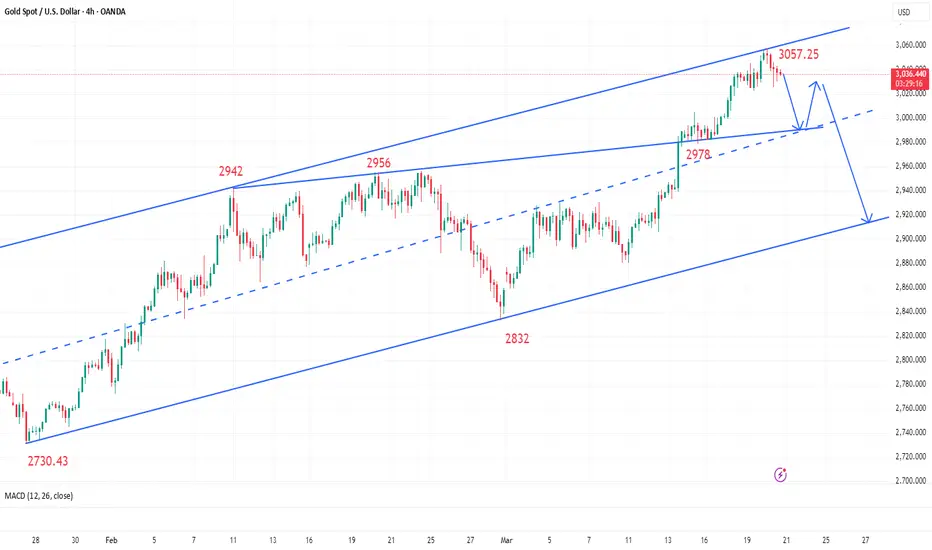
Go short first, then go long, and grasp the rhythmGold overall rose and fell last week. After three consecutive positive weekly lines, the upper shadow line was closed. On Friday, it walked out of the adjustment space. The short-term rise slowed down slightly, and it was more inclined to fluctuate at a high level. The daily line turned negative and retreated to correct, and it was in a partial adjustment stage. In the 4H cycle, it did not stabilize above the 3047-57 mark mentioned earlier, so it walked out of the second downward exploration space, but combined with the intact structure of the three-month rising channel, the current retracement is more inclined to technical correction rather than trend reversal. From a spatial point of view, the 3030 line as the midpoint of the channel constitutes the primary resistance. If this position cannot be effectively broken through, the gold price may test the support of the 3000 integer mark downward. It is worth noting that the static resistance formed near 3050 resonates with the recent fundamental negatives, further suppressing the upward space.
The current strategy needs to focus on whether the 3026 opening high can be recovered in the oscillation range. If it stabilizes, it will be seen to 3035 last week's opening point; on the contrary, if it falls below the 3010 short-term moving average support, the shorts can follow the trend to the expected 3000 mark. It is recommended to adopt the range trading mode, and operate back and forth between high and low in the range of 3000-3035. Technically, we need to be alert to the stagflation signal formed by the continuous shortening of MACD and the closing of Bollinger Bands. It is recommended to avoid chasing highs and focus on the impact of US CPI data on the market.
Gold operation advice: Go short after rebounding around 3030-3040. Go long after stepping back to 3010-3000.If you don’t know when to enter the market, you can follow me. I will release specific signals in real time. Remember to pay attention in time.

Next week's market strategy analysisGold fell on Friday, falling to the lowest level of 2999 and then began to rebound strongly. Overall, if we say that gold has peaked now, it is too early, because there are still many uncertainties to stimulate the increase in risk aversion, so it is possible that gold will rise again. However, the impact of the news is only one aspect of our reference. However, the impact of news is only one aspect for our reference. After all, a lot of information cannot be known in time. We can only say that we should pay attention to the existence of this risk factor, so we still start from the technical level. There is still room for gold to rebound next week. We will first focus on the short-term suppression of 3025-30.
From the hourly analysis, pay attention to the support of 3005-3000 below. If it does not break after the retracement, continue to be bullish. Pay attention to the short-term suppression of 3025-3030 above, and focus on the suppression of 3045-57 above. The operation still maintains the same rhythm of the main multi-trend. If you don’t know when to enter the market, you can pay attention to me. I will release specific signals in real time and pay attention to it in time.
Gold operation strategy for next week: Gold will go long after stepping back from 3005-3000, and the target is 3025-3030.

Golden Strategy Perfect HitWalk together and witness the harvest! In the ups and downs of the trading market. With the trust and persistence of my trading strategies and trading plans, everyone successfully pocketed the fruits of victory. Sometimes you don't even need to know how to trade. Having an accurate and precise analysis guide is crucial and is the basis for profit. Similar accurate signals are available every day. Traders don't know when to enter the market? Then you can follow me. When the opportunity comes, I will promptly release more accurate signals in my trading center. Welcome everyone.

Profit again, follow-up operation strategyBrothers, as I mentioned in my last opinion, gold is facing support below 3030-3020, so I still prefer to go long on gold in terms of trading. Today, we went long on gold near 3023 according to the strategy of short first and long later. Just when gold rose to around 3038, I manually closed my long position and easily made a profit of 140 pips again.
Today, Friday, gold hit the highest level of 3047 in the morning and started to fluctuate and fall. As of now, gold has hit the lowest level near 3021 and started to rebound. The 3025-15 line below is also the support position we have been talking about. Here we can find opportunities to intervene in long orders. We must be cautious in operation on Friday. All profits have been made this week. Since the announcement of the US interest rate decision, gold has been running all the way and has set a new record high again. Again, don’t chase gold at high levels, look for opportunities to go long when it falls back, and the operation is mainly to go long when it falls back. If your current gold operation is not ideal, I hope I can help you avoid detours in your investment. Welcome to communicate with us!
From the 4-hour analysis, the short-term support of 3025-3015 is concerned, and the important support of 3000-05 is focused on. If it does not break, it will continue to be bullish. The upper target is to pay attention to the upper pressure. Before the daily level does not fall below the lower support, the main long rhythm will remain unchanged. I will inform you of the specific operation strategy in time, so please pay attention to it in time. Gold operation strategy: Gold will go long after stepping back on the 3025-3015 first line.

GOLDHello friends
We have created a good pattern, let's see if the price will work or not.
What do you think?
*Trade safely with us*

Gold's pullback is the last chance to get on boardAccording to our previous operation strategy of short first and long later, the short position has perfectly reached our target area, and the position was closed in time to lock in the profit. Next, we will go long after the rebound and continue to look forward to the performance of the gold market.
The Bollinger Bands in the H4 chart are closing, and the golden cross of the 13-day moving average and the 21-day moving average is slowing down, suggesting that the short-term long and short competition is fierce. Focus on the strong resistance in the 3050-3055 range on the upper side during the day, and the probability of breaking through is low. The support below is at 3022-3015, forming a double insurance. The small cycle now also has the performance of high-level fluctuations, but it still lacks some certainty. For example, the Bollinger Bands in the H4 cycle are closing. Today's rise is not optimistic about setting a new high again. The upper high point is suppressed to around 3050, and the downward movement must break the Bollinger middle rail support, and the space below can see 3000. Therefore, today we should not only remind everyone to wait patiently for the decline to go long, but also remind everyone to try to go short at the high of 3050, and then look at today's adjustment space, as well as the support points and key points below. Again, gold maintains a bullish trend for the time being.
Gold's retracement to 3020-3030 is the last chance to get on board. You will regret it if you miss it. Gold operation suggestion: Buy more near 3020-3030, target: 3050
Brothers, you must keep up with the rhythm. If you are interested, you can follow me. Communicate real-time market conditions, follow up on real-time orders, read bottom signals, interpret daily market conditions, share real-time strategies, and don't blindly follow the trend.

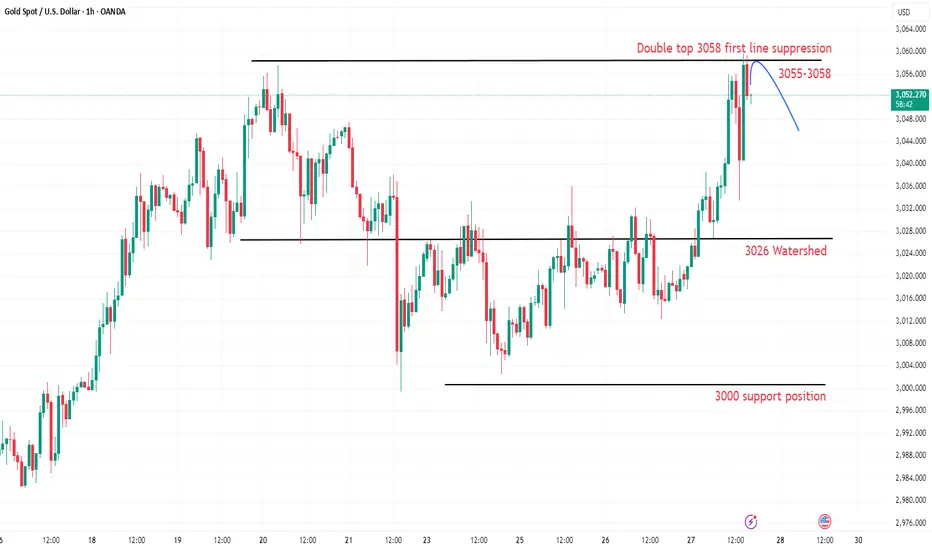
Gold has short-term callback demandGold hit a high of 3057 and then fell back. The daily line closed with a negative cross star, and a correction is needed in the short term. The daily resistance is near 3050. It touched 3047 in early trading and fell back. If the market falls below 3042, continue to look at 3030-3025. The operation is the same as what I said in my previous post. First short and then long. In addition to the low point, the support below is 3020. The strong support is around 3011. You can go long if it is touched.
Operation suggestion: short at 3050-3040 above, and go long at yesterday's low or 3025-3015 below. It is still in line with expectations.
Friends must keep up with the rhythm. If you are interested, you can follow me. Welcome to experience, exchange real-time market conditions, follow real-time orders, read bottom signals, interpret daily market prices, share real-time strategies, and do not blindly follow the trend.
Gold 40-45 short, longs temporarily stopGold, after touching the 57 line, began to retrace and correct. Before the US session, it touched the lowest level near 25 and then stopped. However, the US session rebounded slightly, forming an interval shock, but did not form a second breakthrough. The high break is also likely to be the high point in the short term. After all, the European and US sessions are relatively weak, so the bulls in the short term may need to reorganize their energy and achieve a digestion correction effect. The support below is still maintained at the low point of 20 that has been generated many times in the recent period. This position is also likely to be the watershed line of the long and short positions in the recent period. Once this position continues to break down, it is likely to continue to form a retracement in the later period. The upper suppression port maintains the head and shoulders top pattern of 45 formed in the short term. The daily moving average system will continue to maintain an upward situation, but the retracement may also temporarily bring the bulls to an end. We will still operate around the short-term short position. If gold rebounds to short near 40-45 during the day, the target will be around 30-20. Friends must keep up with the rhythm. Control positions, and the specific points are mainly based on real-time intraday trading. If you are interested, you can follow us. Welcome to experience, exchange real-time market conditions, and pay attention to real-time orders. You can read bottom signals, interpret daily market conditions, and share real-time strategies. Don't blindly follow the trend.

Gold hovers at a key position, clever layoutGold fell from a high of 1 hour. If gold continues to fall, then if gold rebounds and does not break the new high, then gold may show the embryonic form of a head and shoulders top in 1 hour. Again, gold fell from a high, and now it is at a high level. Don't chase more easily. After the news, the gold bulls' volume has been digested, and the gold bulls need to regain support. Gold rebounded under pressure at the high point of 3045 in the US market, and continued to go short at highs. The market is changing rapidly, and gold has entered an overbought state, so gold needs to be cautious in chasing more. On the whole, today's short-term operation of gold is recommended to be short-selling on rebounds, supplemented by long-selling on callbacks. The short-term focus on the upper resistance of 3050-3060, and the short-term focus on the lower support of 3025-3010, friends must keep up with the rhythm. To control the position, the specific points are mainly based on the real-time intraday. If you are interested, please follow us. Welcome to experience, exchange real-time market conditions, and pay attention to real-time orders.
You can read bottom signals, interpret daily market trends, and share real-time strategies. Don't follow the trend blindly.
GOLD TRADING POINT UPDATE > READ THE CHAPTIAN Buddy'S dear friend
SMC Trading Signals Update 🗾🗺️ Gold Traders SMC-Trading Point update you on New technical analysis setup for Gold 🪙 list time post signals 💯 reached target point 3059. ). Analysis update on gold. Gold look 👀 patterns chart 📉 sellers recover and strong 💪. 30M time frame 🖼️ looking short trend 📉 target 🎯 point 3001 that entry buying said good luck 💯
Key Resistance level 3042 + 3046
Key Support level 3006 - 3001
Mr SMC Trading point
Palee support boost 🚀 analysis follow)
