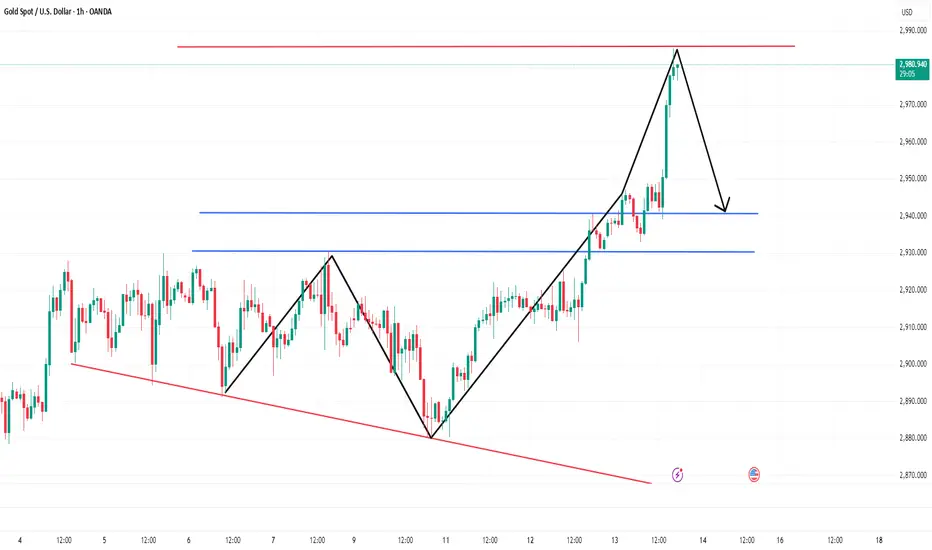
Gold accelerates to the top! The plunge alarm has soundedThe gold market has reached a critical point! Driven by the strong risk aversion sentiment, the price of gold has soared all the way, quickly breaking through many resistances and accelerating to the vicinity of 2985. However, if you look closely at the K-line chart, you will find that this round of rise is mainly stimulated by news, and there is strong resistance in the vicinity of 2985. Fortunately, we have already made arrangements. We have set the number of transactions reasonably before shorting. The current margin level is sufficient to support us in dealing with the current situation. At this time, it is a good time to increase positions. We can boldly increase positions and short in the 2977-2983 area, appropriately increase the number of transactions, lower the average price, and wait for gold to fall back to the 2940-2930 area. All positions will be decisively closed to achieve a turnaround, secure the bag, and lock in profits.
You can read bottom signals, interpret daily market trends, and share real-time strategies, so you no longer blindly follow the trend.
Goldpreis
GOLD(UPDATE)Hello friends
Considering that we are at a price ceiling and the power of buyers has decreased and we are witnessing the formation of lower ceilings, we can enter a sell transaction if the resistance level is not broken, of course with capital and risk management.
This analysis is reviewed only from a technical perspective.
*Trade safely with us*

All units pay attention to gold 2975 directly short 2800 seePrepare for a sharp drop
Gold is ready to plummet, and the notification has been in place. The current price in the 2970-2975 area is short, and it is ready for a sharp drop. This sharp drop will be below 2800. I have told you in advance
The crazier gold is, the more it will plummet. The whole network is bullish. What are the dealers doing? It must be an unconventional trend. Enter the market at a short speed
You can read bottom signals, interpret daily market trends, and share real-time strategies, so you no longer blindly follow the trend.

Gold is about to fall, and the secret behind itFrom the hourly chart, the gold price rose rapidly from 2932 to 2946 in the morning, showing the strong power of the bulls. But in the afternoon, the situation suddenly changed, and the price quickly fell back from 2946 to 2932, and the bulls and bears played fiercely. In the European session, gold once again exerted its strength and climbed from 2932 to 2948. Combining the characteristics of the Asian and European sessions, it is not difficult to find that gold has a tendency to go back and forth in a certain range again. Looking back at the rebound from 2880 to 2948, it is very similar to the trend of the early March. That is, after a wave of short-term continuous positive pull-ups, it will enter a box-shaped oscillation state and last for several hours, and then start a short-term continuous positive pull-up again, and then fall into a box-shaped oscillation cycle again. The pressure formed by the upper rail of the channel 2951-53 line. If the gold price is under pressure here, there is a high probability that it will fall back repeatedly, and the target area is 2930-2920. Even reaching the 2910 area.
You can read bottom signals, interpret daily market trends, and share real-time strategies, so you no longer blindly follow the trend.

Gold fake breakthrough, 2939--2945 is open shortBecause it is not a unilateral trend at the moment, it does not have the momentum for continuous rise. Without the promotion of events, it is extremely difficult to break the historical high. The market has the 80/20 rule. Before 2910-2920, many analysts asked you to short gold at a high position, but you were slapped in the face by the surge in gold. Now many analysts also suggest that you should go long after a decline. Today, gold will definitely plummet and slap you again. The bookmakers have also figured out the order-making methods of such analysts, and these analysts have been reduced to fish meat. Only a few people can judge clearly that gold will continue to fluctuate at present. This position is a false breakthrough, which is a bait thrown by the dealer to trap a group of people.
In the 4-hour cycle, the gold price is in the shape of a trumpet. Today's high point just touches the pressure line. Without saying too much, the opportunity is given to enter the market quickly to short in the 2939-2945 area.
Now let's witness the market being controlled by us.
You can read bottom signals, interpret daily market trends, and share real-time strategies, so you no longer blindly follow the trend.

The downward trend is clear at a glanceCPI inflation in February recorded the slowest growth in four months, bringing a slight relief to the stagnation of the anti-inflation process in the past few months. According to data released by the U.S. Bureau of Labor Statistics on Wednesday, after a sharp increase of 0.5% in January, the CPI in February increased by only 0.2% month-on-month, lower than the expected 0.3%, the lowest since October last year, and the year-on-year growth slowed to 2.8%, the lowest since November last year, lower than the previous value of 3% and the market expectation of 2.9%. After the data was released, gold once stretched to around $2,920, and then fell again to a low point near 2,905-06. After touching 2,905, it returned to support and then rebounded. As of now, the highest point is the rebound to around 2,940. It can be seen that the rise from 2,832 to the present is basically in the abc rising wave shape. At present, the upper 2940 is the 618 suppression point. If it cannot effectively stand at 2940, there must be a consolidation, and it must fall back. Secondly, 2920 was the high point of gold in the early stage. After breaking through, 2920 has become a support position. Therefore, if it cannot break through 2942, there is a high probability that there will be a wave of support 2920. Even lower 2900 area.
You can read bottom signals, interpret daily market trends, and share real-time strategies, so you no longer blindly follow the trend.

The Mystery Behind the Crazy Rise of GoldGold surges upwards as soon as it is stimulated by the news, but this momentum is not expected to last long. On the contrary, it is a good opportunity to short at high levels. From a macroeconomic perspective, the current global inflation expectations and monetary policy trends are profoundly affecting gold demand. In terms of technical indicators, MACD shows that although bullish energy is being released, KDJ has entered the overbought zone. It is expected that in the short term, after gold touches the resistance range of 2938-2945, it will continue to increase short positions, with the target of 2920-2910, accurately grasp the band opportunities, and achieve profit goals with the help of the possible callback market.
You can read bottom signals, interpret daily market trends, and share real-time strategies, so you no longer blindly follow the trend.

Gold is facing resistance to rise, and a fall is imminentGold CPI is bullish, but gold still has not broken through. This shows that the resistance of gold at high levels is still not to be underestimated. So gold will continue to fluctuate within the range, and high levels will continue to be short. Gold is currently priced at 2925-2935 and is directly shorted! The target area is 2915-2905.
Gold fluctuates in 1 hour, and there is not much to say. Gold is directly shorted. Gold still cannot break through upwards under so many bullish supports. The result is that gold bulls will lack confidence, giving gold bears an opportunity to take advantage.
You can read bottom signals, interpret daily market trends, and share real-time strategies, so you no longer blindly follow the trend.

Successfully arrived at the target areaAfter the release of CIP data, bullish factors stimulated gold to fluctuate in a small range, which once made people feel that the market trend was full of variables, but we always adhered to the established plan and were not disturbed by short-term fluctuations. As expected, the price quickly turned downward and accurately reached the target area near 2907. This operation successfully gained 170pips, which used strength to interpret the accurate grasp of market trends. In the future, I will continue to pay attention to the market situation and seize every opportunity to share with you.
You can read bottom signals, interpret daily market trends, and share real-time strategies, so you no longer blindly follow the trend.

The plan is to move forward steadily without deviationGold fluctuated at a high level during the day, and fell back after hitting the 2925 line in the European session, which was consistent with our expectations. There will be CPI data tonight, and there will be large short-term fluctuations. Pay attention to the impact of the data. In the 4H cycle, the white market has continuous high cross stars, and the Bollinger Bands are still closing in parallel. It will continue to fluctuate at night, but because the daily cycle is still bearish, the operation will fall back to the key position and then go short. Yesterday's low point was 2906, and the upper pressure was 2925-2930. Pay attention to the gains and losses of key positions after the data. We will pay close attention to market trends and grasp the subsequent market trends in a timely manner.
You can read bottom signals, interpret daily market trends, and share real-time strategies so that you no longer blindly follow the trend.

The ruthless sickle finally fell, and the price of gold plummeteFrom the perspective of technical analysis, the technical graph of the gold price trend chart is like a clear marching road map. At this moment, if you are eager to gain profits in the gold market, shorting gold may be the strategy you dream of. Choose to enter the market decisively when the price rebounds to the key resistance level of 2915-2925, and exit the market decisively when the target is 2910-2900. Only in this investment battle can you win the game and reap rich returns. Wish us good luck! Brothers, have you followed me to short gold?
You can read bottom signals, interpret daily market trends, and share real-time strategies, so you no longer blindly follow the trend.

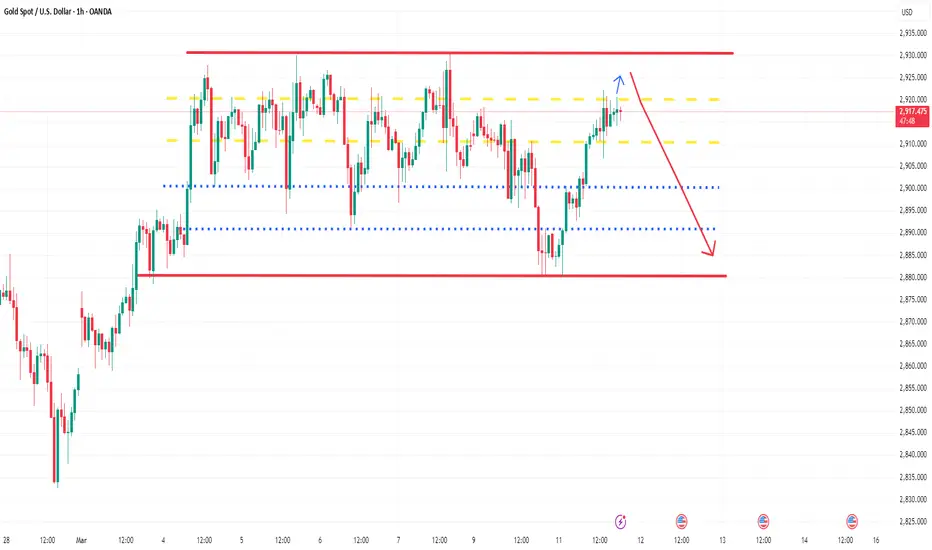
Gold rebound momentum is exhausted, it is time to short at highsYesterday, the price of gold continued to rebound but the momentum was insufficient. International spot gold fluctuated narrowly in the range of 2905-2922 US dollars and closed at 2912 US dollars, up 0.8% from the previous day. The disk shows that the price of gold failed to hit the key resistance zone of 2920-2930 US dollars three times. This area superimposed the upper track of the previous falling channel and the Fibonacci retracement level, forming a double technical barrier.
From the technical structure, 2922 US dollars is the primary pressure level of the day. A breakthrough needs to stand firm at the integer level of 2925 US dollars. The lower 2905 US dollars is the recent long-short watershed. If it effectively falls below, it will test the previous low support of 2894 US dollars. It is worth noting that the holdings of the world's largest gold ETF have been net outflows for three consecutive days, reflecting the cautious attitude of institutional investors before the Fed's interest rate decision.
Gold operation suggestions: Add short positions near the rebound of 2916-2922, target 2910-2900
You can read bottom signals, interpret daily market trends, and share real-time strategies, so you no longer blindly follow the trend.

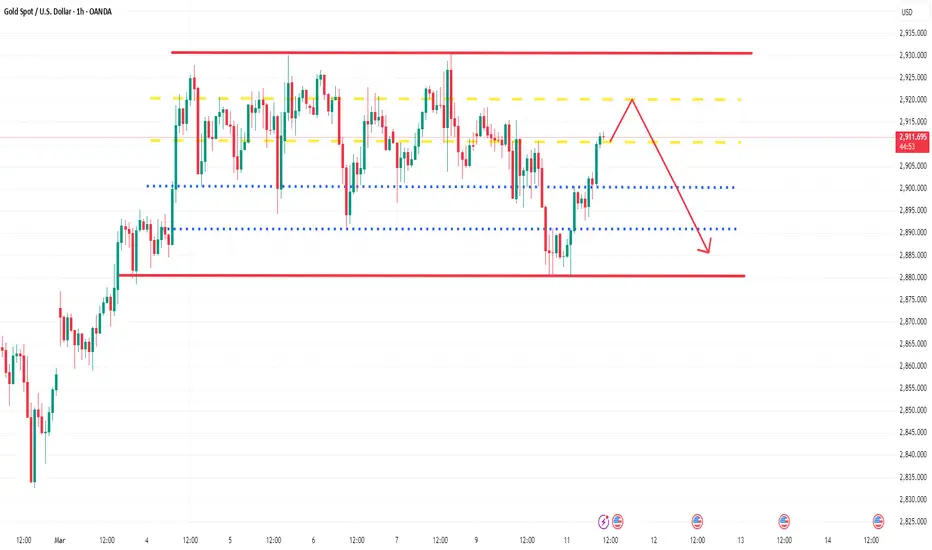
Exposure of golden selling points, missed blood lossOn the daily chart, gold prices closed with a volatile cross star in the 2880-2915 range. The MACD indicator completed a "false golden cross" above the zero axis and the momentum quickly decayed, suggesting that the short-term long and short forces have entered a dynamic balance stage. It is worth noting that the 2880-2875 area has formed three effective tests, and its support strength has significantly increased compared with the previous two weeks. However, the combined pressure zone of the MA5 moving average turning down and the 2900 integer mark is forming a 15-dollar wide long-short game zone. In terms of key resistance levels, 2915 and 2930 (March rebound peak) constitute a double technical barrier, and any one of them must be broken to open up the upward space.
The H4 cycle shows that since the rebound from the low of 2865 in February, the gold price has completed 7 oscillations in the 2850-2930 box. The current RSI (14) indicator is horizontally oscillating in the 45 neutral area, and no obvious overbought/oversold signals have appeared. The Bollinger Bands continue to narrow to a width of $12, indicating that there will be directional choices in the short term: if the 2900 mark is stabilized, the upper track of the H4 Bollinger Bands at 2925 may be broken; if the 2880 support is lost, the lower side will test the previous transaction concentration area of 2850-2830.
Gold operation suggestions: Continue to short around 2920-2925, target 2905-2900
You can read bottom signals, interpret daily market trends, and share real-time strategies, so you no longer blindly follow the trend.

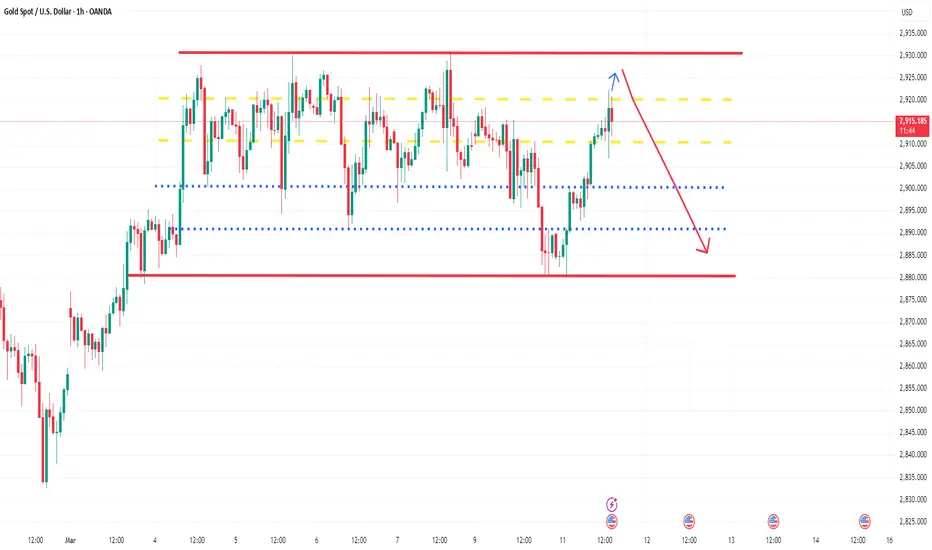
Shorting gold is a big win, and lower points are in sightLast week's non-agricultural data still did not show a big direction, and it is still moving around the high range. At present, short-term operations are still the mainstream. Don't blindly wait for a big drop. The high point last night is gradually lowering. The point of entering the range can be slightly adjusted according to market changes. The current upper resistance is mainly concentrated in the 2922-2926 area, while the lower side is strongly supported by the 2894-2890 range. If it rebounds above 2918-2925, continue to increase your position and short, with a target of 2910-2900.
You can read bottom signals, interpret daily market trends, and share real-time strategies, so you no longer blindly follow the trend.
Bearish and falling, the trend of gold is under your controlThe trend of the gold market is just as we expected, fluctuating around 2920. We decisively arranged a short position in gold and have already made considerable profits. The market is bearish, and all signs indicate that the price of gold is expected to further drop to around 2895. We will pay close attention to market dynamics and grasp the subsequent market in time.
You can read bottom signals, interpret daily market trends, and share real-time strategies, so you no longer blindly follow the trend.
Go short first and then go longAnalysis of the latest trend of gold market:
Analysis of gold news: On Tuesday (March 11), spot gold rebounded slightly in the European session and is currently trading around $2909.09/oz. Overnight, the price of gold fell by 0.79%, falling below the $2900 mark. During the session, it once refreshed a low of nearly a week to $2880.19/oz. Zelensky visited Saudi Arabia, and the United States was optimistic about the talks between U.S. and Ukrainian officials. The market's concerns about the geopolitical situation have cooled down; in addition, the market value of the U.S. stock market evaporated by $4 trillion, increasing investors' demand for holding currency, further promoting gold bulls to take profits. This trading day focuses on the vacancies of the U.S. JOLTs in January. In addition, U.S. and Ukrainian officials held talks in Saudi Arabia
Technical analysis of gold:
Gold rebounded after testing the support area near 2880 yesterday, and is currently touching around 2910. Gold looks relatively strong. However, gold has not been able to break through the 2920-2930 area for a long time recently. This area has formed an absolute suppression in the short term. In the process of testing support, gold has fallen below 2900 and even 2890 many times. It can be seen that the support below is not solid, and after repeated testing and breaking, the strength of the support below is gradually weakening.
Therefore, after gold rebounds to the 2910-2920 area, the rebound strength may weaken again, and after facing the previous short-term resistance, gold may fall again. Therefore, in short-term trading, we can still short gold in the 2910-2920 area. It is expected that gold will retest 2900-2980. If gold falls below this area during the test, it may even reach the 2870-2860 area.
You can read bottom signals, interpret daily market trends, and share real-time strategies, so you no longer blindly follow the trend.
Market profits and losses fluctuate, and profits finally landHowever, with accurate judgment and reasonable decision-making, I closed the existing long positions in time to lock in profits when I arrived at the area. In the end, the overall result was still satisfactory profit. It was a victory in grasping the trend. Friends who followed me to do long positions in the 2880-2910 area many times, although they did not achieve the expected results, were still profitable overall. I earned more than 16k in this long position, which is a good trading result. It has been proven to be effective. Others are still waiting and watching, and I directly hit hard and did long gold many times. What if the market did not go completely according to the script? Relying on my years of market analysis and bold operations, I still made a lot of money, and my strength crushed the doubts! For trading strategies for subsequent markets, you can read my previous article. I hope to help everyone and provide you with a clear direction.
You can read bottom signals, interpret daily market trends, and share real-time strategies, so you no longer blindly follow the trend.

The medium- and long-term bullish trend of gold remains unchangeThe daily chart shows that the non-farm payroll data that was lower than expected has strengthened the market's expectation that the Fed will slow down the pace of interest rate hikes, pushing the gold price to form a staged bottom support. The current short-term moving averages (such as the 5-day and 10-day moving averages) tend to stick together and fail to effectively guide the direction, while the MACD indicator has entered a correction cycle, and it may be difficult to quickly expand the gains in the short term. In terms of operation strategy, it is recommended to adopt the idea of "pullback and long". If the gold price falls back to the 2890-2885 range, long orders can be arranged, and the target is above 2920. It should be noted that if the previous high point is not effectively broken through, it may trigger the risk of a second bottoming out. If the target area reaches the 2903-2905 area, we can close the existing long positions first and lock in profits in time. On the whole, although there is a certain adjustment pressure on the short-term technical side, the medium- and long-term bullish trend has not changed fundamentally. Geopolitical risks and expectations of a shift in the Fed's policy still provide solid support for gold prices.
You can read bottom signals, interpret daily market trends, and share real-time strategies, so you no longer blindly follow the trend.

Gold Now Low 2860 $Gold now low possible in near future as 2860 $ ,as per my view, this is price based study, after this price new high is possible .

Gold is still expected to hit the 3,000 markFrom the analysis of gold trend, we focus on the 2880-2870 first-line support below and the 2930-35 first-line suppression above. In terms of operation, we still focus on stepping back and doing long. In the short term, we can continue to do long around this range. Once a breakout of 2930-2935 occurs, gold will inevitably touch the previous high, or even reach 3000.
The fluctuations in the gold market are like a long journey. It has not yet reached its peak, but please believe that every hibernation is for a more powerful take-off. Patiently hold, the harvest often belongs to those who can keep calm, hold on, and victory is ahead.
You can read bottom signals, interpret daily market trends, and share real-time strategies, so you no longer blindly follow the trend.

The trend of gold is all within my predictionThe market fluctuated and was complex, but gold responded accurately to my prediction. It rebounded quickly after reaching the area around 2980, and every step was performed as expected.

GOLD TRADING POINT UPDATE > READ THE CHAPTIANBuddy'S dear friend 👋
SMC Trading Signals Update 🗾🗺️ Gold Traders SMC-Trading Point update you on New technical analysis setup for Gold 🪙 Gold Traders Gold 3 time frame 🖼️ looking FVG rejected point below 👇 2929+ 29209. Technical patterns). Weekly basis setup. )
Key Resistance level 2929 + 2957
Key Support level 2891 - 2848
2832
Mr SMC Trading point
Pales support boost 🚀 analysis follow)

Gold bullish trend signalFrom the 1-hour chart: Daylight saving time will be implemented today, and the US market will open one hour earlier; the current Asian and European sessions are still in a fierce sweep, falling sharply to the 2895 line, and then rebounding to 2915, at which time it began to decline again; for the consolidation with poor continuity, it is better to wait patiently for a relatively low or relatively high level to grasp the ups and downs. Everyone knows the operating range in the past few days, which is 2890-2930, and wait for stability; if it can continue to stabilize in the 2895-2890 area tonight, then continue to be bullish on dips; if it is still under pressure below 2930, then participate in bearish declines on rallies; another point, because it is a sweep and consolidation, it may pierce the key support, such as piercing 2895 or 2890 and then pulling back, and because the overall trend remains upward, breaking through 2930 is generally not likely to pierce, but directly continue to rush; on the whole, today's short-term operation strategy for gold is mainly to do more on pullbacks. The short-term focus on the upper side is the 2928-2930 resistance line, and the short-term focus on the lower side is the 2890-2894 support line. Go long in batches near 2895-2898, with the target near 2915-2920.
You can read bottom signals, interpret daily market trends, and share real-time strategies, so you no longer blindly follow the trend.
