Seize the opportunity to go long on goldTechnical indicators send strong signals, and the gold rising channel has been opened. At this moment, you should decisively go long and follow the trend, so that your wealth can ride on this wave of gold bull market and soar all the way.
You can read bottom signals, interpret daily market trends, and share real-time strategies, so you no longer blindly follow the trend.
Goldpreis

Shorting gold, a precise hit yielded a handsome profitBrothers, as a professional trader, my rich trading concepts and strategies have been widely praised by my friends. Have you followed my trading strategies and ideas to short gold? As I wrote in my previous post, I shorted gold as soon as the price hit the 2925-2930 area and made a profit of more than 200pips. Presumably, as long as the brothers who follow my strategy to short gold, they will definitely gain a lot of profits.
I always believe that profit is the standard for measuring strength. I want to tell you that I never talk in vain. Everything is based on trading data. The cake is only so big. When others have started to taste it with me, are you still hesitating? Remember, as long as you follow my trading strategy and ideas, wealth will inevitably come to you. There is still a lot of time today. Let's keep working hard. I believe we will gain more profits.
Brothers, profit is the ultimate goal of trading, and accumulating profits is what changes your life and destiny. Wise choices are far more important than hard work. If you want to copy trading signals, make stable profits, or want to learn the correct trading logic and skills in depth, you can consider joining the channel at the bottom of this article.

Gold price falls back and continues to go long!Gold price breaks low and rises, breaks high and falls, 2920-2893 breaks through to determine the right to speak
Overnight, we went long at 2900 for gold, there are many layouts at this position, the big positive line went straight up to the sky, directly reached above 2920, and realized the harvest of long orders. At present, it is still in the form of longs. We still choose to go long at 2900, and low long is inevitable. The upper side is still looking at the historical high of 2956

The idea of going long on gold first is completely correctBrothers, are you bold enough to go long on gold in the 2910-2900 area according to my strategy today? The decision to go long on gold this time is very clear. As I wrote in my last post, the trend of the gold market is perfectly in line with my expectations. And I have always firmly implemented my strategy and strictly followed my ideas to go long on gold. Today, I have also made a lot of gains. Brothers, how about you? Have you also made a lot of profits?
In fact, as long as you grasp the rhythm, it is easy to profit from gold trading. If you don’t know the exact trading rhythm, you can follow my trading ideas. I will publish my trading ideas every day, and I will also publish free trading signals on time. Many friends have reported that it is very helpful. If you want to learn the market trading logic, or you want clear trading signals and get more profits, I can satisfy you. Follow the bottom of the article to enter for details!

Gold rebounds below the trend line, continue to choose shortThe easing of the geopolitical situation once weakened the demand for safe havens. In addition, from a technical perspective, gold fell sharply in the early stage and broke the rising trend line. At present, gold has rebounded below the trend line and is under pressure in the short term. It can be shorted based on the suppression of the trend line. Shorting gold near 2915 and 2921, target 2890-2900
Trading must have methods and rules, and it is never done casually based on feelings. In addition to trends, the market also has time points, and the position and time must match. Therefore, risk control is the first consideration. Only with appropriate position management can you dare to do it and take it, not afraid of stop loss, and gradually stabilize profits according to the trading system.
Continue to share real-time trading signals and lead brothers to achieve higher returns. Busy investors can pay attention here. I will continue to release some effective trading plans. If you want to get stable trading opportunities, you can leave me a message and add my bottom article information.
GOLD TRADING POINT UPDATE >READ THE CHATPIAN Buddy'S dear friend 👋
SMC Trading Signals Update 🗾🗺️ Gold Traders SMC-Trading Point update you on New technical analysis setup for Gold traders SMC trading point ☝️ list time post signals 🚀 Hit sucksfully My target point 2920 ) Now Gold rejected point below 👇 supply zone 2892- 2875 FVG level up trand My target 🎯 point 2961 long Trade 🤝. First take short trend 📈 And buying it)
Key Resistance level 2915 + 2920 + 2956+ 2961
Key Support level 2892 - 2875
Mr SMC Trading point
Pales support boost 🚀 analysis follow)

GOLD TRADING POINT UPDTAE >READ THE CHAPTIAN Buddy'S dear friend 👋
SMC Trading Signals Update 🗾🗺️ Gold Traders SMC-Trading Point update you on New technical analysis setup for Gold 🪙 🪙 Gold Traders Gold Ready for again take New bos). Choch) FVG level up trand) Gold still going to bullish trend 🚀 I'm want buying it target point 2945 + 2956 Technical patterns.
Key Resistance level 2945 + 2956
Key Support level 2911- 2900
Mr SMC Trading point
Pales support boost 🚀 analysis follow)

Great situation, continue to short goldDear traders, our gains today are quite good. As I wrote in the last article, gold will fall back after rising high, so the brothers who followed my trading strategy have made considerable gains. As far as the current trend of gold is concerned, after gold fell back to 2900, it showed a short-term rebound trend. Then the short-term upper resistance of gold will be suppressed near the 2915-2925 area. When the price touches this area, we can continue to short gold. In the short term, we will focus on the 2895-2885 first-line support below.
Brothers, profit is the ultimate goal of trading, and accumulating profits is what changes your life and destiny. Wise choices are far more important than hard work. If you want to copy trading signals, make stable profits, or want to learn the correct trading logic and skills in depth, you can consider joining the channel at the bottom of this article.

3.4 Short-term operation of gold within the dayIn February, gold closed with a long upper shadow line, the MACD indicator golden cross high volume, and the dynamic indicator SRO hooked up into the overbought area, indicating that the monthly line is still bullish. At the current monthly level, we focus on the support of the MA5 moving average and the strong support of the MA10 moving average, which correspond to 2763 and 2647 respectively.
The weekly line fell last week, including the previous day's positive column to form a negative cover, so the gold price will continue to weaken this week. The 2936-42 above the weekly line is a short-term top suppression, and the low point of last week is 2832. If it falls this week, it will definitely break the low point of last week. The current support below is the MA10 moving average near 2802, and the middle track support is 2732.
The daily line is more interesting: after the bottoming out and rebounding last Friday, the big positive pulled up yesterday; if the price continues to rebound and repair, then today's low will not exceed yesterday's low of 2857-58, and the current moving average MA60 supports near 2861. The upper pressure is at the middle track 2902-2910. The daily indicator macd is dead cross at high level and runs with large volume, and the smart indicator sto is repaired upward, which represents the daily level of shock.
The current macd is running at a low golden cross with large volume in 4 hours, and the smart indicator sto is entering the overbought area upward, which means that the current 4-hour shock is strong. At present, the upper pressure of the 4-hour is also at the intersection of the moving average MA60 and the upper track at 2913-14.
The current macd at high golden cross of the hourly line shrinks and sticks, and the smart indicator sto is repaired downward, which means that the hourly line is currently oscillating and tends to fall back. The current support is 2879, followed by 2870-58.
In summary:
During the day, we will mainly focus on yesterday's low point of 2857-58. If it is not broken, we can go long near 2867-68. In the short term, we can go long in the 2883-80 range in the Asian session, and the target is 2900-2910. The first short position is also in the 2909-20 range.
Strategy:
Go long in the 2880-83 range in the Asian session, defend 2875, and target 2890-2900-2910
Go long near 2866-68 during the day, defend 2858, and the target remains unchanged
Go short near 2909-12 during the day, defend 2918, and target 2900-2892

Continue to short goldI have been emphasizing in the article that gold still has no momentum to break upward, so the rebound of gold is an opportunity to short. Today, gold has obviously touched the resistance area of 2896-3000 again. As long as this area is not broken, gold will definitely fall back when it encounters resistance, so you can be confident and bold to short gold in this resistance area.
The short trend has not changed, and the rebound is an opportunity to increase positions! The downward space of gold is far beyond expectations. When most people are afraid, it is the time for short sellers to be greedy. Miss the first wave of decline? The second wave of short dividends will be doubled! Brothers, are you bearish on gold like me? If you want to know more detailed trading ideas and get more trading signals, you can choose to join the information at the bottom of the article to make trading no longer difficult and make making money a pleasure!

Stick to shorting gold!!!Dear traders, gold continues to rebound to around 2893. This rebound is really unexpected.
Fortunately, the intraday fluctuations are narrow. It was originally expected that gold would fall back after rebounding to around 2890. Unexpectedly, gold broke through the 2890 mark after a brief pause. However, the 2900-2910 area above can still pose short-term structural resistance to gold. Although I locked in a wave of profits in time, I suffered a slight loss in the process of shorting gold in batches. However, I am not worried about the short position. If gold cannot continue to break through the 2900-2910 area in one fell swoop, gold will also retest the 2865-2855 support area.
I will publish specific trading ideas and trading signals in my channel. If you want to receive detailed trading signals, you can move your finger and join my channel to make making money a pleasure. If you want to make money happily, you can join my channel!

3.4 Short-term technical analysis of goldLatest technical analysis of gold
Despite the rebound in gold prices in the Asian session on Monday, the technical side of gold prices deserves caution before making new bullish bets.
From a technical perspective, gold prices fell below the 23.6% Fibonacci retracement level of the rebound from December to February last year last week, which is seen as a key trigger by sellers. In addition, oscillators on the daily chart have just begun to gain negative traction and support the prospect of gold prices continuing the corrective pullback from the historical peak.
Therefore, any subsequent gains may still be seen as selling opportunities and are limited near $2,885/oz. The $2,900/oz mark is closely followed, and if it is broken, gold prices may climb to $2,934/oz before moving towards the record high near $2,956/oz.
On the other hand, Friday's swing low (around the $2,833-2,832/oz area) now seems to protect the recent downside. If it falls below the above area, gold prices may fall to the 38.2% Fibonacci level (around $2,815-2,810/oz). If gold encounters some follow-up selling and falls below the $2,800/oz mark, it may indicate that gold prices have peaked and may pave the way for further declines.

Still firmly short goldBrothers, gold has failed to effectively break through 2890 many times during the rebound process, so gold is still in a weak position. If there is no special news affecting the market, gold will continue to fall after consuming a certain amount of bullish energy, and may even fall to the 2860-2870 area. So in terms of trading, we can temporarily maintain a short-selling attitude towards gold.
Brothers, are you shorting gold like me? If you want to know more detailed trading ideas and get more trading signals, you can choose to join the information at the bottom of the article to make trading no longer difficult and make making money a pleasure!

Go ahead and try to short gold!Brothers, gold continues to rise in the short term and has now touched the Asian high of 2877 again. However, whether the gold market, which has been stimulated by the news, can continue to rise remains to be seen!
And from the chart, although gold has risen strongly, it still faces resistance in the 2880-2885 area in the short term. This is the last line of defense in the bear market, so it is not easy for gold to continue to break through. If gold cannot successfully break through this resistance area, then after consuming the bullish momentum to a certain extent, gold may fall back again and retest the 2870-2865 area.
So in terms of short-term trading, I will not give up shorting gold, and I will still try to increase my position and continue to short gold based on the 2880-2885 resistance area!
Friends who have entered my bottom article have all obtained wrong profits as long as they follow my trading signals. If you want to receive detailed trading signals, you can move your fingers and join my bottom article to make making money a matter of course! I am eager to help you, but if you are unwilling to even extend your hand, how can I help you!
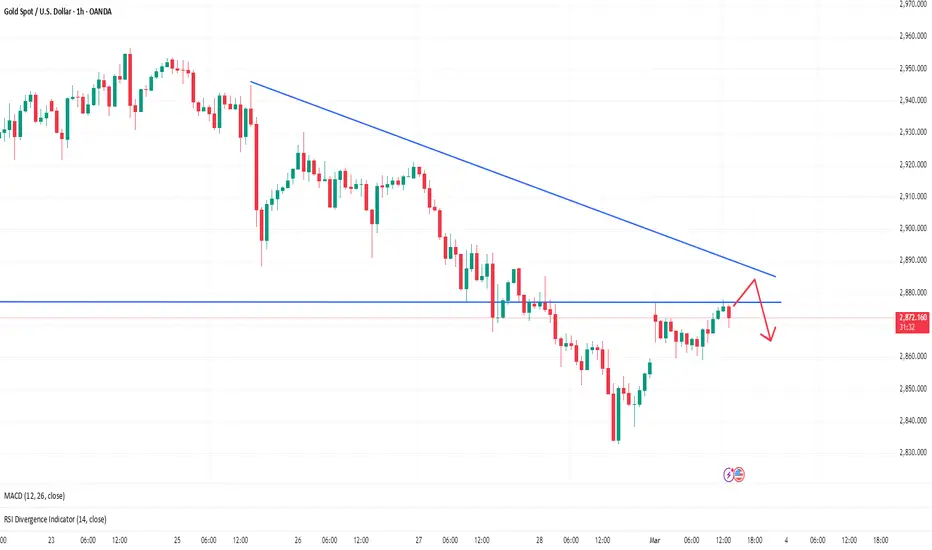
Continue to short around 2875-2880Gold, the bears retreated again last Friday, and fell from the highest near 85 to around 32, with a decline of around 53. The daily line continued to close in the form of a negative line, and it rebounded and corrected in the early morning and closed near 55. After opening in the morning, it quickly rose to a high of 76 and then temporarily retreated. It is currently consolidating near 63. Combining last week's trend, last week's highest was around 2956 and the lowest was around 2832, with a decline of around 123 US dollars. The weekly line also closed in the form of a large negative line and broke through the 5-day moving average. The key support below will likely be maintained at the 10-day moving average, which is also the position below The integer level of 2800, and the bulls quickly pulled back in the morning. In the continuous decline, this action is not conducive to the bulls. On the contrary, the rapid rise in the morning is generally poor in continuity. We will continue to short and wait, and the support below is also the starting point of the morning, 55. If the gold rebounds around 2875-2880, we will continue to short.
Friends who have entered my bottom article have all obtained wrong profits as long as they follow my trading signals. If you want to receive detailed trading signals, you can move your fingers and join my bottom article to make making money a matter of course! I am full of enthusiasm to help you, but if you are unwilling to even extend your hand, how can I help you!

3.3 Gold is under high pressure, beware of a pullbackThe gold four-hour line is also suppressed by the moving average, and the rebound is short-lived, and it is directly pressed on the floor. At the same time, the upper resistance of 2880 and 2890 is an obvious resistance. The K line is just a rebound and is definitely not a reversal. It is obviously still empty below the two resistances, and the K line is suppressed directly to the point of being unable to breathe, and is pressed on the floor. The K line goes down from 2955 to 2830. This big short is obviously still strong.
Short-term suggestion 2880 SELL

Follow me to short gold and earn your first pot of gold this weeThis week, Trump's latest tariff speech overshadowed the impact of signs of economic slowdown, boosted the US dollar, and caused gold prices to continue to fall. If tariff measures trigger a full-scale trade war, the global economy may fall into recession, and gold as a safe-haven asset will also be supported in the long term. Today, Monday, gold rebounded to a high of around 2877 at the opening, and then fell to 2865 and fluctuated. Over the weekend, we gave an analysis strategy for today's opening. Over the weekend, we analyzed that the upper short-term suppression was around 2880. If you followed my trading strategy, you would short gold around 2875-2877. I believe you have now made more than 100pips in profit. Congratulations on successfully getting your first pot of gold in this week's transaction!
Regarding the next trading rhythm, short-term suppression at the top will focus on the area around 2880. If gold does not break through 2880, then we will still focus on shorting gold.
Finally, whether you are a novice entry-level trader, or you want to maintain a stable trading win rate to obtain more generous returns, or you want to create a valuable and free life through trading, or you are now deeply troubled by losses, you can find what you need at the bottom of the article, and I wish all of us all the best in trading!

3.3 Short-term technical analysis of goldThe gold market completed its February structure last week. Looking back at the market in February, the market fell back after opening at 2880.9 at the beginning of the month. The monthly line reached a low of 2770.47 and then the market fluctuated and rose strongly. The monthly line reached a high of 2956.3 and then the market fell back due to profit-taking in the late trading. The monthly line finally closed at 2859 and closed in an inverted hammer pattern with an upper shadow longer than the lower shadow. After the end of this pattern, the market will have certain pressure to continue to adjust in early March. However, the large cyclical bullish pattern is complete and the trend is still bullish.

GOLD TRADING POINT UPDATE > READ THE CHAPTIAN Buddy'S dear friend 👋
SMC Trading Signals Update 🗾🗺️ Gold Traders SMC-Trading Point update you on New technical analysis setup. Gold Traders Gold Ready for Down 👇 ⬇️ List day take a breakout up trand line. 4H Time Frame. Today 💪 test supply rejected point below 👇 trend 📉 FVG) level. 2892 close below 👇 2864 - 28833
Key Resistance level 2920
Key Support level 2892 - 2864 - 2833
Mr SMC Trading point
Pales support boost 🚀 analysis follow)

GOLD - Long activated earlier !!Hello traders!
‼️ This is my perspective on GOLD.
Technical analysis: Here we are in a bullish market structure from 4H timeframe perspective, so I expect to see bullish price action after price filled the imbalance and rejected from bullish order block around level 2900.
Like, comment and subscribe to be in touch with my content!

GOLD TRADING POINT UPDATE > READ THE CHAPTIAN Buddy'S dear friend 👋
SMC Trading Signals Update 🗾🗺️ Gold traders SMC trading point update you on New technical analysis setup for Gold 🪙 Gold still holding rejected Resistance level 2956 2943 Gold Traders SMC-Trading Point ☝️ want to Short trend 📉. Close below 👇 ⬇️ up trand that weekend expect it Short Trade 2834
Key Resistance level 2943 + 2955
Key Support level 2876 - 2864 - 2833
Mr SMC Trading point
Plaes support boost 🚀 analysis follow)

GOLD - ( Long Term ) 📉 Gold Price Analysis: Bearish Trend in Play! 📉
After analyzing the current market trends, I anticipate a drop in gold prices, potentially reaching 2785 or 2697, depending on the zone where the price will make its return. I'll keep you updated and notify when the bearish momentum begins. The downtrend is expected to last from today until May 25th, 2025.
Stay tuned for updates and don't miss any key changes!

GOLD - Long after filling the imbalance !!Hello traders!
‼️ This is my perspective on GOLD.
Technical analysis: Here we are in a bullish market structure from 4H timeframe perspective, so I look for a long. After price took buy side liquidity I expect to see continuation of retracement price to fill the imbalance lower and then to reject from bullish OB.
Like, comment and subscribe to be in touch with my content!
