Wednesday: Gold focuses on the 2020~2040 rangeGold is still dominated by short sellers, with the daily chart closing in the positive zone, the MA10/7 daily moving average suppressing the MA2038/47 opening downward, and the central axis of the RSI indicator adjusted. The short-period hourly chart and the four-hour moving average are glued together, and the price is running in the middle and lower rails of the Bollinger Bands. Technically, gold continues to adjust and fluctuate and runs bearish. However, market data gradually emerges in the second half of the week and needs to be focused on. We will continue to pay attention to the 2040/2020 range adjustment during today's trading day. Trading ideas still look at shocks and short-term participation!
To be honest, the shock yesterday was really severe. If you are not calm, you may run away early and miss the drop of more than ten dollars. Only persistence is victory. No matter how the gold price fluctuated, it failed to rise above the suppression of the 4-hour 20 moving average. Today, we continue to short gold relying on moving average suppression.
Trading straregy:
Short-term gold 2017-2019 long
Short-term gold 2038-2040 short
Goldpreis
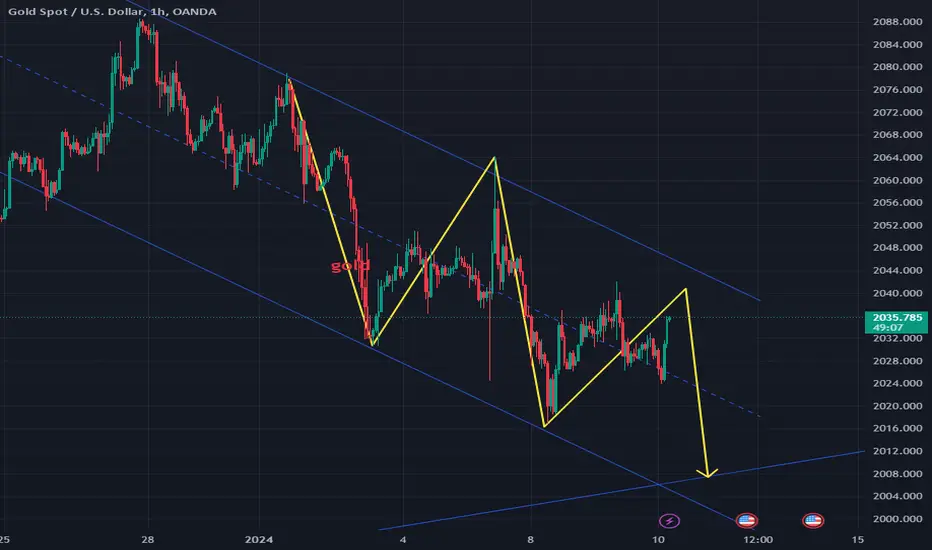
XAUUSD: 10/1 Today’s Market Analysis and StrategyGold technical chart daily pressure 2040-2053, lower support 2000
The four-hour pressure is 2040, and the lower support is 2016
One-hour pressure is 2040, support below is 2016
✅Operational suggestions: Gold has now physically broken through the 2040 mark. Today’s rebound near 2040 will be the main target for shorting, first look at the 2020 mark. If the strength is strong, continue to look at the 2000-1966 mark. The first small resistance above is currently the 2031 mark, followed by the 2040 mark. It is the entry price of short order
SELL:near 2053
SELL:near 2040
SELL:near 2032
You don’t necessarily trade according to the points I mentioned, technical analysis only provides trading direction!

GOLD:Trading analysis before the US market
Today will usher in the most important data of the week, the US inflation indicator CPI in December, which is the consumer price index. Judging from market expectations, the 3.2 data is slightly higher than the previous value of 3.1, which means that the market generally believes that US inflation has already After a continuous downward trend, it has begun to rebound. If this trend is confirmed, it will have a major impact on the Federal Reserve's interest rate cut.
New York Fed President Williams made his latest speech: He believes that interest rates are restrictive enough to achieve the 2% price target. When it is confident that inflation will reach 2%, the Fed can cut interest rates, with the pace of reduction depending on economic conditions. It is not close to the time to slow down the balance sheet reduction, and we need to plan to finally gradually slow down the balance sheet reduction in 2024.
You must know that the Fed's monetary policy adjustments usually cut interest rates after ending the balance sheet reduction, but Williams said that it will only slow down the balance sheet reduction in 2024, which is also a very hawkish signal.
The key today is the CPI data. Before the data, I think it will continue to fluctuate in a range.
Yesterday, gold did not break through 2042 and reached a maximum of 2040. This indicates that there is strong resistance from 2040 to 2042.
Xauusd:sell2039-2041
TP:2034-2030
SL:2043
Xauusd:buy2022-2025
TP:2032-2038
You can try the above signals before the US market to ensure the safety of your funds
Join me as I continue to analyze my thoughts

GOLD-My analysis can help you
Gold may continue to fluctuate in a range today. At the top, focus on the important resistance points of 2042, 2050, and 2062, and on the bottom, focus on the important support points of 2024 and 2015.
Since the market’s focus is around Thursday’s U.S. CPI data, the changes on Wednesday should not be big. However, today I want to emphasize that the daily line tends to be strong, and it may rise slowly amid fluctuations today.
Xauusd:buy2024-2029
TP:2035-2038
You can also wait until after 2042 to start selling and wait for my signal. I will analyze and share in real time. Join me.

XAUUSD:8/1 gold market analysisGold technical chart daily pressure is 2053, with support below 2040-2000
Four-hour pressure 2053-2063, support below 2000
One-hour pressure 2044-2053, support below 2024
Operational suggestions: Gold NFP first fell and then rose on Friday. After breaking through the 2030 line, it began a substantial counterattack, and after touching the early decline point near 2063, it began to fall back. There was a large-scale sweep of long and short markets. Today, we will continue to pay attention to the 2040 dividing line at the hourly level. The price will continue to go long above the long-short dividing line and go short below!https://www.tradingview.com/x/a2OrCW1c/
You don’t necessarily trade according to the points I mentioned, technical analysis only provides trading direction!

Tuesday: Gold trend analysis, focusing on 2020~2040Gold fluctuates widely and there is no unilateral long and short wash. Today's trading also needs to enlarge the amplitude range. The trading idea still remains high and low. The daily chart closes negative and suppresses 45/52 below the MA10/7 daily moving average. The short-cycle hour chart and four-hour chart The reference is of little significance. There are very few technical market components. For short-term charts, you can only look at the Bollinger Bands channel. The middle rail is suppressed by the 2042 line, the lower rail is by the 2020 line, and the upper rail by the 2052 line coincides with the MA10 daily moving average.
The unilateral downward trend of gold means that it is short when it rises. Although the price of gold rebounded by 15 US dollars in the evening, it still cannot change the unilateral downward trend. Today, it continues to be short under the pressure of 2040. As can be seen from the hourly chart, the price of gold continues to decline, and rebounded strongly yesterday, but it is still subject to the 2040 pressure level, so it continues to be short today.
It used to run above 2040, but now it has been running below the 2040 pressure level. Before there is an effective breakthrough of 2040, the short position will be carried out to the end. The market is changing, and you can definitely use the same methods to win the changing market.
Pay attention to the 2019-2022 support below
Focus on 2040 resistance above

WOULD YOU BUY OR SELL FROM ($2027-$2032)?The technical analysis suggests a bearish trend with $2026 - $2030 yet shows as a strong Resistance .However ,the current price action continuously trying to shatter the $2017.72
2020.16 pivots points for completion of first bearish cycle moreover,$2025.21
-$2027.82 are the R1 &rR2 points which are meant to be tested if gold makes a reverse tail to shows some fake trend changing candles. Furthermore, the $2005-$2008 are expected to achieved with in the next session. Consequently DX shows some other moves as the recent NFP pullback was unexpected but i was an instant reverse for refiling Non commercials .
This outlook is contingent on the U.S. Dollar (DX) experiencing a relief rally.(Commentary)

Friday: Gold is in a downward channelOn Thursday, U.S. ADP data came in much stronger than expected. The good data has brought new confidence to the U.S. economy and also caused a huge impact on the precious metals market. This month's NFP will be announced in the day, which will also be the highlight of today. Before the data is released, it is expected that gold will not fluctuate too much during the day, and more sideways shocks await the release of evening data. From a technical point of view, the daily line closed a small positive bar yesterday, the Bollinger Bands opened, and the KDJ indicator crosses and increases volume. At present, the general trend is upward, and the midline is rising in stages. From the 4-hour chart, the Bollinger Bands are opening, and the KDJ indicator is golden cross with heavy volume. In the hourly chart, the Bollinger Bands have begun to open, and the KDJ indicator has increased its golden cross. Yesterday, the price still mainly rebounded and corrected, with the lowest reaching the 2036 line, the third support level we gave. Today, we will focus on the upward shock. The upper pressure will focus on the 2050-2060 line, and the lower level will focus on the 2040-2030 support.
Personal suggestion: go long on callbacks; dividing line: 2040
Strategy reference: It is recommended to go long in 2030/2035

Thursday: Gold remains under pressure to fallGold has fallen below the 2050 long-short watershed and started a downward trend. Relying on the rebound pressure of yesterday's US market, gold will continue to be short and bearish at the 2048 position. The target below will focus on the support of 2030!
Looking at the golden hour chart, the downward trend has begun, and the second period of decline is very strong, and the decline will continue! However, after the sharp drop, the market is also expected to fluctuate and adjust, so today's Asian and European market will most likely fluctuate within the range of 2048-30, and then start a new band of decline after the shock ends!
The rebound relied on pressure to short gold. After breaking the level, 2050 became the key resistance for this rebound. As long as the rebound encounters resistance today, this pressure position will continue to be short!
suggestion:
2030-2033 long
2048-2050 short

2030 support is difficult to hold, DXY continues to riseAs I analyzed in the morning, 2050 is resistance. After gold encountered resistance, it began to fall. Coupled with the suppression of ADP and unemployment benefits data, it is now down 10 US dollars from the high.
A red rope candle in 4H swallowed up all the previous gains. In this case, the decline may continue.
All I think is that the 2030 support may be broken today

XAUUSD non-agricultural market forecast
Today I think gold prices will recover, and on the H4 time frame, it is still showing a downward trend, with two important key levels: 2058-2060 and 2077-2079. I think gold is likely to rise during the Asian and European hours. Thereafter, non-farm payrolls news during the U.S. session may cause gold prices to fall.
So, my strategy for today is:
Waiting to buy area: 2038-2041
Area for sale 2058-2065 or 2077-2079

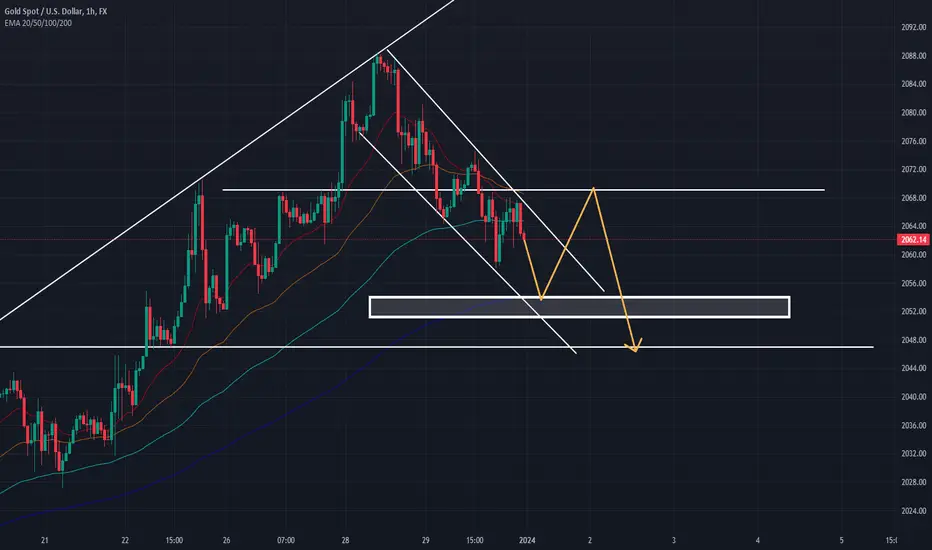
XAUUSD:3/1 Today’s Strategy and AnalysisGold technical chart daily pressure is 2088, support below is 2053-2040
Four-hour pressure 2069-2088, support below 2053-5040
One-hour pressure 2069-2073, support below 2053-2066
Operation suggestion: Today, focus on 2053/2040 below. Try to go long at this position. If the 2040 mark is broken, the short trend will start. Just continue to go long above the 2066 mark above.
BUY:2066 near
BUY:2040 near
SELL:2065 near

XAUUSD: Today’s analysis on 29/12, 2061.5 is the dividing lineThe day before Christmas, the last rising point last Friday started at 2061.5. Today, it can only continue to fall if it falls below 2061.5, so it was as low as 2061.9 just now. This position will definitely rebound, so the market is now at the dividing line. It can go up or down
Gold technical chart daily pressure is 2100, with support below 2066-2040
The four-hour pressure is 2100, and the lower support is 2069-2066
One-hour pressure 2073-2080, support below 2066
✅Operational suggestions: The 2040 mark is not broken, the 4H chart is still in a bullish trend, and the upper part is suppressed by the resistance of 2073 and 208
SELL:near 2080
SELL:near 2073
BUY:near 2054
BUY:near 2040
You don’t necessarily trade according to the points I mentioned, technical analysis only provides trading direction!

XAUUSD Wednesday trading analysis
#xauusdQuick analysis of gold price trends
Gold prices failed to break through the 2054-2055 area yesterday. Still no major news today, so I think gold prices today will trade sideways in the 2052-2072 price range.
Range waiting to be sold: 2069-2072.
Price range awaiting purchase: 2052-2044-2046
I hope my analysis will continue to help everyone bring profits. If you like my analysis, please like my post and follow me. I will update my analysis in real time.

Gold analysis next week
#xauusdQuick analysis of gold prices next week.
Next week, I think gold prices will tend to correct to the downside. The closest possible target is: 2054-2056. This area is the confluence of the EMA200 and the support on the first half time frame. So maybe we'll wait to buy in this area. Purchase time: 2054-2056. Take profit: 206x. I will update new specific analysis every day, I hope you all like it
Gold focuses on 2062/2050 supportGold fell back after rising yesterday, and fell below the 2070 long-short watershed, and the market turned downward! I started shorting today and sold directly above 2070 in early trading, with a profit of 80pips! The bottom supports the 2050 line! In trend trading, the most important thing is to follow the trend. When the market turns around, you must adjust your thinking immediately! So I always follow trends from beginning to end! Currently, gold has fallen below the moving average support, and the upward trend line has also been broken, which means that the gold trend has changed! The next step is to fall!
Gold has been fluctuating all the way up, but the market changed yesterday! There is no rebound after breaking the position, which means that the adjustment will continue! The support below this time is the support position of the 4-hour Bollinger Middle Rail 2050! It is expected that there will be a rebound after this decline to this position!
However, we do not rule out that the decline will stop near the previous low of 2060~2062, but I think the probability of falling to around 2050 is higher.
