XAU/USD) bearish reversal analysis Read The captionTechnical analysis of (XAU/USD) based on price action and technical indicators on the 15-minute timeframe. Here's a
---
Key Technical Insights:
1. Resistance Level (Highlighted Yellow Zone):
Price is approaching a strong resistance zone (previous rejection marked by red arrows).
This area has historically pushed price downward.
2. Trendline Support (Rising Black Line):
Price has been following a short-term ascending trendline, forming higher lows.
A break below this trendline signals potential bearish reversal.
3. EMA 200 (Blue Line):
Price is currently above the EMA 200, indicating short-term bullish momentum.
However, price is testing resistance — a rejection could flip momentum bearish.
4. Bearish Rejection & Projection:
The chart shows an anticipated rejection from resistance, followed by a break of trendline support.
Target zone is marked near 3,228.098, indicating a drop of ~94 points from the current level.
5. RSI (Relative Strength Index):
RSI is nearing overbought territory (68.79).
A bearish divergence or RSI crossing down may confirm weakening momentum.
Mr SMC Trading point
---
Conclusion / Trading Idea:
Bias: Bearish
Entry Zone: Near the resistance level (~3,322)
Confirmation: Break of trendline support
Target: 3,228
Stop-Loss: Above resistance zone (just over the upper trendline)
---
pelas support boost 🚀 this analysis)
Goldpreis

XAUUSD/GOLD Geopolitical conflicts have escalated again. Next week is a week of heavy news. How will the gold price focus next week? How to trade? Look at the news preview first.
1. Geopolitics, Russia-Ukraine conflict, Palestine-Israel conflict, Iran-Israel conflict.
2. ADP data, NFP data.
3. Tariff deadline.
The above three news are enough to cause drastic fluctuations in the gold price.
On Friday, the New York market followed my expectations. After rebounding around 3282, it fell back. Finally closed around 3274.
The impact of the weekend news is huge. From the news perspective, the opening price of next Monday will be higher than the closing price on Friday. In terms of operation, you can pay attention to buying at a low price after the market opens.

Seize the opportunity to short gold!Last week, we mentioned that if gold continues to fall, it will go to around 3245-3250. This position is 618 of the retracement from 3120 to 3450, and it is also the previous rising point. After the opening, it tested this position as expected and rebounded. If it continues to break down, it will gradually go to around 3225 and 3204. Last Friday, it opened weak and eventually fell to 3255. Although it rebounded at the end of the session, it was not enough to change the weak pattern. Today, we will focus on the rebound strength. The pressure is at 3291 and 3301. Short according to the rebound strength, and look at the 3245 support below. If it does not break, consider going long.
Gold operation suggestion: short around 3291-3001, target 3370-3360.

Analysis and layout of gold trend at the end of the month📰 News information:
1. Gold market liquidity at the end of the month
2. Impact of geopolitical situation
📈 Technical Analysis:
From the beginning of the decline of gold near 3338 on Friday to today's lowest point near 3244, gold has fallen by nearly $94. At present, gold has rebounded as expected. In the short term, I think we have two key areas to pay attention to. The first is the position of 3290-3295, which is a 50% rebound, and the second is the upper top range limit range of 3300-3320. Of course, if it breaks through 3280 and then retreats, it can also be long twice, but the current price rebounds, considering the position of the temporary low long position, there is not much trading opportunity. First look at the key areas given to find opportunities for shorting, and pay attention to the opportunity of retreating to 3280-3270 below.
🎯 Trading Points:
SELL 3290-3295
TP 3380-3370
SELL 3300-3310-3320
TP 3290-3280-3270
BUY 3270-3260
TP 3290-3300
In addition to investment, life also includes poetry, distant places, and Allen. Facing the market is actually facing yourself, correcting your shortcomings, confronting your mistakes, and strictly disciplining yourself. I hope my analysis can help you🌐.
OANDA:XAUUSD FOREXCOM:XAUUSD FX:XAUUSD PEPPERSTONE:XAUUSD FXOPEN:XAUUSD TVC:GOLD

XAU/USD) bearish Trand analysis Read The captionSMC trading point update
Technical analysis of (XAU/USD) on a short-term timeframe, incorporating several key tools and concepts:
---
Overview of the Analysis
Price Level (Current): Around $3,273.40
EMA 200 (Blue Line): Around $3,337.95 (signaling broader trend)
Resistance Zone (Yellow Box): Between approximately $3,300–$3,320
Support/Target Zone: Around $3,231.11
RSI (Relative Strength Index): At 32.88, which is near oversold territory (below 30)
---
Interpretation of Chart Structure
1. Descending Channel:
Price is moving within a downward-sloping channel.
Suggests a bearish trend is in play.
2. Resistance Level (Yellow Box):
Price is expected to retest this area and face resistance.
Confluence of a supply zone and upper trendline, reinforcing its strength.
3. Projected Price Action:
Price may climb back up into the resistance zone.
A rejection is anticipated, leading to another leg down.
The target is around $3,231.11, which matches previous measured moves.
4. Measured Moves (Blue Arrows):
Highlights historical price drops of ~79 points.
Repeating this pattern suggests symmetry and continuation.
5. RSI Indicator:
Currently at 32.88: nearing oversold, but not quite.
No clear bullish divergence, so price could drop further.
---
Trade Idea Summary
Bias: Bearish
Entry Zone: Near $3,300–$3,320 (resistance)
Target: Around $3,231.11
Invalidation: If price breaks and holds above $3,337–$3,340 (EMA 200 and channel breakout)
Mr SMC Trading point
---
Caution/Considerations
Watch for false breakouts above the resistance zone.
Monitor RSI for potential bullish divergence that could invalidate the downside.
Be cautious around the U.S. economic news event icon, which might cause volatility.
plesse support boost 🚀 this analysis)

Gold (XAU/USD) Bearish Trade Setup – June 27, 2025Entry Point: Around 3,300.98 USD
Stop Loss (SL): ~3,312.20 USD
Take Profit (TP): 3,229.33 USD
Current Price: 3,286.15 USD
Risk-Reward Ratio: ~1:6.3
(Potential reward ≈ 71.65 pts; risk ≈ 11.22 pts)
Technical Breakdown:
Trend:
The price is in a short-term downtrend, supported by:
Lower highs and lower lows.
Price trading below both 50 EMA (red) and 200 EMA (blue), confirming bearish momentum.
Bearish Breakout:
Price broke below a key support-turned-resistance zone near 3,300–3,302, triggering sell pressure.
Resistance Area:
Strong rejection at 3,302–3,312 zone, which is now acting as resistance.
SL is placed just above this zone to protect against false breakouts.
Target Zone:
TP set at 3,229.33, aligning with a previous support zone — a logical area for price to react.
Strategy Notes:
Bias: Bearish
Entry confirmation: Already triggered.
Risk Management: SL placement is tight and strategic; RR ratio is highly favorable.
Next support below TP: If 3,229 breaks, further downside could follow.
Summary:
This setup shows a well-defined bearish continuation with a clean break of support, a controlled SL above resistance, and a strong RR ratio. A suitable trade for trend-following strategies, but price must not retrace above 3,312 for this idea to remain valid.

It’s the right time to make a golden layout!Gold opened at 3328 today and started the downward mode. After the European session, it continued to fall and broke the new low. The negative opening data of the US session also continued the downward mode. So far, it has reached the lowest point of 3255 and rebounded, but the strength is not very strong. After all, the upper pressure is still very strong. In the short term, we pay attention to the previous low point of 3295-3300, and focus on the upper 3305-3311. Today, the short-term operation of gold is mainly short-selling on rebounds, and long-selling on callbacks is supplemented.
From the 4-hour analysis, the upper short-term resistance is around 3295-3300, with focus on the important suppression at 3305-3311. The rebound will continue to be mainly short and look to fall back. The lower short-term support is around 3255-3245. Relying on this range as a whole, the main tone of high-altitude and low-multiple participation remains unchanged.
Gold operation strategy:
1. Short-selling in batches near the rebound of gold near 3295-3310, with a target of 3380-3370.
2. When gold falls back to around 3345-3455, go long in batches, with the target at 3370-3380.

XAUUSD/GOLD/SellThe pressure from the bears is too great. In the end, the pressure from above was not broken. Instead, it broke out and fell after being under pressure. The stop loss was hit.
The current price is 3285. After gradually boosting the US dollar index. The trend of gold prices has continued to fall. More importantly, the tariff issue has been eased. At the same time, geopolitical factors are also orderly and stable. This is the news that caused the bears to attack.
History has not become the savior because of repeating itself. Of course, this is also an emergency. In some transactions, the extremely low probability of causing losses is a common problem in transactions. However, our analysis team has stabilized a high trading win rate.
Then the next trading plan is still to focus on the pressure from above. If the London market rebounds above 3300. It is still mainly selling. 3314 is an important level for short-term rebound, and we need to pay attention. Although there is no obvious sign of rebound yet, the release of short-selling pressure has been alleviated because the decline is slow. Today's main trading idea is still to sell at high levels.
The target is to focus on the position of 3264-3248. Remember the risk of buying at low levels. Do not trade independently.
Where will gold go?In 4 hours, it has fallen below the previous low of 3295, and will continue to fall. There are two supports below, namely 3280 and 3265. Don't expect a big rebound before going short in a negative market. If the rebound is large, it will not fall. This kind of negative decline is generally judged by the 15- and 30-minute patterns. When resistance appears in the big cycle, the market has actually fallen a lot.
Today, I think the pressure is mainly in the 3300 and 3310 areas. 3310 can be considered as the pressure of the top and bottom conversion. Pay attention to 3280 and 3265 below. If you consider going long, these two positions are the main positions. For the time being, the general direction is mainly short.

There are opportunities for both bulls and bears in gold!Gold fell back and closed lower yesterday. The daily line closed with a negative cross overnight. The overall market has not changed much. The short-term repeated tug-of-war is temporarily consolidating. Today is the closing of the weekly line, and we will continue to maintain the volatile thinking. In the 4H cycle, the Bollinger Bands closed, temporarily exerting pressure on the middle track. After rebounding to 3350 yesterday, it failed to continue and remained in a weak shock pattern. Therefore, today's operation is mainly short and supplemented by long. The upper pressure is at 3328 and 3336. Short according to the rebound strength, pay attention to the rise and fall of 3310 below. A breakthrough may see the previous low of 3295. If the support is not broken, you can consider going long.🔔For more specific operation details and strategy updates, please pay attention to the notification 🌐 at the bottom.
Gold operation suggestion: short gold around 3328-3338, target 3315-3310.

Gold shorting opportunity not to be missedGold hit the key resistance of 3350 and then fell under pressure, reaching a low of 3309, and was temporarily supported by the low point on Wednesday. The intraday showed a pattern of rapid decline after a volatile rise, highlighting the long-short tug-of-war pattern. The hourly line fell again after a pullback to 3328, indicating that there is still room for short-term retracement. The current operation needs to focus on key points: short orders can be entered again near the pullback of 3328-3335. If the market continues to decline, focus on the support range of 3300-3290, and long orders can be arranged if it stabilizes. The overall idea of oscillation is maintained. Before effectively breaking through 3350 or losing 3290, high-altitude and low-long are still the main strategy.
Gold recommendation: short near 3328-3335, target 3315-3305

Bulls and bears are anxious? Rebound continues to empty📰 Impact of news:
1. Initial unemployment claims data
📈 Market analysis:
Gold is in a sideways consolidation near 3320 in the short term. The market has no clear direction for the time being, and the long and short positions are in a tug-of-war. The hourly line rebounded to 3328 and then fell back again, suggesting that there is still room for short-term retracement. The current operation needs to focus on key points: if it rebounds to the 3320-3330 resistance area, you can consider entering short positions again. If the market continues to decline, focus on the 3300-3290 support range. If it stabilizes, long orders can be arranged. The overall idea is to maintain a volatile market. Before effectively breaking through 3350 or falling below 3290, high-altitude and low-multiple is still the main strategy.
🏅 Trading strategies:
SELL 3320-3330
TP 3310-3300-3290
BUY 3310-3300
TP 3320-3330-3340
If you agree with this view, or have a better idea, please leave a message in the comment area. I look forward to hearing different voices.
OANDA:XAUUSD FX:XAUUSD FOREXCOM:XAUUSD FXOPEN:XAUUSD TVC:GOLD

It’s the right time to short goldThe daily gold line presents a three-top gathering pattern. The historical trend shows that the 3290-3280 area has triggered technical pullbacks many times, all of which rebounded to around 3350. The current 4-hour chart trend line suppression level coincides with the Fibonacci 0.618 pullback resistance from the previous high of 3450 to 3300 in the 3350-3360 range. This area constitutes the core pressure zone. If the price fails to effectively break through and stand above 3360 when it probes this area again, it is highly likely to replicate the previous two resistance and fall patterns. At that time, short orders will be arranged based on the 3350 first-line resistance area, with the goal of breaking the key support of 3300 and further looking down at the 3280 and 3260 levels. The overall bearish tendency is maintained, and the resistance to rebound is a signal to enter the market and sell short.
Gold recommendation: Gold is short around 3345-3352, target 3330-3320

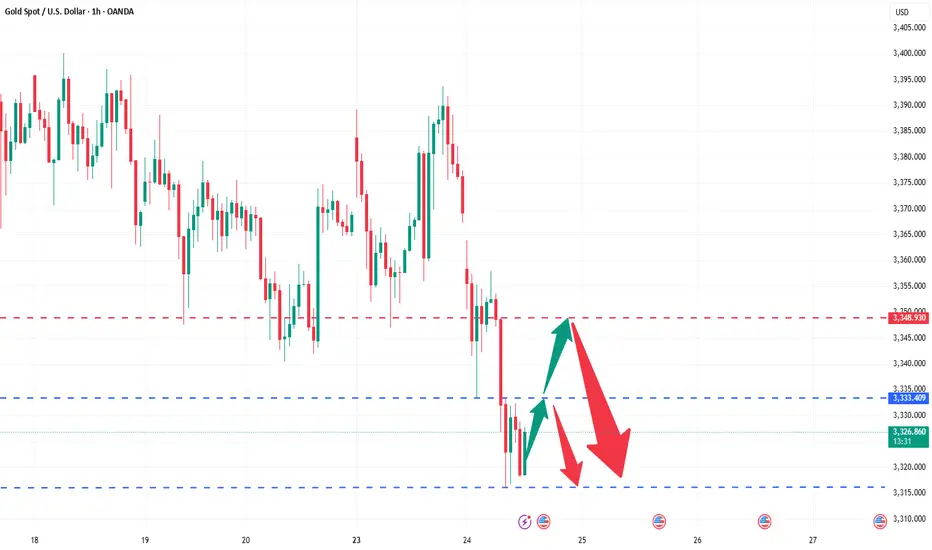
XAU/USD) Bullish trand Read The captionSMC trading point update
Technical analysis of Gold (XAU/USD) on the 1-hour timeframe, highlighting a breakout from consolidation supported by key levels and trend structure. Here’s the detailed analysis:
---
Technical Breakdown
1. Key Support Zone
Price has formed a strong base around 3,315–3,325, with multiple bullish rejections (green arrows).
This zone has acted as a demand level, reinforcing bullish structure.
2. Ascending Trendline Support
An uptrend line supports higher lows, showing momentum building to the upside.
3. EMA 200
Price is now challenging the 200 EMA (3,353.41) — a key dynamic resistance.
A successful breakout and retest above this EMA will likely fuel continued bullish movement.
4. Breakout & Measured Move Projections
The chart indicates a bullish breakout from a consolidation box (yellow zone).
Measured move targets based on the previous rally:
First target: 3,368.86 (1.17%)
Second target: 3,381.55 (1.75%)
5. RSI Confirmation
RSI (14) is around 57, showing bullish momentum but still below overbought—supporting further upside potential.
Mr SMC Trading point
---
Conclusion / Idea Summary
Bias: Bullish
Entry Zone: On pullback into 3,330–3,340 range or breakout retest above EMA 200
Targets:
3,368.86
3,381.55
Invalidation: Sustained close below 3,320 and break of the uptrend line
---
Please support boost 🚀 this analysis)

Gold rebound is blocked and high-altitude strategy continuesGold continued its bullish correction yesterday, reaching 3336 in the European session, and continued to retreat in the US session, reaching a low of around 3312 before temporarily stopping, and started a second pullback correction, and finally closed around 3332. Today, it opened at 3333, rebounded to 3340, and then entered a shock consolidation. Currently, the upper side focuses on the suppression of the 3342-3350 area. If the price cannot effectively break through and stand firm in this area, gold still has room for further retracement. In terms of operation, it will continue to rely on this suppression range to maintain a high-altitude thinking during the day, and follow the trend to see a decline. The recent market trends are basically the same, bottoming out and rebounding. In terms of strategy, keep a sense of rhythm and mainly short at highs.For more specific operation points, please pay attention to the notification at the bottom🌐.

Gold is obviously suppressed, so we must go short!Yesterday, gold continued to fluctuate and fall under pressure at the 3360 mark. The US market further accelerated downward to break through the 3300 integer mark and reached a weak closing near 3295. The daily K-line closed with a suppressed fall and broke the bottom of the middle shadow. The overall gold price continued to fluctuate and fall in a weak rhythm. After reaching the lowest level of 3295, it rebounded and closed at 3323. Today, it opened at 3324. As of now, it has reached the highest level of 3337. At present, we are focusing on the suppression of 3340-3348. If the rebound is under pressure, we can still intervene in short orders. The recent market trends are basically the same - bottoming out and rebounding. In terms of operation, continue to keep shorting under pressure and long positions after bottoming out and rebounding.
From the current market trend, today's upper short-term resistance focuses on the 3338-3342 area. If it rebounds to this range and is under pressure, you can consider choosing an opportunity to arrange short orders. The lower support focuses on the 3315-3305 line. If it falls back and stabilizes, there is a possibility of a short-term rebound. The overall situation is still in a range-bound structure. It is recommended to focus on key points, buy high and sell low, follow the trend, and strictly control risks. For more specific operation points, please pay attention to the 🌐 notification at the bottom.

Opportunities only come to those who ambush in advanceAfter Trump announced that Israel and Iran had reached a comprehensive ceasefire agreement, the market's risk aversion sentiment cooled significantly, and the price of gold once plummeted by more than $30. Although the stability of the ceasefire agreement is in doubt, the rebound in risk appetite dominates the market trend, with stock markets rebounding, oil prices falling, and demand for safe-haven assets falling. Powell will deliver a semi-annual monetary policy testimony, and the market is paying attention to his statement on the timing of the July rate cut. At present, the internal differences of the Federal Reserve on interest rate cuts have intensified. If Powell sends a signal that the number of interest rate cuts this year is limited, it may strengthen the rebound of the US dollar and suppress gold prices; on the contrary, if the stance is dovish, it may ease the downward pressure on gold prices. In the short term, the fading of geopolitical risks and the warming of risk appetite are the main reasons for the decline in gold prices, but the weakening of the US dollar and the potential dovish tendency of the Federal Reserve still provide support. In the medium and long term, global economic uncertainty, geopolitical risks and expectations of the Federal Reserve's loose policy still constitute structural support for gold.
From a technical perspective, the gold daily moving average system is in an intertwined state, and the forces of bulls and bears are relatively balanced. The current short-term resistance above is around 3320-3333, which is an important psychological level. If an effective breakthrough is achieved or the upside space is opened, the support below will focus on the 3285-3295 line, which is the lower edge of the May oscillation platform. If it falls below, the pressure of the correction may increase. The loss of the middle track in the 4-hour chart further confirms the short-term weak structure and provides technical support for the downward trend. It is recommended to go long on the pullback near 3285-3295. At present, gold continues to fall in line with the trend.

The golden storm is coming again, are you ready?Gold rebounded after falling back to 3333 in the first wave, and then rebounded to 3357 in the second wave before falling again, breaking through the previous low of 3333 and accelerating down to 3316. Currently, the short-term trend has stabilized in the 3316 area, which is also the support level for multiple rebounds in the previous period. After continuing to fall today, it has not broken through. We have arranged long orders in the 3316-3317 area in advance and have taken profits near 3331. Gold rebounded after stepping back again. Our long order plan is still in position. If the subsequent rebound breaks through the 3333 line, it is expected to further rise to the 3340-3348 area. We will try to short in this area.
In the short-term structure, the upper resistance focuses on the 3340-3348 area, and the lower support focuses on the 3310-3315 area. 3300-3305 is the watershed between the strength of long and short positions in the short term. The daily level is still under pressure as a whole, and the main idea of high altitude continues.
Gold operation strategy: short gold when it rebounds to around 3340-3348, target the 3330-3320 range.
XAU/USD) Bullish reversal analysis Read The captionSMC trading point update
Technical analysis of Gold (XAU/USD) on the 30-minute timeframe, based on technical signals and price action behavior. Here's the breakdown
---
Gold Bullish Reversal Setup – Targeting 3,384
---
Key Technical Highlights:
1. Support Zone & Price Reaction:
Price has tested a strong horizontal support level (highlighted in yellow).
Multiple bullish rejection wicks indicate buying pressure at this zone.
The green arrows show successful support bounces, hinting at bullish intent.
2. Trendline Analysis:
Price bounced near the lower boundary of the falling wedge/downtrend channel.
An uptrend line convergence supports potential reversal.
A breakout above the short-term descending trendline is indicated.
3. EMA & Target Projection:
EMA 200 at 3,364.33 may act as dynamic resistance, the next short-term hurdle.
Target zone projected at 3,384.04, offering a potential move of +65.67 pts (~1.98%).
4. RSI Indicator:
RSI(14) is oversold (~29.93), signaling a potential reversal.
A bullish crossover may be forming, supporting upward momentum.
---
Trading Plan:
Entry Zone: Near current support area around 3,325
Target: 3,384
Stop Loss (Suggested): Below 3,300, under support structure
Risk/Reward: Favorable based on support hold and breakout projection
Mr SMC Trading point
---
Conclusion:
This setup suggests a short-term bullish reversal from a key support area, with confirmation likely if price breaks above the descending trendline and clears the 200 EMA.
Please support boost 🚀 this analysis)

War breaks out again? The latest analysis and layout of gold📰 Impact of news:
1. The ceasefire agreement reached earlier did not take effect, and Trump believed that both sides violated the agreement
2. Federal Reserve Chairman Powell delivered a speech 3 hours later
📈 Market analysis:
At the 4H level: the Bollinger Band opening is enlarged, the MACD indicator double-line death cross is downward, the short-selling force is strengthened, but the RSI indicator rebounds after being oversold. Overall, there are obvious signs of a rebound in gold prices. At the hourly level: the gold price is in a downward channel, the Bollinger Bands are expanding, the MACD indicator is dead cross and the red bars are converging, and the short momentum has weakened. The RSI indicator rebounds from oversold, and the demand for spot gold rebounds is obvious. Therefore, we still hold long orders near 3320 in the short term. Short-term operation suggestion: go long when it stabilizes at 3325-3315, pay attention to the resistance range of 3370-3380 on the upside, and consider shorting when encountering resistance and pressure.
🏅 Trading strategies:
BUY 3325-3315
TP 3335-3345-3365
SELL 3370-3380
TP 3340-3330
If you agree with this view, or have a better idea, please leave a message in the comment area. I look forward to hearing different voices.
OANDA:XAUUSD FX:XAUUSD FOREXCOM:XAUUSD FXOPEN:XAUUSD TVC:GOLD

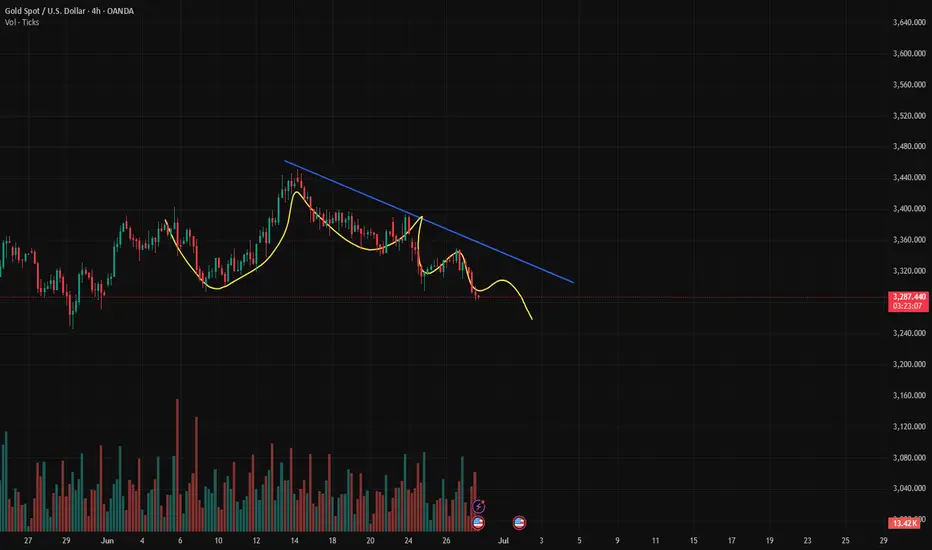
Bearish Continuation Pattern Detected on GOLD/USD Bearish Continuation Pattern Detected on GOLD/USD 📉
📊 Chart Analysis Summary:
The GOLD/USD chart shows a clear bearish continuation pattern, following a rejection from a major resistance zone.
🔍 Key Technical Highlights:
🔺 Resistance Zone:
Strong resistance at 3,420 – 3,440 USD, marked by multiple rejections (🔴 red arrows).
Price formed a Bearish Harmonic Pattern (likely a Gartley or Bat), suggesting reversal from this resistance.
🔻 Bearish Momentum:
After the pattern completed, price broke below the minor support structure and is currently forming lower highs and lower lows, indicating bearish structure.
📉 Support Level:
Strong horizontal support zone around 3,298 – 3,300 USD, marked as “TARGET.”
This area was previously tested (🟠 orange circles) and now projected to act as a target level again.
🔄 Minor Retracement Zone:
Expecting a minor pullback to 3,347 USD (purple line) before potential continuation downward.
This zone aligns with the previous support turned resistance (classic SR flip).
🎯 Target Projection:
Based on the bearish impulse and measured move, the projected target is around 3,298.758 USD, which coincides with the previous support zone.
📌 Conclusion:
The price action suggests a high-probability bearish continuation, targeting the 3,298 USD zone unless the price breaks and holds above 3,347 USD. Traders may consider selling on rallies with a confirmation of rejection at resistance.
📉 Bias: Bearish
📍 Invalidation: Break and daily close above 3,347 USD
📉
📊 Chart Analysis Summary:
The GOLD/USD chart shows a clear bearish continuation pattern, following a rejection from a major resistance zone.
🔍 Key Technical Highlights:
🔺 Resistance Zone:
Strong resistance at 3,420 – 3,440 USD, marked by multiple rejections (🔴 red arrows).
Price formed a Bearish Harmonic Pattern (likely a Gartley or Bat), suggesting reversal from this resistance.
🔻 Bearish Momentum:
After the pattern completed, price broke below the minor support structure and is currently forming lower highs and lower lows, indicating bearish structure.
📉 Support Level:
Strong horizontal support zone around 3,298 – 3,300 USD, marked as “TARGET.”
This area was previously tested (🟠 orange circles) and now projected to act as a target level again.
🔄 Minor Retracement Zone:
Expecting a minor pullback to 3,347 USD (purple line) before potential continuation downward.
This zone aligns with the previous support turned resistance (classic SR flip).
🎯 Target Projection:
Based on the bearish impulse and measured move, the projected target is around 3,298.758 USD, which coincides with the previous support zone.
📌 Conclusion:
The price action suggests a high-probability bearish continuation, targeting the 3,298 USD zone unless the price breaks and holds above 3,347 USD. Traders may consider selling on rallies with a confirmation of rejection at resistance.
📉 Bias: Bearish
📍 Invalidation: Break and daily close above 3,347 USD

Are you ready for the next wave of gold market?Gold fell back as expected after opening high. Today's strategy arranged long orders at 3350-3352, and successfully closed the market at around 3362 with profit. The subsequent three short orders also closed the market at a profit as expected. The points were perfectly predicted, and the long and short positions were perfectly grasped during the day. The strategic ideas were disclosed in advance and all were fulfilled.
At present, the overall trend of gold is still bullish, and it is in the adjustment stage in the short term. The large range this week is 3340-3405. Although there is a rebound, the upward pressure is still not small, and the gold price may continue the wide range of long and short fluctuations. Pay attention to the 3355-3340 area below. In terms of operation, long orders are arranged according to the strength of the retreat; pay attention to 3385 in the short term above. If it can effectively break through, look at 3395-3405. The strong pressure is still at the 3405 line. If it does not break, it will still fall under pressure. On the contrary, if it stabilizes, it is expected to hit last week's high.
Operation suggestion: When gold falls back to around 3355-3340, long orders can be arranged in batches, with the target at 3370-3380. Short orders will be adjusted according to the real-time market, please pay attention to the bottom 🌐 notification for specific points.

Gold XAU/USD Bullish Reversal Setup – Targeting $3,454.65Price: $3,384.41
Strategy: Buy/Long
🟦 Key Levels:
Entry Zone: Around $3,345.76
This level aligns with a previously tested support zone marked in purple.
Stop Loss: $3,331.56
Below the support zone, providing downside protection if the setup fails.
Target (TP): $3,454.65
Marked as EA TARGET POINT, suggesting a potential upside of 3.16% (~$105.83 gain).
📊 Technical Indicators:
Moving Averages:
200 EMA (blue): Near the entry level, adds strength to the support zone.
50 EMA (red): Recently crossed below price, indicating early bullish momentum.
Price Action:
Sharp bounce from support suggests buying interest.
Potential inverse head and shoulders pattern forming, which is a bullish reversal pattern.
🧠 Trade Idea:
Buy near $3,345.76,
Stop Loss at $3,331.56,
Take Profit at $3,454.65
Risk/Reward Ratio ≈ 1:3.3 — favorable setup for long positions.
