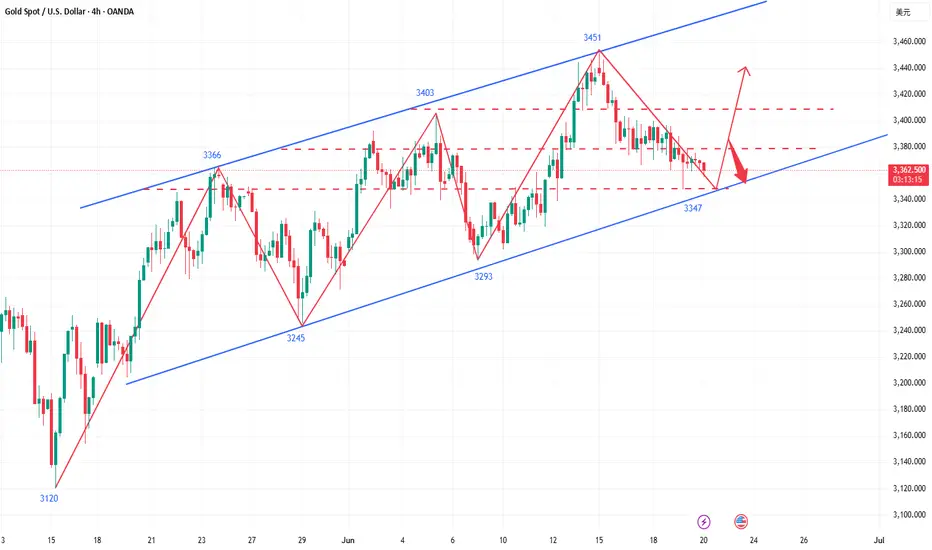
Follow the trend and go short, and buy when the price falls backAffected by the situation in the Middle East, gold opened higher and lower again on Monday, and the trend was exactly the same as last Monday. After the opening, gold fell back to the 3352-3355 line and fluctuated. We planned to arrange long orders near 3350, but gold went up directly and did not give an entry opportunity. During the rebound, gold was blocked and under pressure at the 3366 line, and at the same time, there were signs of stagflation at high levels. Combined with the short-term adjustment needs, the strategy was to arrange short orders near 3364 and successfully stop profit at the target of 3350. Then we went long at the 3348-3350 line, which is also the preset long entry area. The current target continues to focus on the 3370-3380 area. So far, although gold opened high and went low, the overall bullish trend channel has not been broken, and the retracement to long is still the current mainstream direction.The specific points are subject to the bottom 🌐 notification.
From the current trend, the support below focuses on the 3340-3345 area. Combined with the stimulus of the Middle East situation over the weekend, the short-term upper resistance focuses on the 3380-3385 area. The expectation of breakthrough is still there, and the focus is on the suppression performance of the 3400-3415 line. The overall strategy continues to rely on the idea of buying on pullbacks. Watch more and do less in the middle position, chase orders cautiously, and wait patiently for clear signals at key points before intervening.
Gold operation strategy: Gold retracement near the 3340-3350 line to do more, the target is 3370-3380.
Goldpreis

Gold (XAU/USD) 4H Analysis-23 June 2025Gold (spot XAU/USD) is currently trading around $3,358. On the 4-hour chart, price has been range-bound between $3,356 and $3,400. Recently, gold attempted to break higher (up to around $3,394) but quickly reversed — a sign that the breakout may have been a smart money trap. Technically, the structure saw a break below $3,380 in mid-June, leading to a push toward the $3,323 region. This reflects a short-term bearish wave followed by stabilization near the lows.
Bias: The market is currently neutral-to-bullish, depending on key supports. As long as price holds above the $3,322–$3,330 swing-lows, dips are considered buying opportunities. Notably, an order block/demand zone around $3,357–$3,360 appears to be holding well and attracting buyers. On the upside, $3,400 acts as a strong resistance level. A break above $3,400 would shift the bias firmly bullish, while a break below $3,338 would suggest bearish momentum returning.
🔑 Key 4H Support & Resistance Levels
Resistance:
• $3,400 – Major round number and recent high
• $3,434–$3,435 – Next resistance above $3,400
• $3,451–$3,452 – Recent swing top
• $3,500 – All-time-high level
Supply Zone:
• $3,388–$3,394 – Minor resistance and previous support turned supply
Demand Zone (Order Block):
• $3,357–$3,360 – Major 4H demand area showing strong buyer interest
Support:
• $3,338 – Critical support level below the order block
• $3,322–$3,323 – Multi-source key swing support
• $3,280–$3,300 – Lower targets if support fails
• $3,260 or below – Worst-case downside projection if breakdown accelerates
📈 1-Hour Intraday Trade Setups
Buy the Dip
• Entry: $3,357–$3,360
• Confirmation: Bullish reversal candle on 1H
• Stop Loss: Below $3,336
• Targets: $3,380 → $3,400
Sell a Rejected Rally
• Entry: Near $3,400 (only if clear rejection is seen)
• Confirmation: Bearish reversal candle or price stalling
• Stop Loss: Above $3,400
• Targets: $3,360 → $3,330
Breakdown Short
• Entry: If price breaks below $3,338 with strong 1H close
• Stop Loss: Above $3,345
• Targets: $3,323 → $3,300
Bullish Breakout Trade
• Entry: Break and retest above $3,400
• Confirmation: Clean 1H close above $3,400
• Stop Loss: Just below $3,400
• Targets: $3,434 → $3,452
✅ Final Takeaway
Gold is currently trading inside a $3,330–$3,400 range. The best intraday opportunity is to buy dips into the $3,357–$3,360 demand zone with a stop below $3,330, targeting $3,400+. If support breaks, flip to short toward $3,320–$3,300.

Gold bottomed out and rebounded, continue to go longAffected by the situation in the Middle East, gold opened high and fell again on Monday, just like last Monday. At present, it has fallen back to the 3352-3355 line and fluctuated. Although it is under short-term pressure, the bull channel has not been broken, and the retracement is still a long opportunity. The support below is 3340-3345, and the short-term resistance is 3380-3385. It is only a matter of time before it breaks through. The key suppression is still in the 3400-3415 area. In terms of strategy, continue to arrange long orders around the retracement, be cautious in chasing orders in the middle oscillation zone, and wait patiently for key position signals. The specific points are subject to the bottom 🌐 notification.
Gold suggestion: arrange long orders around 3340-3350, and the target is 3370-3380.

Wait for the key points to be confirmed before taking actionThe trend of gold on Friday is still in line with my analysis. Before the market opened, I suggested that gold would rebound from the bottom. Considering the resistance level, I would arrange short orders with a light position. I clearly emphasized that I should not chase short orders at low levels. The actual market price fluctuated upward after hitting the 3340 line at the lowest point, and maintained a range-bound fluctuation pattern as a whole. We arranged long orders in batches at 3342-3353, successfully stopped profit near 3358, reversed shorting, and stopped profit again at 3342. After that, the market hit the top again and was blocked. Short orders were arranged at 3370-3375. It is not recommended to hold positions over the weekend. I have already left the market with a small profit near 3365. Although there was no significant breakthrough, all ended with profit, but it was quite satisfactory for Friday's market.
News: Gold prices were stable on Friday, but fell 1.8% this week. It closed at 3368. The latest Federal Open Market Committee (FOMC) statement reinforced the Fed's cautious stance, keeping interest rates in the 4.25%-4.50% range. However, the statement also lowered the number of expected rate cuts this year, which put downward pressure on gold prices. In addition, U.S. Treasury yields did not change much but rose slightly, reflecting the stabilization of market risk sentiment. The 10-year Treasury yield rose by more than 2 basis points to 4.421%, and the 30-year Treasury yield rose to 4.924%. Rising yields often put pressure on non-yielding assets such as gold, further suppressing the upward momentum of gold prices. The Fed's failure to immediately launch an easing policy, coupled with a stronger dollar and a reduced urgency of geopolitical risks, have all exacerbated selling pressure. Unless tensions escalate again or the Fed unexpectedly turns, short-term gold price forecasts point to further weakening.
The price of gold has rebounded since it fell from its historical high of 3500 to 3120, After continuous rise, due to the decline of risk aversion in the market, it fell under pressure at 3452. It rebounded to 3340 on Friday. The K-line combination arrangement was bearish. The 4H chart showed a stop-loss signal. It is expected that the market will consolidate below 3400 in the short term. In the medium term, attention should be paid to the geopolitical crisis and the July interest rate decision of the Federal Reserve. It will break through the node after confirming the upper resistance of 3400. In the short-term 4-hour chart, the lower support is around 3340-3345, and the upper short-term resistance is around 3380-3385. Focus on the suppression of the 3400-05 line. The overall idea of retracing back to long positions remains unchanged, and the middle area is mainly kept on the sidelines. Be cautious in chasing orders and wait patiently for the key points to be confirmed before intervening. If the upper resistance is not broken, you can still consider light positions to arrange short orders, and pay attention to the bottom for the specific entry point.

The rebound is weak, is it expected to continue to decline? 📰 Impact of news:
1. Geopolitical situation
2. Pay attention to the impact of short-term trends of the US dollar and silver on gold
📈 Market analysis:
The weekly level large range sweep is still going on, with a focus on the space defense dividing line area of the 10-day moving average and the 3315-3310 area. After falling back to the lifeline in four hours, it continued to bend downward under pressure. During the sweeping decline, the suppression became more obvious. Whether there will be a wave of large-volume market, the pattern is expected to further open and guide the direction. In this process, note that the lifeline 3375 is also the resistance point determined by the last rebound last night. Use this as suppression to sweep the range below. On the whole, for the future gold, if it can maintain the rhythm of defending highs and breaking lows, and successfully closes at a low level today, then next week it is expected to further switch downwards to sweep space. Therefore, we will continue to focus on two support areas, one is 3345-3335, and the other is 3315-3310 after breaking
🏅 Trading strategies:
BUY 3345-3335
TP 3355-3365
SELL 3365-3375
TP 3345-3335-3315
If you agree with this view, or have a better idea, please leave a message in the comment area. I look forward to hearing different voices.
TVC:GOLD FXOPEN:XAUUSD FOREXCOM:XAUUSD FX:XAUUSD OANDA:XAUUSD

XAU/USD Bullish Breakout from Flag PatternBullish Flag Formation: The price consolidated in a downward-sloping flag after a sharp bullish move. A breakout has occurred, signaling renewed buying pressure.
Support Zone: The breakout aligns with the horizontal support area around 3,392, reinforcing the bullish bias.
Upside Targets: Based on price structure and measured move projection:
First target: 3,435 – 3,452
Final target zone: 3,500+
Momentum Confirmation: The Ichimoku cloud supports bullish continuation as price trades above it, showing strong upward momentum.
Conclusion:
Gold appears to be resuming its uptrend after a brief consolidation. As long as price holds above the breakout level (around 3,392), the bullish targets remain valid. Ideal scenario for continuation traders looking for entries on minor pullbacks

The bear market is over? Short at high and long at low📰 Impact of news:
1. The interest rate remains unchanged and leads to new lows in the short term
2. Geopolitical tensions provide support for risk aversion
📈 Market analysis:
Due to the early closing yesterday, the volatility of the US market was limited and the market seemed relatively flat. From a technical perspective and the current trend, 3340 is a key defensive support level. If it retreats to this level, you can consider going long. If the gold price continues to rise and reaches 3375, from the perspective of trading strategy, you can choose to place a short order here. Focus on the resistance line of 3370-3375 during the day, and pay attention to the support of 3345-3335 below.
🏅 Trading strategies:
SELL 3370-3375
TP 3360-3355-3345
BUY 3345-3335
TP 3360-3370
If you agree with this view, or have a better idea, please leave a message in the comment area. I look forward to hearing different voices.
OANDA:XAUUSD FX:XAUUSD FOREXCOM:XAUUSD FXOPEN:XAUUSD TVC:GOLD

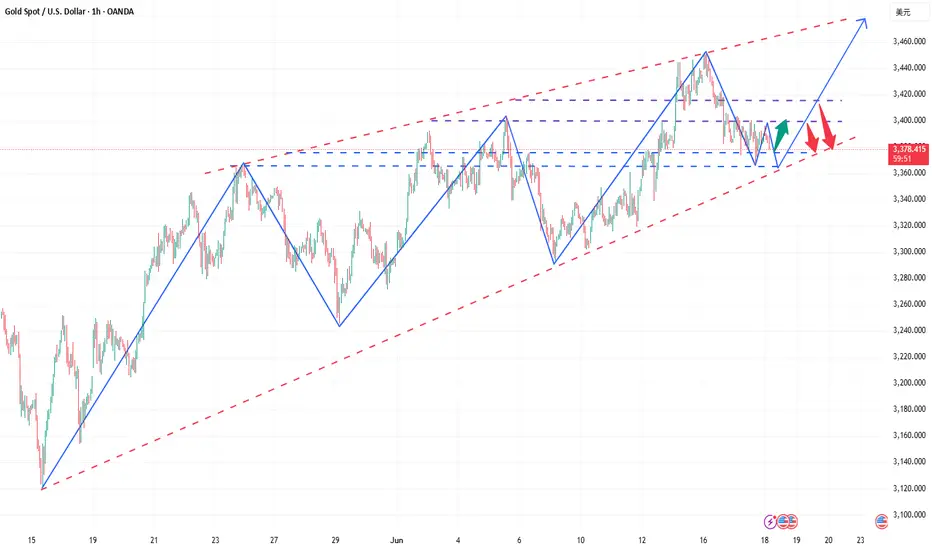
The bulls are not dead yet, it’s time to ambush at low levels!Gold only opened higher and rose on Monday this week, and then reached the highest level of 3452, and then started the road of shock and retracement this week. As of today, Friday, gold is still oscillating and adjusting in the lower range, but from the 4-hour market trend, the trend of gold is still dominated by bulls. In the short term, gold is oscillating and adjusting at a low level. Today, Friday, we will first focus on the support level of 3347-3353 below, which is also the starting point of the rebound yesterday. If this position is not broken today, Friday, we will mainly rebound and close.
From the 4-hour analysis, the support below focuses on 3347-3353, and the short-term resistance above focuses on the 3378-3385 level, with a focus on the 3408-3415 level. Continue to rely on this range to maintain the main tone of high-altitude low-multiple cycle participation unchanged, and the middle position is always more watchful and less active, cautiously chase orders, and patiently wait for key points to enter the market.
Gold operation strategy: Go long when gold falls back to 3347-3355, with a target of 3370-3380.
If you still lack direction in gold trading, you might as well try to follow my pace. The strategy is open and transparent, and the execution logic is clear and definite, which may bring new breakthroughs to your trading. The real value does not rely on verbal promises, but is verified by the market and time.
XAU/USD(20250620) Today's AnalysisMarket news:
The Bank of England kept interest rates unchanged at 4.25%, and the voting ratio showed that internal differences were increasing. Traders expect the bank to cut interest rates by another 50 basis points this year.
Technical analysis:
Today's buying and selling boundaries:
3369
Support and resistance levels:
3409
3494
3384
3353
3344
3329
Trading strategy:
If the price breaks through 3369, consider buying, and the first target price is 3384
If the price breaks through 3353, consider selling, and the first target price is 3344

Gold-----sell near 3393, target 3380-3366Gold market analysis:
Yesterday, gold was basically a repeated shock, the K line was repaired at one position, and buying and selling were back and forth around the M side of the suppression platform 3405. Yesterday, our analysis was completely in line with our expectations. Yesterday, we also repeatedly arranged 5 sell orders, arranging 3382 break sell, 3387 sell, 3393 sell, 3382 sell, 3377 sell. Today's idea is to continue selling. The daily line cannot determine the bottom of this wave of decline. There are data in European and American time today. I think we can rely on the 3405 platform to be bearish before the data. If 3405 breaks, we adjust our thinking to be bullish. Otherwise, we can sell repeatedly. Gold is oscillating in the short term. Try not to chase it and wait for it to rebound and suppress the position to sell. In addition, the daily moving average suppression position of the moving average is 3396-3363, which is also the main reason for its repeated game at this position. The weekly buying momentum is not dead yet. Be cautious of its rocket in the second half of the week.
In today's Asian session, we will first focus on the suppression of 3395. The risk of taking more is relatively large. The low point below is not stable. The Asian session fell to 3370 and rebounded quickly. From the perspective of the pattern, 3372-3366 is the support. The suppression position of the 1H hourly moving average is near 3395. Yesterday's US session rebounded at around 3396, and the hourly K suppression position was 3400. All the above are suppressed. In addition, the opening position today is also near 3393.
Pressure 3393, 3400, 3405, support 3382, 3370, and the watershed of strength and weakness in the market is 3382.
Fundamental analysis:
In the previous fundamentals, we have been paying attention to geopolitical factors. The situation in the Middle East has indeed changed the way gold and crude oil are traded. Today we focus on the monetary policy of the Federal Reserve, and there is also a speech by Chairman Powell during the US session.
Operation suggestions:
Gold-----sell near 3393, target 3380-3366

XAU/USD) Back Bullish trand Read The captionSMC Trading point update
Technical analysis of Gold (XAU/USD) on the 3-hour timeframe based on a price action setup within a rising channel and a key support zone. Here's a breakdown of the analysis:
---
Technical Overview:
Trend Structure:
The price is moving within a rising channel (marked by the black trendlines). Recent touches on both the top and bottom of the channel suggest that it is being respected.
Key Support Zone (Yellow Box):
Price recently tested a strong support zone around $3,338 – $3,350, which aligns with:
Historical price reaction area.
The 200 EMA (blue line).
An uptrend line support.
A bullish reaction (green arrow) confirming demand.
Bear Trap Breakout:
There’s a false breakout below the support followed by a sharp reversal (green arrow), which could indicate a bear trap, often followed by a bullish rally.
Price Projection:
The projected move suggests a bullish rally toward $3,478.89, offering a potential 3.97% gain (~133 points).
The path includes a possible consolidation before a breakout (illustrated by the wavy arrow).
RSI Indicator:
RSI is recovering from the oversold zone (~45), indicating increasing bullish momentum.
Mr SMC Trading point
---
Trade Idea Summary:
Bias: Bullish
Entry Zone: Around $3,350–$3,370 (post-retest of support)
Target: $3,478.89
Confirmation: Bullish price action at support, 200 EMA bounce, RSI reversal
---
Please support boost 🚀 this analysis)

XAU/USD) Back support level Read The captionSMC trading point update
Technical analysis of XAU/USD (Gold Spot vs U.S. Dollar) – 2H Timeframe:
---
XAU/USD Bearish Rejection from Resistance – Short-Term Sell Setup
Key Observations:
1. Rejection from Upper Channel & Resistance Zone:
Price was rejected sharply after touching the upper boundary of the ascending channel and the newly established resistance zone (~3400–3420).
A strong bearish candle confirms selling pressure at the top.
2. Support Retest in Progress:
The price is currently descending toward the EMA 200 and the KYY support zone (approximately 3343–3348).
The previous bounce originated from this level, making it a significant retest zone.
3. EMA 200 as Confluence:
The 200 EMA (currently at 3346.92) aligns with the support zone, increasing the likelihood of a bounce or at least temporary pause in bearish momentum.
4. RSI Bearish Signal:
RSI has dropped below 50, confirming a momentum shift toward the downside.
Still above oversold territory, suggesting more downside room.
---
Trade Idea:
Bias: Bearish (Short-Term)
Entry Zone: Around 3390–3400 (confirmed rejection area)
Target Zone: 3348 – 3343 (KYY support + EMA 200)
Stop Loss: Above 3425 (just above resistance zone)
Mr SMC Trading point
---
Summary:
Gold has faced a clear rejection at a key resistance zone within an ascending channel, and is now targeting the EMA 200 and previous structural support. Short opportunities could be considered toward the 3343–3348 zone, with RSI and price action supporting the move.
Please support boost 🚀 this analysis)

Is 2025 the right time to make plans?Market news:
On Thursday (June 19) in the early Asian session, spot gold fluctuated in a narrow range and is currently trading around $3,380/ounce. As an important safe-haven asset in the global financial market, the price fluctuations of international gold are often affected by macroeconomic policies, geopolitical situations and market sentiment. Recently, the gold market has shown a complex and eye-catching trend under the dual influence of the Federal Reserve's interest rate decision and geopolitical tensions in the Middle East.The Federal Reserve decided to keep the benchmark overnight interest rate unchanged at 4.25%-4.50% at its meeting on June 18. This decision was in line with market expectations, but its subsequent statement brought new uncertainty to the London gold price market. This cautious stance weakened the market's expectations for the Federal Reserve's rapid easing, causing gold prices to fall 0.57% on Wednesday to close at $3,369/ounce.The current gold market is in a complex environment with multiple factors intertwined. The Federal Reserve's cautious monetary policy stance and inflation expectations caused by tariffs have brought short-term pressure on gold prices, but geopolitical tensions and signs of economic slowdown have provided potential upward momentum for gold prices. Pay attention to the dynamic changes in the global economy and geopolitics to seize investment opportunities in the gold market.
Technical Review:
Gold fell to the MA10-day moving average of 3662 in the early morning and counterattacked 3380 in the Asian session. The Asian session will continue to look at the rebound strength. The gold price will continue to fluctuate and adjust. The large range is 3408/3343, and the small range is 3390/3360. The daily chart fell back to the 10-day moving average at 3362, and the MA5/7-day moving average was suppressed at 3385/90. The RSI indicator continued to flatten the middle axis. The short-term four-hour chart price is running in the middle and lower tracks of the Bollinger Band!
This week, gold rose sharply to 3450 at the opening, and gradually fell slowly to 3365, with a strength of 100 US dollars. Although the main strength in the first two trading days was a decline, the buying trend remained unchanged. In an uncertain environment, there is still a chance of a big rise in the future. So this week's idea continues to maintain short-term selling and long-term buying.
Today's analysis:
After the Fed's interest rate decision, the Fed kept the interest rate unchanged as expected, which was in line with market expectations. Gold continued to fluctuate and fall in the short term, and there was no obvious upward momentum for buying. Even if it was a risk aversion, it might be careful of the trend of rising and falling. Since gold was under pressure at 3400, it continued to sell at high prices when it rebounded under pressure at 3400 during the day.The gold 1-hour moving average continued to sell downward dead cross patterns, and the gold buying rebound was weak. It was under pressure at 3400 for many times in the past two days and began to fall. The short-term 3400 line of gold has become a strong resistance. If gold buying cannot break through 3400 strongly, then gold buying will be difficult to improve. It is likely that it will still be the main venue for gold selling. Gold rebounded at 3400 during the day and continued to sell at high prices.
Operation ideas:
Short-term gold 3365-3368 buy, stop loss 3356, target 3390-3440;
Short-term gold 3395-3398 sell, stop loss 3407, target 3370-3350;
Key points:
First support level: 3368, second support level: 3354, third support level: 3333
First resistance level: 3396, second resistance level: 3408, third resistance level: 3420

Gold-----sell near 3393, target 3380-3366Gold market analysis:
Yesterday, gold was basically a repeated shock, the K line was repaired at one position, and buying and selling were back and forth around the M side of the suppression platform 3405. Yesterday, our analysis was completely in line with our expectations. Yesterday, we also repeatedly arranged 5 sell orders, arranging 3382 break sell, 3387 sell, 3393 sell, 3382 sell, 3377 sell. Today's idea is to continue selling. The daily line cannot determine the bottom of this wave of decline. There are data in European and American time today. I think we can rely on the 3405 platform to be bearish before the data. If 3405 breaks, we adjust our thinking to be bullish. Otherwise, we can sell repeatedly. Gold is oscillating in the short term. Try not to chase it and wait for it to rebound and suppress the position to sell. In addition, the daily moving average suppression position of the moving average is 3396-3363, which is also the main reason for its repeated game at this position. The weekly buying momentum is not dead yet. Be cautious of its rocket in the second half of the week.
In today's Asian session, we will first focus on the suppression of 3395. The risk of taking more is relatively large. The low point below is not stable. The Asian session fell to 3370 and rebounded quickly. From the perspective of the pattern, 3372-3366 is the support. The suppression position of the 1H hourly moving average is near 3395. Yesterday's US session rebounded at around 3396, and the hourly K suppression position was 3400. All the above are suppressed. In addition, the opening position today is also near 3393.
Pressure 3393, 3400, 3405, support 3382, 3370, and the watershed of strength and weakness in the market is 3382.
Fundamental analysis:
In the previous fundamentals, we have been paying attention to geopolitical factors. The situation in the Middle East has indeed changed the way gold and crude oil are traded. Today we focus on the monetary policy of the Federal Reserve, and there is also a speech by Chairman Powell during the US session.
Operation suggestions:
Gold-----sell near 3393, target 3380-3366

Golden investment opportunity emerges!Market news:
In the early Asian session on Wednesday (June 18), spot gold fluctuated in a narrow range and is currently trading around $3,380 per ounce. As the "safe haven king" in the global financial market, international gold has shown resilience in bottoming out and rebounding under the dual drive of recent geopolitical and economic uncertainties. The rise in London gold prices is inseparable from the fueling of tensions in the Middle East. The conflict between Iran and Israel has entered its fifth day, and geopolitical risks continue to heat up, injecting strong momentum into safe-haven assets.Although geopolitical risks have pushed up the safe-haven demand for gold, the strong performance of the US dollar has significantly suppressed gold prices. Against the backdrop of escalating conflicts in the Middle East, the dollar's renewed support and the Federal Reserve's cautious attitude have become important factors limiting the upward trend of international gold prices. Investors need to pay close attention to the Fed's policy guidance, the trend of the US dollar and the latest developments in the Middle East. In addition, the initial value of the annualized total number of US building permits in May and the annualized total number of US new home starts in May will also be released on this trading day, and investors also need to pay attention.
Technical Review:
Gold bottomed out and rebounded, and adjusted widely and fluctuated fiercely. The daily chart closed with a positive cross line, and the RSI indicator's central axis 50 value flattened. The price dropped to the MA10 daily average line of 3366 and rebounded sharply, reaching 3396 in the Asian session. The short-term four-hour chart moving average is glued together, and the RSI indicator's central axis is adjusted. The hourly chart Bollinger Bands are closed, and the moving averages are glued together. Technically, gold maintains a wide range of fluctuations and short-term participation.The intraday trend and the weekly chart's high point gradually move downward, which shows that the control of selling in the market is gradually increasing. Although the gold price failed to continue the buying trend at the beginning of the week, it does not mean that buying is completely dominant, especially before the announcement of the Federal Reserve's interest rate decision on Thursday this week, the market still has strong uncertainty about the future trend!
Today's analysis:
After gold bottomed out, it began to fluctuate again, but the overall trend is still selling. The gold rebound is still under pressure at 3400 and began to fall back. In the short term, gold 3400 is still an important resistance. Gold continues to sell at high prices before it effectively breaks through 3400. Today’s market is once again blocked when it hits a high point. The current intraday high is around 3396. The market has been operating under the pressure of 3400 in the past two days, and there is no sign of the market standing above 3400. Therefore, the 3400 barrier is still an effective pressure point. As long as it does not break through and stabilize at 3400 today, the rebound is an opportunity for us to sell!
Operation ideas:
Short-term gold 3365-3370 buy, stop loss 3356, target 3390-3440;
Short-term gold 3390-3400 sell, stop loss 3408, target 3370-3350;
Key points:
First support level: 3363, second support level: 3346, third support level: 3333
First resistance level: 3400, second resistance level: 3408, third resistance level: 3420

Accurate operation, both long and short gains!Gold has experienced a typical volatile market today, first rising to 3400 and then falling back to around 3380 as expected. The short order plan we arranged in advance was successfully closed, and we successfully took this wave of callback profits. What is more worth mentioning is that we also accurately entered the long order in the previous round of retracement and steadily harvested the rebound profits. The rhythm of long and short switching is smooth, the strategy is clear, and the execution is decisive - this is what trading should be like. The market is repetitive, and opportunities are always there. Whether you can put the profit steadily into your pocket depends not on how many times you are right, but on whether you can execute it at the key points.
At present, the trend of gold shows that although there is a rebound after each decline, the strength is generally weak and it has never been able to break through the 3405 suppression level. The overall situation is still in a range of fluctuations, and market sentiment is still waiting for further guidance from the Fed. Therefore, short-term operations are still based on key points, and the market rhythm is slow, requiring more patience. In the case of no break at present, continue today's thinking to operate, unless there are sharp fluctuations in the short term or sudden news or geopolitical situations, then make adjustments.
Gold operation suggestions: 1. Gold short orders: short near 3397-3405, target 3385-3375. 2. Gold long orders: long near 3375-3370, 3365-3360 can cover positions, target 3380-3390-3400.
If you still lack direction in gold trading, you might as well try to follow my pace. The strategy is open and transparent, and the execution logic is clear and definite, which may bring new breakthroughs to your trading. The real value does not rely on verbal promises, but is verified by the market and time.

XAUUSD:Go long
As can be seen from the chart, the decline of gold actually did not fall below 3380 each time, the actual close longer lower shadow, and from yesterday's trend can be seen 3400 is a certain pressure exists, so today to see whether this position can break through. After the break, we continue to look up, and then increase the trading range.
For now or first around the narrow range to trade.
Trading Strategy:
BUY@3378-84
TP:3395-3400
↓↓↓ More detailed strategies and trading will be notified here ↗↗↗
↓↓↓ Keep updated, come to "get" ↗↗↗

GOLD/USD Bearish Rejection at ResistanceGOLD/USD Bearish Rejection at Resistance 📉🟥
🔍 Technical Analysis Overview:
The GOLD/USD chart shows a clear bearish rejection pattern forming near the resistance zone around $3,450, marked with red arrows. After price tested this level twice, strong selling pressure appeared, resulting in a sharp decline.
📌 Key Observations:
🔴 Resistance Zone:
Price was rejected from the resistance area around $3,450 twice, indicating strong seller presence.
Double top-like behavior seen with lower highs confirming weakening bullish momentum.
🟠 Support Zone:
A well-respected support level near $3,250 has been identified based on past reaction (highlighted with orange circles).
Price previously bounced twice from this zone, validating it as a strong support level.
🎯 Target Level:
A near-term target of $3,305.586 is marked, which aligns with previous reaction zones and short-term structure support.
If momentum continues, a deeper push toward $3,250 support is probable.
📉 Bearish Bias Justified By:
Clear rejection from resistance
Lower high formation
Current consolidation with downward bias
Possible breakout to downside if $3,305 fails to hold
⚠️ Risk Note:
If price retraces and breaks back above $3,400 with volume, the bearish setup will be invalidated.
📊 Conclusion:
The chart favors bearish continuation with a primary target around $3,305, and extended downside to $3,250 if bearish pressure sustains. Traders should watch for bearish confirmation patterns below current price before engaging.
🔽 Resistance: $3,450
🔼 Support: $3,250
🎯 Target: $3,305

Once again, we seized a golden opportunityYesterday, gold fluctuated throughout the day and failed to break through the key range we pointed out. The current structure continues to fluctuate. During the day, we will continue to pay attention to the strong support of 3365-3360 below. This area is the key defensive position we emphasized yesterday. As long as this area is not broken, the bulls still have a chance to make a comeback. The long orders we arranged today at 3370-3375 have all been taken profit near 3387, and the short-term is perfectly realized! At present, 3400 above is the primary pressure position. We have also given a short order plan. We continue to hold it at present, and the target is to take profit when it falls back to 3380-3375.
The overall idea is to maintain the main long and auxiliary short rhythm. In terms of operation, the interval thinking is prioritized, and wait for the key points to be confirmed before taking action. If it breaks through, change the idea in time.
Operation suggestion: Gold falls back to 3375-3370 and goes long with a light position, and further falls back to 3365-3360 to cover the position. The target is 3380-3390-3400.
If you still lack direction in gold trading, you might as well try to follow my pace. The strategy is open and transparent, and the execution logic is clear and definite, which may bring new breakthroughs to your trading. The real value does not rely on verbal promises, but is verified by the market and time.

Golden opportunity comes again!Gold fluctuated all day yesterday, and finally did not break the range we gave. Today we continue to focus on the strong support range of 3365-3360, because this position is also the important key support we gave yesterday. Today we continue to look for opportunities to go long when we step back. As long as the strong support position below is not broken, there will be hope for the bulls to make a comeback.
From the current analysis of gold trends, gold continues to focus on the short-term support near 3375-3370 below, and the important support is around 3365-3360. The short-term focus is on the short-term suppression near 3400-3415 above. The operation is temporarily based on the range. There is a high probability that the short-term fluctuations will continue. Wait patiently for the key points to enter the market.
Gold operation strategy: Go long when gold steps back to 3375-3370, and cover long positions when it steps back to 3365-3360. The target is around 3380-3390-3400.
If you still lack direction in gold trading, you might as well try to follow my pace. The strategy is open and transparent, and the execution logic is clear and definite, which may bring new breakthroughs to your trading. The real value does not rely on verbal promises, but is verified by the market and time.
GOLD/USD Bearish Rejection at Resistance ZoneGOLD/USD Bearish Rejection at Resistance Zone 📉🟥
📊 Technical Overview:
The chart for GOLD/USD shows a clear price action behavior between a well-defined resistance zone (~3,480–3,510) and a support zone (~3,260–3,280).
🔻 Bearish Signals:
The price has tested the resistance zone multiple times (highlighted with red arrows and orange circles) but failed to break above it, indicating strong selling pressure.
The current price action suggests another lower high formation, which is a bearish signal 📉.
Recent candles are rejecting the upward move, pointing to potential downside movement.
🟩 Support Confirmation:
Previous reactions from the support zone (green arrows) show that buyers have consistently stepped in near the 3,260–3,280 range.
This level remains a key demand zone where a bounce might be expected.
🔁 Outlook:
If the price continues to reject the resistance and follows the pattern, we might see another drop towards the support area.
A break below the support zone would confirm a bearish breakout and could open the door to deeper downside targets.
📌 Conclusion:
GOLD/USD is trading within a range, but the repeated failures at resistance suggest bearish momentum might take control in the short term. A move back toward the support zone is likely unless a breakout above resistance occurs.
📉 Resistance: 3,480–3,510
🟩 Support: 3,260–3,280
🔍 Bias: Short-term Bearish unless resistance breaks

GOLD/USD – Bullish Reversal Pattern FormingGOLD/USD – Bullish Reversal Pattern Forming 🟢📈
📊 Chart Analysis:
The chart shows a strong Inverse Head and Shoulders pattern forming, which is a classic bullish reversal signal:
🔹 Left Shoulder and Right Shoulder – Marked with orange circles, both found support near the 3,263 level (purple line), suggesting strong buying interest at this zone.
🔹 Head – The lowest point in between the shoulders, also bouncing from support.
🔹 Resistance Zone – Marked with red arrows around 3,500–3,520. This zone has rejected price action multiple times in the past.
🔹 Support Zone – Marked below 3,200, where previous consolidation and buying took place.
📈 Projected Move:
The neckline breakout suggests a potential move toward the 3,520+ level. A minor pullback is expected before continuation. If price breaks above resistance, we could see a strong bullish rally.
📌 Key Levels:
Support: 3,263 🟩
Resistance: 3,500–3,520 🟥
Potential Target After Breakout: 3,550+ 🎯
✅ Bias: Bullish above 3,263 support
⚠️ Invalidation: A break below the neckline would cancel the bullish setup

XUA/USD) Bullish trand support level Read The captionSMC trading point update
Technical analysis of (XAU/USD) on the 30-minute timeframe, incorporating a support zone and trendline confluence strategy. Here's a breakdown
---
Analysis Summary
Key Technical Elements:
1. Uptrend Channel:
Price is trading within a rising channel.
Higher highs and higher lows indicate bullish momentum.
2. Support Zones:
Key Support Level (near 3,400): A horizontal support zone has been marked where price previously bounced (confirmed by green arrows).
Trendline Support: This upward sloping trendline adds confluence to the horizontal support zone.
3. EMA 200 (3,377.96):
Acts as a dynamic support level.
Price is well above the EMA, supporting bullish sentiment.
4. Projected Price Move:
The chart anticipates a dip back to the support area (~3,400), followed by a bullish bounce.
Target is clearly defined at 3,504.01, with a measured move of about +103.36 points from the support.
5. RSI Indicator:
RSI is around 57, which is neutral to slightly bullish.
No overbought/oversold signal yet – supporting potential for more upside.
---
Bullish Bias Reasoning:
Confluence Zone: Horizontal + trendline + EMA 200.
Healthy Price Structure: Higher lows being maintained.
Momentum Indicator (RSI) supports continuation.
---
Risks / Considerations:
If price breaks below the confluence support (~3,400), bullish invalidation may occur.
Monitor for false breakouts or heavy selling pressure near resistance.
Mr SMC Trading point
---
Trading Plan
Buy Zone: Around 3,400 (support confluence).
SL: Below the trendline/EMA – e.g., 3,370 or lower.
TP: Around 3,504 (target zone marked).
Please support boost this analysis)
