Gold price rises as expected, is 3400 far behind?
💡Message Strategy
Trump announced on Friday that he would impose a 35% comprehensive tariff on Canadian imports, which will take effect on August 1, which caused a market shock. As Canada's largest trading partner, the United States accounts for 76% of Canada's exports in 2024. This move will undoubtedly have a profound impact on the global supply chain and trade pattern.
In addition, Trump's tariff policies on copper and Brazil have further exacerbated market uncertainty, pushing gold prices to break through key technical resistance levels and move towards the $3,400 mark.
The Fed's policy moves also have an important impact on market sentiment. The minutes of the June meeting released on Wednesday showed that the Fed's internal concerns about tariffs potentially pushing up inflation are growing. The minutes pointed out that "most participants emphasized that tariffs could have a more lasting impact on inflation."
Despite this, the Fed reiterated that it would remain on the sidelines and wait for further clarity on inflation and economic activity. At present, according to the market forecast of the CME FedWatch tool, the probability of a 25 basis point rate cut in September has risen to 62.9%, reflecting investors' expectations that the Fed may ease early.
📊Technical aspects
Yesterday’s strategic recommendations mentioned that the effective support level for gold was in the 3280-3285 range. Today, gold fell back to the 3280 level, stabilized, and began to rise, perfectly reaching the target.
From a technical perspective, gold has shown significant upward momentum this week. The daily chart shows that the price of gold has successfully broken through the symmetrical triangle resistance and touched the 20-day simple moving average (SMA) of $3,339.97.
This breakthrough marks a strengthening of the short-term technical pattern, showing that bulls have the upper hand. The relative strength index (RSI) has rebounded to around 55 on the daily chart and is trending upward, indicating that there is slight bullish momentum in the market.
However, in the short term, the upside of gold may be limited by the 23.6% Fibonacci retracement level ($3,370). If this level can be effectively broken, the psychological level of $3,400 and the June high of $3,452 will become the next target.
💰Strategy Package
Long Position:3335-3340,SL:3320,Target: 3370-3400
Goldprice

The idea remains unchanged, NY3360-3365 is emptyThe idea remains unchanged during the NY period. Although gold has currently reached a high of around 3348, it has not stabilized above it. If gold successfully breaks through 3350 in the short term, it may reach 3360 or 3365. In the 4H cycle, it presents a step-by-step upward pattern. The K-line is temporarily fluctuating sideways near the upper track. At the same time, 3345 has formed a double top pattern. Combined with Thursday's low of 3310, an inverted triangle oscillation range of 3345-3310 is formed in the short term. This week's trend needs to pay close attention to the breakthrough direction of this range. Short-term long positions can be taken after the trend is confirmed.
XAUUSD@3330-3320 long TP 3345-3365
OANDA:XAUUSD

Breaking through 3350, the bullish trend remains unchanged📰 News information:
1. Pay attention to the impact of Trump administration tariffs
📈 Technical Analysis:
Possible interest rate cuts and tariffs in the fall continue to stimulate risk aversion. Currently, the 3300-3285-3310 points form a head and shoulders bottom pattern. The bullish momentum is relatively strong in the short term. Our short trade near 41 has hit the stop loss. As I wrote before, gold may continue to rise to 3360 or 3365 after breaking through 3350. The current RSI indicator is seriously oversold, so be cautious when operating in a unilateral trend in the short term. The safe way is to wait for a pullback to 3345-3340 to go long
🎯 Trading Points:
BUY 3345-3340
TP 3360-3370-3400
In addition to investment, life also includes poetry, distant places, and Allen. Facing the market is actually facing yourself, correcting your shortcomings, facing your mistakes, and exercising strict self-discipline. I share free trading strategies and analysis ideas every day for reference by brothers. I hope my analysis can help you.
TVC:GOLD FXOPEN:XAUUSD
Bulls rise, beware of Friday's black swan📰 News information:
1. Pay attention to the impact of Trump administration tariffs
📈 Technical Analysis:
Gold rose as expected and touched around 3344, which was in line with our judgment last night. However, from the market point of view, the K-line entity did not stand firmly above 3335. There are only two possible scenarios for the subsequent trend of gold. One is to stand directly above and test the 3345 resistance again, and the other is to fall in the European and American markets due to timeliness and retest the key support of 3310. At present, the upper positions are 3345 and 3365 respectively. If 3345 is repeatedly not broken and the European market falls with acceleration, then the 3310 area will still need to take back the long positions, which can be defined as a long wide-range wash. 3330-3320 is a very critical support position, and 3310 is a strong support. Therefore, the best position for shorting during the day is around 3335-3345, with the target at 3330-3320. Consider long positions after falling back and getting support here.
🎯 Trading Points:
SELL 3335-3345
TP 3330-3320
BUY 3330-3320
TP 3345-3365
In addition to investment, life also includes poetry, distant places, and Allen. Facing the market is actually facing yourself, correcting your shortcomings, facing your mistakes, and exercising strict self-discipline. I share free trading strategies and analysis ideas every day for reference by brothers. I hope my analysis can help you.
OANDA:XAUUSD PEPPERSTONE:XAUUSD FOREXCOM:XAUUSD FX:XAUUSD FXOPEN:XAUUSD TVC:GOLD

Trump's tariff news stimulates gold to explode!
📌 Driving Events
Gold prices rose for the third consecutive day and are expected to close higher this week. The trend turned in favor of gold buyers as tariff tensions intensified. US President Trump announced new tariffs, exacerbating concerns about a trade war.
📊Personal Comments:
Signs of instability in Trump's trade policy have once again hit investor confidence, reviving safe-haven demand for gold. In the absence of any top US economic data, the market will continue to focus on trade headlines. Weekend fund flows may also drive gold price movements.
⭐️Set Gold Price:
🔥Sell Gold Area: 3360-3369 SL 3374
TP1: $3355
TP2: $3342
TP3: $3325
⭐️ Note: Labaron hopes that traders can properly manage their funds
- Choose a lot size that matches your funds
Gold resumes its rally
From the 4-hour analysis, the upper side focuses on the short-term suppression of 3345-50. Today's lower support focuses on the vicinity of 3309-16. The short-term bullish strong dividing line is near 3295-3301. The overall bullish rhythm of high-altitude and low-multiple continues to remain unchanged. Before the daily level falls below the 3300 mark, any retracement is a long opportunity. Short orders against the trend should be cautious.
Gold operation strategy:
1. Go long on gold when it falls back to 3316-25, stop loss at 3307, target at 3340-45, and continue to hold if it breaks;
2. Go short on gold when it rebounds to 3345-50, stop loss at 3357, target at 3320-3326, and continue to hold if it breaks;

Gold prices are faking declines but rising, so beware
💡Message Strategy
As trade uncertainty heats up, gold welcomes safe-haven buying
After the Trump administration issued a series of tariff notices against many countries around the world, market risk aversion has intensified. The US President announced on Wednesday that a new 50% tariff on copper imports will be imposed from August 1, and reiterated that "the deadline will not be extended for countries that have received the notice, and any retaliatory measures will be responded to by tax increases."
This move has triggered market concerns about the slowdown in global economic growth, and traditional safe-haven assets such as gold have been sought after. The current gold price has rebounded significantly from the one-and-a-half-week low hit the previous day.
According to market surveys, safe-haven funds are being reconfigured, especially in the context of the unclear Fed policy and the direction of the US dollar, gold has become a non-yielding asset preferred in the short term.
📊Technical aspects
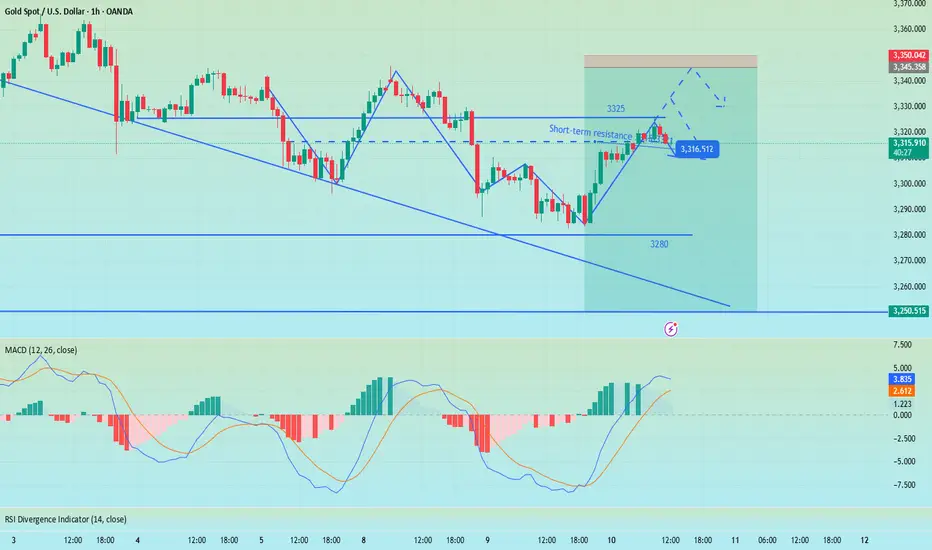
From the 1H chart, the gold price has approached the 100-period simple moving average (SMA), which is currently located around 3,335, forming an initial resistance. If the price effectively breaks through this area, the next resistance level will be in the 3,345-3,350 range. Once it breaks through, it may trigger a short-covering market, pushing the gold price back to the 3,400 integer mark.
If gold breaks above 3,360, it will confirm the short-term bottom and open the door to re-challenging the high point of the year. On the contrary, if the gold price falls below 3,300 again, it may retest the 3,280 support, and further downside space will extend to the July low of 3,247.
For now, the performance of gold bulls is relatively prominent, and it is recommended to do more on the pullback.
💰Strategy Package
Long Position:3300-3310,SL:3285,Target: 3340-3350

XAUUSD Approaches Key Resistance – Will 3,345 Hold or Break?As of July 11, 2025, gold (XAUUSD) is showing a mild recovery around 3,331 USD, following a rebound from the 3,318–3,322 USD support zone. This move comes amid a wave of macroeconomic data and global monetary policy expectations that continue to weigh heavily on gold’s intraday direction.
1. Key Fundamentals Impacting XAUUSD Today
Dollar Index (DXY) remains strong near 106.0 – sustaining pressure on gold due to a firm greenback.
U.S. 10-year Treasury yields are holding above 4.36%, reflecting persistent market expectations that the Fed may keep interest rates elevated in the near term.
June CPI data (YoY) came in at 2.4%, slightly below forecast (2.5%), increasing hopes for a potential rate cut in Q4 – a short-term bullish catalyst for gold
Geopolitical tensions remain subdued, limiting safe-haven inflows into gold in the medium term.
Upcoming U.S. PPI data this week could trigger volatility, depending on whether it surprises to the dovish or hawkish side.
2. Technical Analysis – XAUUSD on H4 Timeframe
Support zone: 3,316 – 3,322 USD, aligning with the 0.5–0.618 Fibonacci retracement of the latest bullish leg.
Resistance zone: 3,345 USD – a confluence of previous highs and 0.618 Fibonacci level of the prior correction wave.
EMA outlook: Short-term EMA is turning upward, indicating potential bullish momentum building.
RSI: Recovering toward 60 but not yet overbought – a sign of healthy upside potential, though confirmation is still needed.
3. Trade Scenarios to Consider
Bullish Breakout Scenario (if price breaks 3,345 USD):
Entry: Buy on H4 candle close above 3,345 USD
Target: 3,357 – 3,370 USD
Stop-loss: Below 3,322 USD
Bearish Rejection Scenario (if price fails at 3,345 USD):
Entry: Sell on bearish reversal candlestick (e.g., pin bar, engulfing) at 3,345 USD
Target: Revisit support at 3,318 – 3,309 USD
Stop-loss: Above 3,350 USD
Gold is trading in a decision zone between short-term support and a major resistance barrier. While macro fundamentals are slightly leaning bullish after soft CPI data, strong dollar strength and high bond yields still cap upside momentum. Traders are advised to wait for price confirmation at 3,345 USD before committing to directional setups.
Follow for more daily gold trading strategies, and save this analysis if you found it useful!

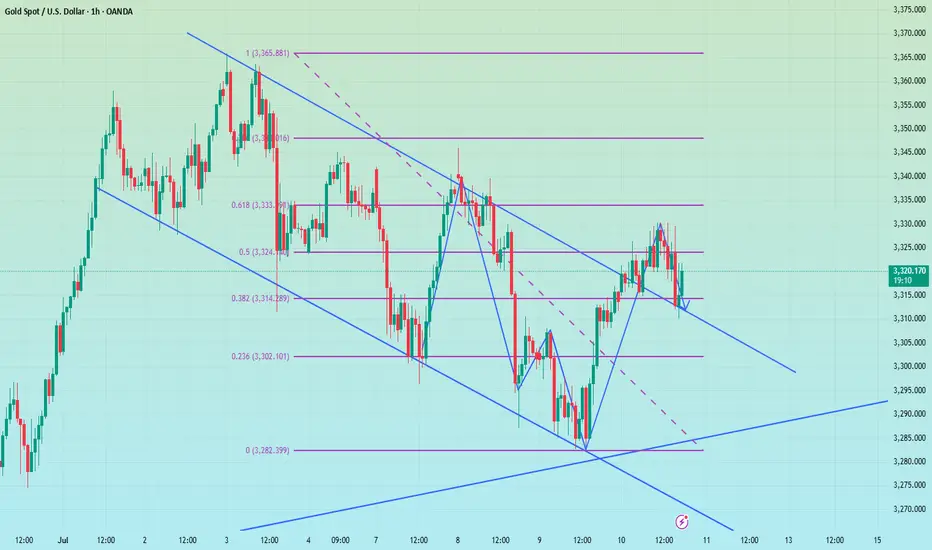
XAUUSD Rises Steadily After RetestXAUUSD Rises Steadily After Retest – Buy Zone Showing Strong Effectiveness
Technical Analysis – July 11, 2025 (H4 Timeframe)
Gold (XAUUSD) is currently trading around $3,345, continuing its steady upward move from the key confluence support at $3,309–$3,318. The bullish momentum has strengthened following a clean break and successful retest of the previous bearish structure.
1. Updated Technical Data:
Current Price: $3,345.10
Fibonacci Retracement:
0.618 at $3,309.69
0.5 at $3,318.91
Recent Swing High (1.0 Fibo): $3,345.69
RSI (H4 Estimate): Around 62 – nearing overbought territory, but still has room for further upside
EMA20/EMA50: EMA20 has crossed above EMA50 – short-term trend is bullish
Next Resistance: $3,357.97 (previous swing high)
Immediate Support: $3,318–$3,309 (Fibonacci confluence zone)
2. Price Action Insight:
Following the correction low at $3,287.02, gold has shown strong recovery with a clear impulsive wave formation. The previous Buy Zone between $3,309–$3,318 has proved highly effective, leading to the current bullish breakout.
A classic “break–retest–continuation” pattern is forming on the H4 chart, suggesting that bulls remain in control unless disrupted by macro events.
3. Suggested Trading Strategies:
Primary Scenario: Buy on Dip
Entry Zone (on retest): $3,330 – $3,318
Stop Loss: Below $3,308
Take Profit 1: $3,345 (already reached)
Take Profit 2: $3,357
Extended Target: $3,368 – $3,372 if $3,357 breaks decisively
Alternative Scenario: Short from $3,357 if Reversal Signal Appears
Stop Loss: Above $3,362
Take Profit: Toward $3,330 – $3,318 support
4. Conclusion for Today:
Short-Term Trend: Bullish
Medium-Term Outlook: Neutral to bullish – watch $3,357 breakout for confirmation
Main Bias: Buy the dip and hold toward resistance at $3,357–$3,372
Follow for more real-time trading strategies and insights. Save this post if you find it helpful!

Gold in Equilibrium, Possible Minor Pullback📊 Market Overview:
• Spot gold currently trades around 3,332–3,333 USD/oz
• A slightly weaker US dollar and declining Treasury yields are supporting gold
• Yet strong US jobs data and delayed Fed rate cuts are limiting gold’s upside
• Escalating trade tensions and new tariffs keep safe-haven demand intact
📉 Technical Analysis:
• Resistance: 3,345–3,350 USD, repeatedly tested zone
• Support: 3,316–3,322 USD, strong bottom near 3,310 USD
• EMA 9: Price hovering around it—no clear trend direction
• Momentum/RSI: RSI fading from overbought, momentum weakening
• Candle Patterns/Volume: Narrow consolidation, forming pennant structure
📌 Outlook:
Gold is likely to remain range-bound or dip slightly if USD strengthens. Conversely, renewed economic headwinds or Fed dovishness could push gold higher, especially on a break above 3,345 USD.
💡 Suggested Trade Strategy:
SELL XAU/USD : 3.347–3.350
🎯 TP: 40/80/200 pips
❌ SL: 3.355
BUY XAU/USD : 3.316–3.319
🎯 TP: 40/80/200 pips
❌ SL: 3.310

The weekend closed higher to around 3360
📌 Driving Events
Gold prices (XAU/USD) were on track to rise for the third consecutive day on Friday, climbing to the upper limit of this week's trading range as escalating trade tensions fueled safe-haven demand. Amid a significant intensification of global trade disputes, U.S. President Donald Trump this week sent formal notices to multiple trading partners detailing individual tariff rates that will take effect on August 1 if no agreement is reached. This has disrupted investor sentiment, weighed on risk assets, and provided solid support for gold.
Meanwhile, expectations of an imminent rate cut by the Federal Reserve (Fed) have cooled after last week's strong U.S. jobs data. As a result, the U.S. dollar (USD) remained firm, holding near more than two-week highs set on Thursday. A stronger dollar could limit upside for the non-yielding gold in the short term. Therefore, traders could look for a sustained breakout before going further bullish on the XAU/USD pair.
📊Personal comments:
Gold price broke through 3330, maintained good buying pressure, and rebounded over the weekend
⭐️Set gold price:
🔥Sell gold area: 3367-3369 SL 3374
TP1: $3355
TP2: $3342
TP3: $3325
🔥Buy gold area: $3306-$3308 SL $3301
TP1: $3315
TP2: $3325
TP3: $3338
⭐️ Note: Labaron hopes that traders can properly manage their funds
- Choose a lot size that matches your funds
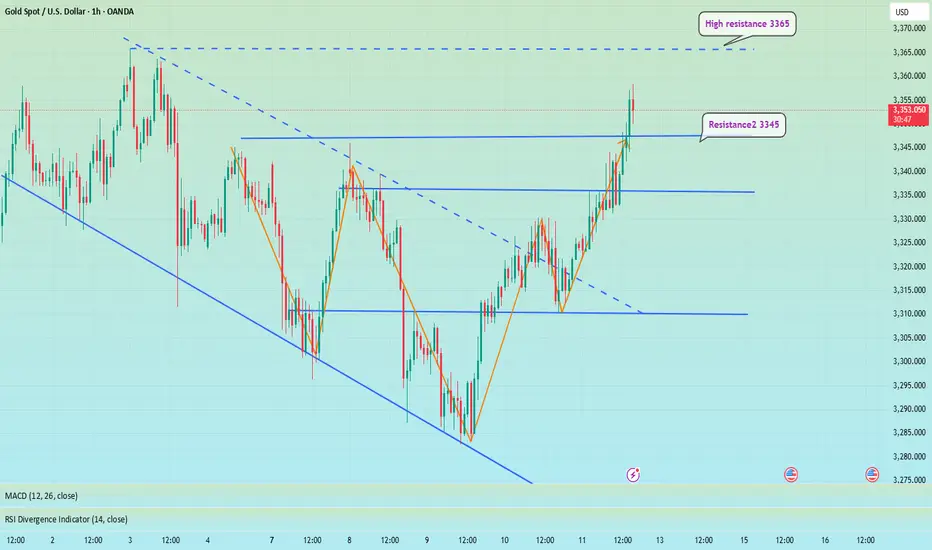
The price fell back. Watch out for a breakthrough.After reaching the resistance position near 3345 predicted by Quaid, the price fell back slightly, and the price fluctuated around 3335 so far.
From the hourly chart, before the price stabilizes at 3345, it is likely to maintain a range of 3330-3345. 3330-3345 is a temporary range. If it stands firm and breaks above 3345 again, the fluctuation range will become 3345-3360.
On the contrary, if it falls below 3330, the range may drop to 3320-3330. However, as long as the downward trend does not fall below 3320, gold will still maintain a bullish trend. If the price breaks down below 3320, today’s trend will be reversed.
As long as it is above 3320, gold will maintain a bullish trend today.
On the last trading day of this week, I wish all traders a good harvest.

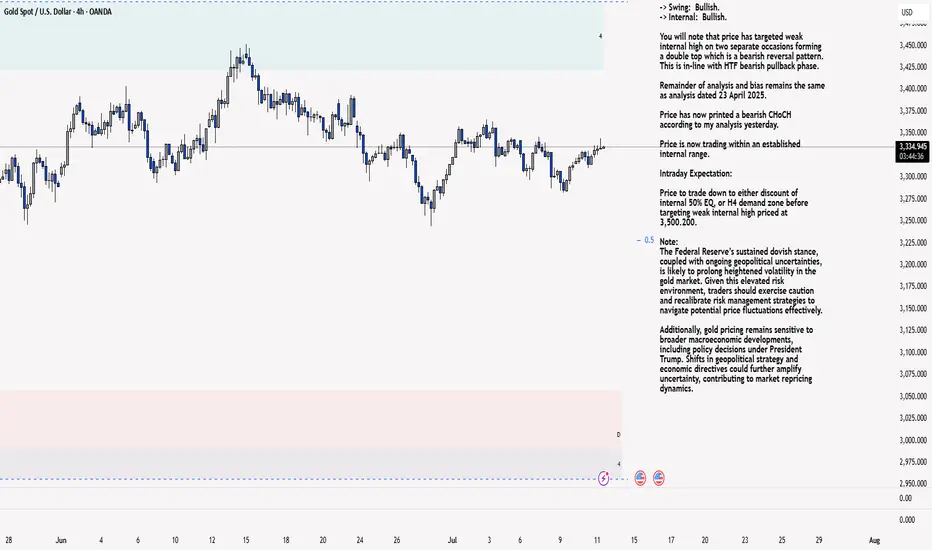
XAU/USD 11 June 2025 Intraday AnalysisH4 Analysis:
-> Swing: Bullish.
-> Internal: Bullish.
You will note that price has targeted weak internal high on two separate occasions forming a double top which is a bearish reversal pattern. This is in-line with HTF bearish pullback phase.
Remainder of analysis and bias remains the same as analysis dated 23 April 2025.
Price has now printed a bearish CHoCH according to my analysis yesterday.
Price is now trading within an established internal range.
Intraday Expectation:
Price to trade down to either discount of internal 50% EQ, or H4 demand zone before targeting weak internal high priced at 3,500.200.
Note:
The Federal Reserve’s sustained dovish stance, coupled with ongoing geopolitical uncertainties, is likely to prolong heightened volatility in the gold market. Given this elevated risk environment, traders should exercise caution and recalibrate risk management strategies to navigate potential price fluctuations effectively.
Additionally, gold pricing remains sensitive to broader macroeconomic developments, including policy decisions under President Trump. Shifts in geopolitical strategy and economic directives could further amplify uncertainty, contributing to market repricing dynamics.
H4 Chart:
M15 Analysis:
-> Swing: Bullish.
-> Internal: Bullish.
H4 Timeframe - Price has failed to target weak internal high, therefore, it would not be unrealistic if price printed a bearish iBOS.
The remainder of my analysis shall remain the same as analysis dated 13 June 2025, apart from target price.
As per my analysis dated 22 May 2025 whereby I mentioned price can be seen to be reacting at discount of 50% EQ on H4 timeframe, therefore, it is a viable alternative that price could potentially print a bullish iBOS on M15 timeframe despite internal structure being bearish.
Price has printed a bullish iBOS followed by a bearish CHoCH, which indicates, but does not confirm, bearish pullback phase initiation. I will however continue to monitor, with respect to depth of pullback.
Intraday Expectation:
Price to continue bearish, react at either M15 supply zone, or discount of 50% internal EQ before targeting weak internal high priced at 3,451.375.
Note:
Gold remains highly volatile amid the Federal Reserve's continued dovish stance, persistent and escalating geopolitical uncertainties. Traders should implement robust risk management strategies and remain vigilant, as price swings may become more pronounced in this elevated volatility environment.
Additionally, President Trump’s recent tariff announcements are expected to further amplify market turbulence, potentially triggering sharp price fluctuations and whipsaws.
M15 Chart:
Gold fluctuates, consolidation in the 3330-3310 range📰 News information:
1. Waller meeting on interest rate cuts
2. Trump tariff issues
📈 Technical Analysis:
Waller will participate in the meeting in more than two hours and pay attention to whether there is any news of interest rate cut. The key is to operate around the 3330-3310 range. Continue to pay attention to the support of 3310-3305 at night. If gold falls below 3310,-3305 again, the downward trend will continue, and it is expected to touch 3280 again, or even 3250. If it rebounds above 3330, it is likely to continue to rise.
In addition to investment, life also includes poetry, distant places, and Allen. Facing the market is actually facing yourself, correcting your shortcomings, facing your mistakes, and exercising strict self-discipline. I share free trading strategies and analysis ideas every day for reference by brothers. I hope my analysis can help you.
TVC:GOLD FXOPEN:XAUUSD FX:XAUUSD FOREXCOM:XAUUSD PEPPERSTONE:XAUUSD OANDA:XAUUSD

Go long when the trend reverses, beware of black swansYesterday's pullback to 3313-3310 confirmed the upward trend of gold. As I expected, it broke through the resistance of 3330 and touched around 3345. Currently, the short-term strong resistance is at 3345. Only by breaking through this resistance can gold maintain its upward trend. If it is blocked near the 3345 line in the short term, there is a possibility of a pullback. If 3345 breaks, there will be 3365 and 3400 above. Once the direction is clear, it will be easier to act. If there is a pullback during the day, it will give us a trading opportunity to enter the long position.
OANDA:XAUUSD

The real action begins around 3349–3352!🚨 Market Watch – Reversal Zone Ahead! 🚨
The market is moving up with strong momentum, eyeing the 3346 liquidity level, where buy-side orders are likely to be swept.
But the real action begins around 3349–3352 a key selling zone where institutional sellers may step in. This area could act as a major resistance, setting the stage for a potential reversal or pullback.
📉 If price shows signs of rejection here, it could be a smart opportunity for short setups. However, always stay sharp and let the price action guide your move.
📌 DYOR (Do Your Own Research)
⚠️ This is not financial advice just market insight. Trade responsibly.

Gold is fluctuating. Can it break through?Since the price of gold rose to 3500 on April 22 and encountered resistance and fell back, it has shown a triangular convergence and fluctuation trend so far. From the short-term trend, after the decline adjustment on Tuesday, it bottomed out and rebounded on Wednesday to close with a positive line, and on Thursday it completed the shock consolidation with a small positive line. The current moving average system is in an intertwined state, and the short-term market tends to fluctuate.
Today, we need to pay attention to the resistance of the 3340-3345 range. This position is a high point concentration area that has suppressed the upward movement of gold prices many times in the early stage. If the gold price breaks through this range, the bullish trend is expected to continue.
From the current trend, after the gold price bottomed out and rebounded, it formed a short-term support at 3310. Secondly, we need to pay attention to the support strength near the low point of 3282 on Tuesday. In terms of operation, it is still necessary to operate around the range.
Operation strategy:
Short when the price rebounds to around 3345, stop loss at 3355, profit range 3320-3300
Long when the price falls back to around 3310, stop loss at 3300, profit range 3320-3340

XAUUSD - 4H Bearish Rejection from Supply Zone | SMC AnalysisGold is showing signs of weakness after reacting strongly from a 4H Supply Zone around the 3331.72 level. Price tapped into the red supply zone, failed to break above, and is now forming lower highs — suggesting bearish momentum is building.
🔍 Key SMC Observations:
Supply Zone: Price rejected the 3331.72 level, which acted as a clear supply area based on past liquidity grabs and bearish institutional moves.
Change of Character (CHoCH): We saw a CHoCH around July 5th–6th, indicating a shift from bullish to bearish order flow.
Lower High Formation: Price failed to make a new high after tapping supply, showing signs of distribution.
Imbalance + Target Zone: Clean imbalance exists down to 3288.73 and potentially to the green demand zone around 3260–3270.
📍Trade Setup Idea:
Sell Opportunity: If price continues to reject the supply zone, look for bearish confirmation on the lower timeframes (e.g., 1H) to enter.
Target 1 (TP1): 3288.73 (near-term liquidity level)
Target 2 (TP2): 3260–3270 demand zone
Invalidation: A break and close above 3331.72 would invalidate the short-term bearish bias.
🔴 Watch for reaction around 3288.73 – if it holds, expect a possible bounce. If broken, further downside is likely.

Night range operation, technical outlook is still bearishGold fell as expected after repeated battles at 3330. Currently, gold has returned to around 3320. This shows that the rebound was mainly driven by short-term risk aversion. As market news calms down and sentiment stabilizes, the market will most likely return to the technical trend. If it unexpectedly breaks through 3330, it is expected to touch the 3345 line I mentioned this morning. The short-term 3310 line currently has certain support. From a technical point of view, I prefer to short. Once it falls below 3310, the subsequent support will move to 3295-3285. Therefore, I think it is a good choice to short again at 3320-3330.
OANDA:XAUUSD
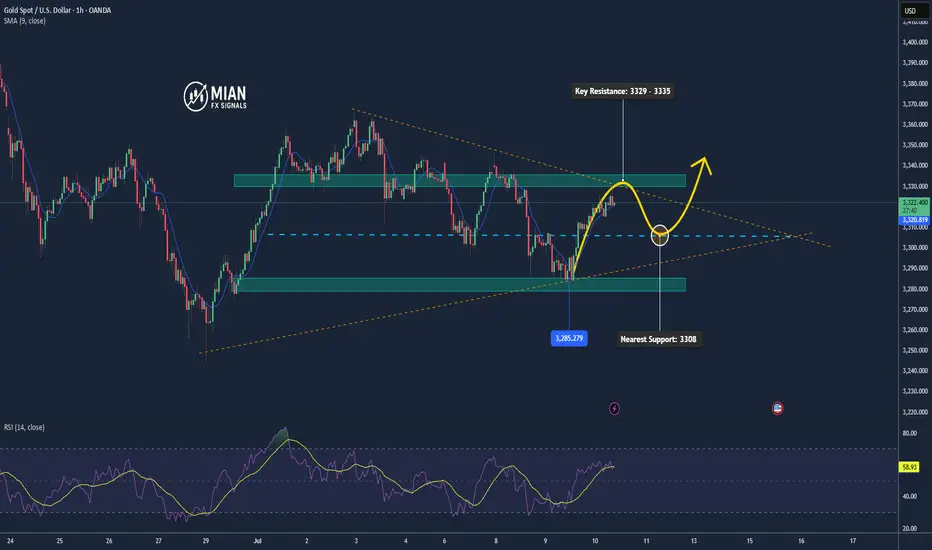
Gold Rejected at 3329.5, Profit-Taking Pressure Rises📊 Market Overview:
Gold surged to 3329.5, approaching key resistance, but quickly dropped to 3319.8 due to strong selling pressure, signaling short-term profit-taking. It’s now slightly recovering and trading around 3321.
📉 Technical Analysis:
• Key Resistance: 3329 – 3335
• Nearest Support: 3308 – 3285
• EMA 09: Price remains above EMA 09 → uptrend still intact.
• Candlestick / Volume / Momentum: H1 candle shows long upper wick at resistance. High volume at the top suggests profit-taking activity.
📌 Outlook:
Gold may continue a short-term correction if it fails to break above 3330 decisively. Bulls need to hold 3308 to maintain the upward structure.
💡 Suggested Trading Strategy:
🔻 SELL XAU/USD : 3330 – 3333
🎯 TP: 40/80/200 pips
❌ SL: 3336
🔺 BUY XAU/USD at: 3302 – 3305
🎯 TP: 40/80/200 pips
❌ SL: 3399
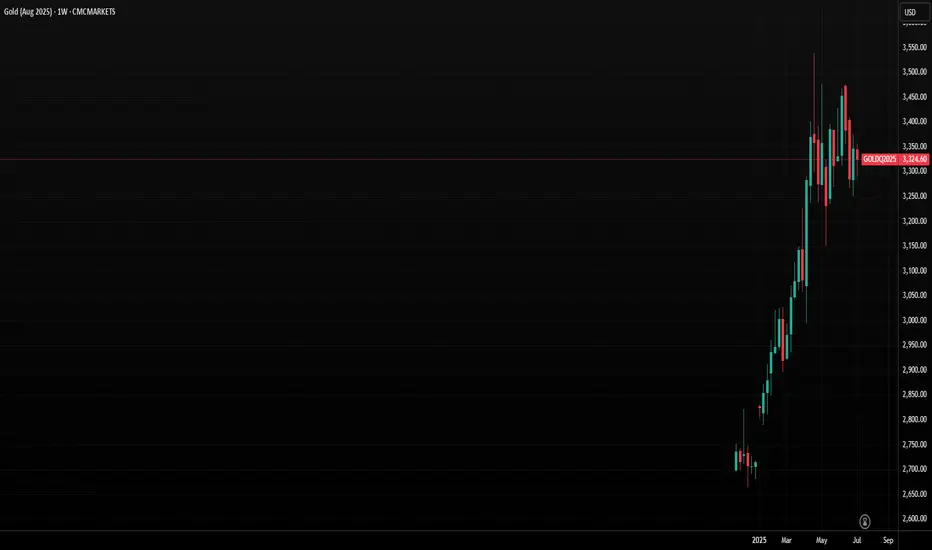
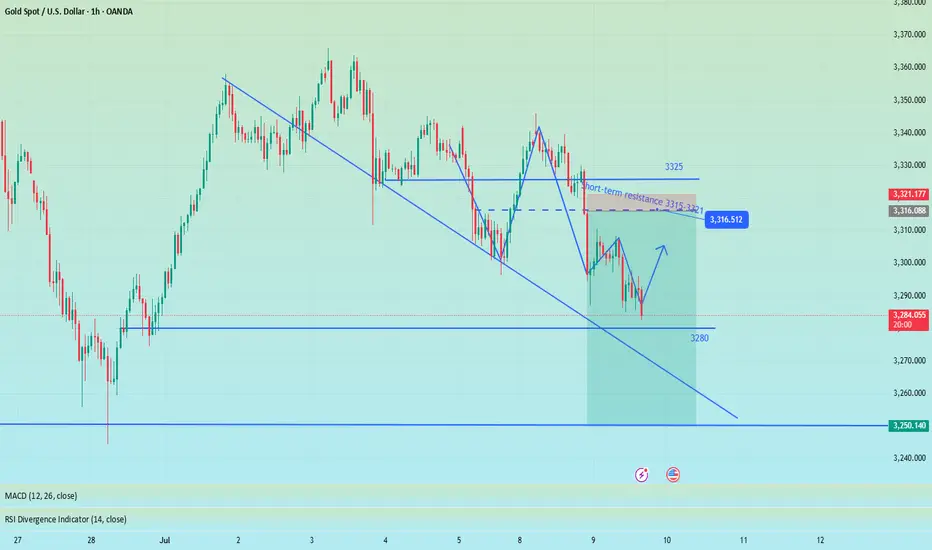
Gold at Critical Juncture as Bearish Momentum GrowsGold is showing signs of breaking down as the US dollar recovers from a steep decline. Gold and the dollar typically have an inverse relationship over the longer term. The precious metal has been trading sideways since April, but more importantly, it has been trending lower since mid-June. Gold is now approaching a critical juncture, testing an uptrend established in mid-May. Although it has previously held this support level, gold appears likely to break lower this time.
The Trend Lower Is Strengthening
The Relative Strength Index (RSI) is now trending steadily lower, forming a series of lower highs. This suggests that gold’s momentum is currently bearish, indicating potential for continued weakness in the days ahead. To reverse this bearish momentum and shift to a bullish outlook, the RSI would need to rise firmly above 50.
More significantly, gold is now very close to breaking a significant uptrend at $3,300, which was previously tested on June 27 and June 30. On both occasions, the price dipped intraday below this trendline but managed to close above it. The trendline was retested on 8 July, initially holding, but gold is dipping below this critical support level again on 9 July. A close below the trendline on July 9, followed by continued declines starting on July 10, would confirm that the uptrend has broken. This breakdown would signal further downside risk, with initial support at $3,230, followed by $3,170.
Triple Top
Perhaps even more crucially, a triple-top pattern established at the $3,400 becomes increasingly likely each time gold trends lower. The $3,170 support level is particularly significant because it forms the neckline of this triple-top pattern. A decisive break below $3,170 would confirm the triple top pattern and indicate a deeper decline, potentially targeting the range between $2,950 and $3,000.
Written by Michael J. Kramer, founder of Mott Capital Management.
Disclaimer: CMC Markets is an execution-only service provider. The material (whether or not it states any opinions) is for general information purposes only and does not take into account your personal circumstances or objectives. Nothing in this material is (or should be considered to be) financial, investment or other advice on which reliance should be placed.
No opinion given in the material constitutes a recommendation by CMC Markets or the author that any particular investment, security, transaction, or investment strategy is suitable for any specific person. The material has not been prepared in accordance with legal requirements designed to promote the independence of investment research. Although we are not specifically prevented from dealing before providing this material, we do not seek to take advantage of the material prior to its dissemination.
Bearish is still the main trend, first test 3250 supportYesterday, as the market expected a trade agreement to be reached between the US and its trading partners, risk sentiment was boosted. The strengthening of DXY and the rise in US Treasury yields put some pressure on gold.
On Monday, gold rebounded to 3320, and on Tuesday it touched above 3320 and began to fall sharply. In the short term, 3320 is a key trading position that we need to pay attention to. From the daily chart, the support line of 3320 has been completely broken, and the two major support points below are 3250 and 3200 respectively. Judging from the 4H chart, the decline may have just begun. Next, we may first face a test of the 3250 support line. If the 3250 support can be maintained, gold will maintain a volatile consolidation in the short term. Otherwise, if it falls below 3250, it will test the 3200 mark.
OANDA:XAUUSD
Gold fluctuates, continue to short at 3345 during the dayTrump's trade policy continues to stimulate risk aversion. Although the Federal Reserve's meeting minutes are neutral, they can potentially provide support for gold. Yesterday we gave the short positions of 3321 and 3333, which have generated profits so far. At the same time, it should be noted that the 4H MACD indicator has the potential demand to form a golden cross. In the short term, there is a certain suppression force at 3330-3335. If the Asian and European sessions repeatedly test this position but fail to break through effectively, you can go short without hesitation. If you want to go short again during the day, you can consider 3340-3345 and defend 3350. The lower 3310-3305 is a relatively strong support area during the day. If the Asian session retreats to this point, you can consider going long, with the target looking at 3330-3335.
OANDA:XAUUSD