The decline in gold prices has not stopped. Do you know what to
Gold did not provide a better position to go long during the day, but continued to fluctuate, and was under pressure at 3330 many times. The short-term suppression was obvious, and the increase was limited. It is expected to usher in a decline today. Consider short-term short operations, pay attention to shorts near 3326, stop loss at 3334, and take profit at 3300. Pay attention to risks.
Short-term trading of gold in the evening of July 10: shorts near 3326, stop loss at 3334, take profit at 3306
Goldprice

Gold continues to short
Life is like a thread. As long as today continues and as long as there is hope for tomorrow, we will always be at the starting point and on the road to running. Don't be afraid of the long road, don't complain about the lack of scenery on the roadside, don't despair at any time, just keep running, the bumps under your feet are the cornerstones of our life, and perhaps the turning point is just around the next corner!
Gold, on the eve of the US market yesterday, the shorts repeatedly touched the lower support of 3282, but ultimately lacked the momentum to make a final push, which led to a reverse reversal in the US market and a continuous rebound effect. As of the morning of the day, the highest reached near 3326, and the daily line also closed at the bald small positive line of the lower lead. The current upper pressure is maintained at the previous 3330 line. This position will also be related to the continuity of the long and short positions in the later period, and the highest in the morning will also be maintained near this position. For the European market, this position is even more important. Once it continues to break through, the US market will likely continue to rise, and it can also be used as the position of the long and short watershed in the short term, and the recent trend continuity is extremely high. , most of them are maintained in the range of shock operation, and the support below will be maintained at 3310, which is also the key defensive point of the European session. Although the daily line is currently closed at a small positive line, it is still obviously insufficient in power, and the multi-hour line is also maintained in the downward channel without a breakthrough. In the short term, it is still in a bearish situation overall. If there is no breakthrough for a long time, it may continue to fall in the later period. If gold rebounds near the morning high, it can continue to short. If the European session breaks through strongly, it needs to adjust its direction before the US session. If gold rebounds near 3325-26, it can be shorted. The target is around 3310-00, and the loss is 3335!
Gold rebounds near 3325-26 during the day, and the target is around 3310-00, and the loss is 3335.

XAUUSD Loses Short-Term Support – Deeper Decline May FollowAt the current moment, gold (XAUUSD) has made a significant breakout, surpassing the key resistance zone at 3,326 USD and is now trading around 3,328.94 USD. This breakout confirms that the short-term bullish trend remains strong.
1. Short-Term Trend: Bullish Momentum Expands
After holding the key support zone around 3,311 – 3,315 USD (aligned with the 0.618 Fibonacci retracement), XAUUSD bounced back and broke above the previous high at 3,326 USD. The current uptrend is confirmed by higher lows and a clear breakout candle from the recent consolidation.
2. Updated Support and Resistance Zones:
Immediate Support: 3,318 – 3,320 USD, near the rising yellow trendline and breakout retest zone.
Next Resistance Target: No clear barrier on the 15-min chart, but psychological levels and Fibonacci extensions suggest 3,332 – 3,335 USD could act as the next upside targets.
3. Price Action Highlights:
The breakout candle closed strongly above the 3.618 Fibonacci extension level (3,326.26 USD), showing solid buying pressure.
A bullish signal ("B") from LuxAlgo was triggered near the minor pullback at 3,318 USD, adding further confirmation.
4. Key Technical Signals:
Price has broken out of the purple rectangle consolidation zone, expanding its trading range.
The 0.618 Fibonacci level at 3,311.78 USD continues to act as firm support.
The ascending yellow trendline remains intact, providing dynamic support to the bullish trend.
5. Suggested Trading Strategy:
Buy on Pullback: Consider long positions around 3,318 – 3,320 USD if price retests this zone with bullish confirmation.
Breakout Continuation Buy: A firm close above 3,330 USD with high volume could signal a move toward 3,335 – 3,340 USD.
If price falls below 3,315 USD and closes weakly, the bullish momentum may begin to fade.
XAUUSD is in an extended bullish phase after breaching the 3,326 USD resistance. As long as price holds above the 3,318 – 3,320 USD zone, there is room for the uptrend to continue.
Do you think gold will break above 3,330 USD? Drop your thoughts in the comments and let’s discuss trading strategies together!

XAUUSD Idea: 4H Trendline First Breakout - Liquidity PlayFOREXCOM:XAUUSD
🔍 Analysis Overview:
Price has just broken above a 4H descending trendline for the first time. However, I remain cautious due to the following key observations:
📌 NOTES:
The broader market sentiment is still bearish due to recent tariff-related news, which often fuels risk-off behavior.
Historically, the first breakout of a strong trendline often fails, trapping early buyers.
This breakout is likely attracting buy-side liquidity, giving institutions an opportunity to hunt stops.
My observation shows buying interest started around the 3308–3313 range, suggesting smart money accumulation and a possible trap.
📉 I'm watching for a fake breakout and potential reversal targeting the liquidity zones marked below around 3307 and possibly lower.
The liquidity sweep below equal lows could offer a better risk-reward setup.
💡 Conclusion:
If price fails to hold above this breakout and shows signs of rejection, I will be anticipating a return towards the previous demand zone for a liquidity grab.
#XAUUSD #GoldAnalysis #SmartMoneyConcepts #LiquidityGrab #ForexTrading #TrendlineBreak #MarketPsychology #TradingSetup #SMC #PriceAction

Trump blasted Powell again. Interest rates remain unchanged.Information summary:
Trump blasted Powell on Wednesday, saying that the current interest rate is "at least 3 percentage points higher" and once again accused Fed Chairman Powell of "making the United States pay an extra $360 billion in refinancing costs each year." He also said that "there is no inflation" and that companies "are pouring into the United States," and urged the Fed to "cut interest rates."
During the U.S. trading session, gold also showed a significant rebound momentum, rebounding from a low of 3285 to above 3310 in one fell swoop. As of now, gold has stood above 3320.
Market analysis:
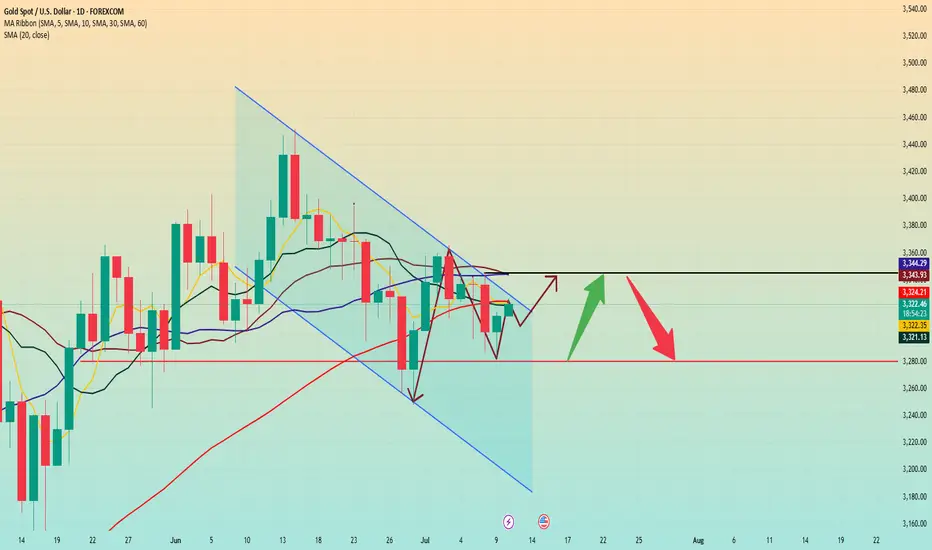
From the daily chart:
It can be seen that the first suppression position above gold is currently at 3325, followed by around 3345. Gold did not close above 3320 on Wednesday, which means that even if gold is currently above 3320, as long as today's daily line closes below 3320, it is still in a bearish trend. On the contrary, if the closing price today is above 3320, then the subsequent test of the suppression position near 3345 may be further carried out.
Secondly, from the 4-hour chart, the current suppression position above 4 hours is around 3330-3335. Therefore, today we should focus on this position. If we cannot stand firm and break through the range suppression here in the 4-hour chart, we may retreat again in the future. The key support position below is around 3310, which is the opening price today. If the price is to retreat, it is likely to fall below 3310. But it may also remain above 3310 for consolidation.
However, as long as it falls below 3310, I think the low point near 3285 may be refreshed, so pay attention to this.
Operation strategy:
Steady trading waits for 3310 to fall and break through to short, and the profit range is 3385 or even lower.
Aggressive trading can short near 3340, with a stop loss of 3350.

Gold Rebounds from 3283, Eyes 3315 Resistance📊 Market Overview:
• Gold dropped sharply to a low of $3283 earlier today before rebounding strongly back to around $3312, supported by renewed buying interest.
• The recovery is fueled by risk-off sentiment amid ongoing trade negotiation uncertainty and a mild pullback in the U.S. Dollar Index.
• Central bank buying continues to underpin gold’s base, despite mild pressure from rising U.S. bond yields.
________________________________________
📉 Technical Analysis:
• Key Resistance: $3315 – $3335
• Nearest Support: $3280
• EMA 09: Price is trading above the 9-period EMA, signaling a short-term bullish trend.
• Candle pattern / Momentum: A strong bullish engulfing candle formed after bouncing from $3283 on the H1 chart. MACD is crossing upward, and RSI is approaching the 60 level, suggesting bullish momentum.
________________________________________
📌 Outlook:
Gold may continue to recover in the short term if it holds above the $3300 level and successfully breaks through $3315 resistance. However, failure to break above this resistance could lead to a short-term pullback toward $3290–$3280.
________________________________________
💡 Suggested Trading Strategy:
🔻 SELL XAU/USD at: $3315–3325
🎯 TP: $3295
❌ SL: $3330
🔺 BUY XAU/USD at: $3285–3295
🎯 TP: $3315
❌ SL: $3280

Gold (XAUUSD) Trade Setup – Valid Until July 10, 2025This 15-minute chart shows a clean technical breakout from a falling channel. Here's how to interpret and potentially trade this move:
🧠 Context: What Just Happened
Price was locked inside a descending channel (blue) for multiple sessions.
A breakout occurred above the channel, indicating a potential short-term bullish reversal.
The bounce aligns with recent tariff-related headlines easing off and short-covering momentum building.
I trade these support and resistance lines daily on micro gold futures.
What these lines represent:
Golden Line: Heavy Support or Resistance depending on the price direction towards the lines for major reversal or $10-$15 swings.
Silver Lines: Consolidation areas or mid way support and resistance for a scalping few touches.
Bronze dotted lines: Low volume days support and resistance for a quick $5 up or down.
Also, I can see a directional setup. Here is a hypothetical scenario that could play out:
📌 Key Zones to Watch
🔼 Resistance $3,342 Next major target / sell zone
🟧 Resistance $3,319 Current breakout level retest
⚪ Support $3,307–$3,316 Minor consolidation area
🔻 Support $3,295–$3,289 Strong demand / invalidation
🚨 Bear Pivot $3,272 Break below = bearish return
🧭 Trading Playbook
Bullish Bias (Preferred Scenario)
✅ Break and hold above $3,319 = potential move to $3,342
🎯 Target: $3,340–$3,342
🔒 SL below: $3,307
Optional re-entry on retest of $3,316 zone
Bearish Reversal (If Bulls Fail)
⚠️ If price fails $3,319 and breaks back below $3,307, sellers may reclaim control
📉 Look for short setups toward $3,295 and even $3,272
SL above: $3,319
📌 Key Tip
Watch for volume confirmation and 5m candle closes at each level. Don’t chase — let price come to your levels.
⏳ Validity
This setup remains valid through July 10, or until $3,342 target is hit or $3,272 is broken.
This is not financial advice; it's for educational purposes only.

Gold rose. Trend reversed.Gold rose slightly in early Asian trading on Wednesday, but fell under pressure near 3308. It fluctuated in the European trading range of 3296-3282. It broke through the US trading range and rose to around 3317 in the late trading. The daily line closed with a positive line with a lower shadow.
After a sharp drop on Tuesday, gold showed a downward recovery trend on Wednesday and closed positive. It rose slightly in early Asian trading today. From the daily level, in the short term, we should first pay attention to the resistance near 3325-3330. This area brings together the current positions of the 5-day moving average, the 10-day moving average and the 60-day moving average, which is an important gateway for the game between long and short forces in the short term. If the gold price continues to be under pressure in this area, it means that the short-term upward momentum is insufficient, and we need to be alert to the risk of a market decline.
If the above resistance area can be broken and the price continues to rise strongly, the next target will be the resistance near 3345, which is not only the high point on Tuesday, but also the current location of the 20-day moving average and the 30-day moving average, which has a strong technical resistance significance.
In terms of support below, first pay attention to the support near 3280, which is the current support level of the trend line formed by the low points of May 15 and June 30, which provides certain support for the gold price.
Operation strategy:
Short at price rebound near 3345, stop loss at 3355, profit range 3320-3300
Long at price drop near 3315, stop loss at 3305, profit range 3320-3340
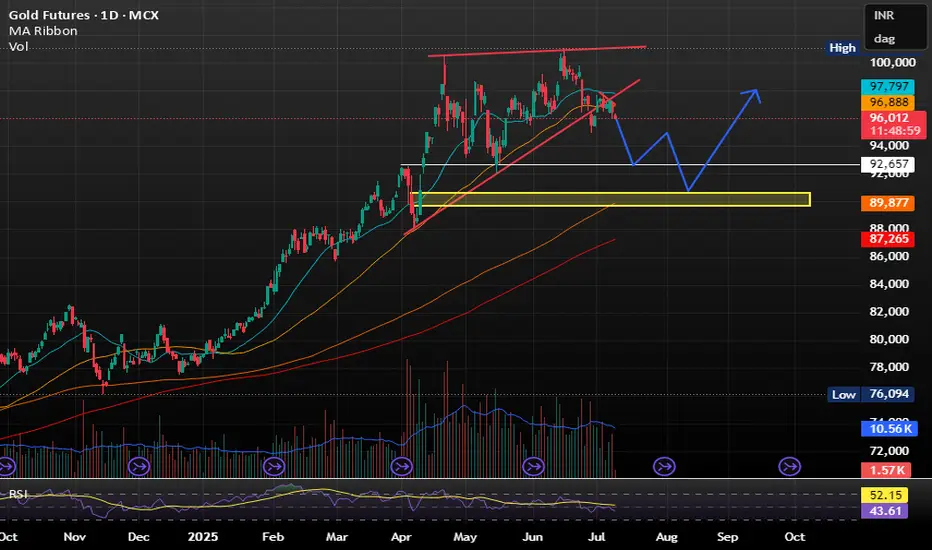
Gold MCX Bullish MoveGold as long as it is staying above the ichimoku cloud it can show a bullish move from here within a few days.. this month we can expect some movement on the upside clearing highs.
Stop loss can be kept near 94700-95300 levels with target of 102000 - 105000 with this month.

Gold Drops to 3,284 – Short-Term Support at Risk📊 Market Overview
Gold fell sharply this morning to $3,284/oz amid a modest USD rebound and profit-taking pressure following several range-bound sessions. The lack of fresh catalysts also contributed to weaker momentum.
📉 Technical Analysis
• Key Resistance: 3,315 – 3,330
• Nearest Support: 3,280 – 3,275
• EMA 09: Price is currently trading below the EMA 09 on both the H1 and H4 timeframes → short-term bearish signal
• Candle Patterns & Momentum:
– H1 candle shows a bearish engulfing pattern near the 3,305 area → confirms downward pressure
– RSI is below 45, MACD has crossed below its signal line → bearish momentum dominant
– If the 3,275 level is breached, gold could continue to fall toward 3,260
📌 Outlook
Gold is leaning toward further downside unless it can hold above the 3,280 support level during today’s session.
💡 Trade Strategy
🔻 SELL XAU/USD at: 3,295 – 3,398
🎯 TP: 40/80/200 PIPS
❌ SL: 3,305
🔺 BUY XAU/USD at: 3,275 – 3,278
🎯 TP: 40/80/200 PIPS
❌ SL: 3,269

7.9 Latest gold trend analysis and operation layout📰 News information:
1. Federal Reserve meeting minutes
📈 Technical Analysis:
Our decision to close our positions at 3305 yesterday was undoubtedly a very strategic one. After reaching a high of around 3310 last night, it began to fall. At the same time, I also gave VIP members the news that it might fall back to around 3300. Since the opening, the lowest point has reached around 3285. The overall trend is still under our control.
At present, gold will still usher in technical corrections in the short term. The current price of 3293-3290 support can be considered for long positions. If the European session continues to fall below the low, you can try to go short during the NY session. If the European session continues to maintain sideways consolidation, you can consider retreating and going long during the NY session. As long as the key support of 3250 below is held, gold will maintain its consolidation trend in short-term trading. On the contrary, once it falls below 3250, gold may directly touch the 3200 mark. Focus on the minutes of the Federal Reserve meeting, which may further influence the trend of gold.
🎯 Trading Points:
BUY 3293-3290-3285
TP 3305-3310-3320
In addition to investment, life also includes poetry, distant places, and Allen. Facing the market is actually facing yourself, correcting your shortcomings, facing your mistakes, and exercising strict self-discipline. I share free trading strategies and analysis ideas every day for reference by brothers. I hope my analysis can help you.

Don’t chase shorts when gold is at a low level, wait for a rebou
From the 4-hour analysis, today's upper short-term resistance focuses on the hourly top and bottom conversion position near 3318-24. The intraday rebound relies on this position to go short once and look down. The lower short-term support focuses on the vicinity of 3280. The overall support relies on the 3280-3325 area to maintain the main tone of high-altitude low-multiple cycles. In the middle position, watch more and move less, and follow orders cautiously, and wait patiently for key points to enter the market.
Gold operation strategy:
Gold 3285-3287 line long, stop loss 3277, target 3315-23 line, break and continue to hold

Data is about to be released. Where will gold go?Yesterday, the market expected a trade agreement between the United States and its trading partners, which boosted risk sentiment, and the strengthening of the US dollar and the rise in US bond yields further added pressure on gold prices. Gold fell 1% during the day and once lost the $3,300 mark during the session.
After gold bottomed out and stabilized at 3,320 on Monday, it fell sharply above 3,320 again on Tuesday and has now completely fallen below 3,320. The position of 3,320 is very important. In the 3,320-50 range, it chose to break down at 3,320 again.
Today, the Federal Open Market Committee of the United States will release the minutes of the June monetary policy meeting. Although Federal Reserve Chairman Powell remained neutral on the June interest rate decision, many Federal Reserve officials released dovish signals. Federal Reserve Board member Bowerman has turned to support the possibility of a rate cut in July.
From a technical point of view, the market has penetrated into the area around the lower support of 3,275-3,295.
The rhythm of the entire market is still a process of oscillating decline. From the perspective of pressure position, the daily MA5 average line has not fallen below, and may fall again to around 3270. Once the market falls too fast and approaches this position, there is a high probability that there will be a rebound demand.
Operation strategy:
Buy near 3375, stop loss at 3365, profit range 3315-3320.
Continue to hold position after breakthrough.

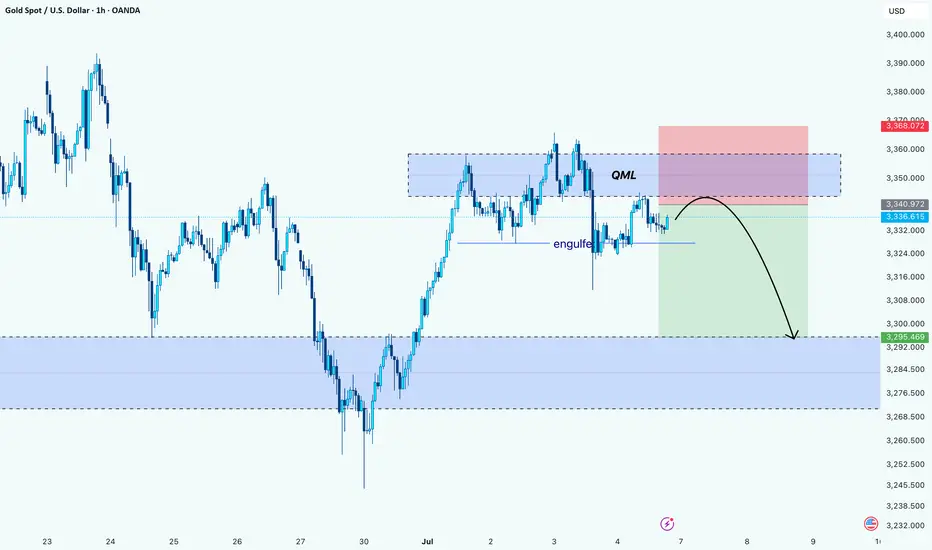
Gold’s Trap Above QML: Bearish Play UnfoldingHello Guys!
Gold appears to be forming a textbook Quasimodo reversal setup after printing a lower high into a key supply zone. Price aggressively tapped into the QML area (around 3,350–3,360), where sellers previously stepped in, and we’re now seeing signs of rejection.
The engulf zone marked earlier confirms bearish intent. It broke structure and flipped momentum. Price is currently retesting below that engulf level, likely as a last attempt to grab liquidity before heading down.
The projected move suggests a drop toward the next significant demand zone around 3,295–3,285, where the price previously found a strong bullish reaction.
Bias: Bearish below QML
Target: 3,295 zone
Invalidation: Above 3,368 (high of supply zone)
Gold (XAU/USD): Playbook in ActionHello guys!
We’ve seen a textbook QML (Quasimodo Level) setup play out beautifully on gold. Price pushed into a key supply zone and formed a QML structure, followed by a clean engulfing of the previous demand. confirming smart money involvement. As expected, the target of that QML has now been hit, tapping into the major demand zone below.
After the deep sweep and reaction from demand, price retraced upward into a potential lower high area. Based on structure and liquidity dynamics, two potential scenarios are in play:
We’re executing a two-step plan here:
Step 1: Short position from the QML + supply area, aiming for the next blue demand zone. Liquidity has been taken above the high, confirming the setup.
If we get a clean reaction near the blue area, that’s our signal to flip long. We expect a pullback toward $3310 area.

XAU/USD 09 July 2025 Intraday AnalysisH4 Analysis:
-> Swing: Bullish.
-> Internal: Bullish.
You will note that price has targeted weak internal high on two separate occasions forming a double top which is a bearish reversal pattern. This is in-line with HTF bearish pullback phase.
Remainder of analysis and bias remains the same as analysis dated 23 April 2025.
Price has now printed a bearish CHoCH according to my analysis yesterday.
Price is now trading within an established internal range.
Intraday Expectation:
Price to trade down to either discount of internal 50% EQ, or H4 demand zone before targeting weak internal high priced at 3,500.200.
Note:
The Federal Reserve’s sustained dovish stance, coupled with ongoing geopolitical uncertainties, is likely to prolong heightened volatility in the gold market. Given this elevated risk environment, traders should exercise caution and recalibrate risk management strategies to navigate potential price fluctuations effectively.
Additionally, gold pricing remains sensitive to broader macroeconomic developments, including policy decisions under President Trump. Shifts in geopolitical strategy and economic directives could further amplify uncertainty, contributing to market repricing dynamics.
H4 Chart:
M15 Analysis:
-> Swing: Bullish.
-> Internal: Bullish.
H4 Timeframe - Price has failed to target weak internal high, therefore, it would not be unrealistic if price printed a bearish iBOS.
The remainder of my analysis shall remain the same as analysis dated 13 June 2025, apart from target price.
As per my analysis dated 22 May 2025 whereby I mentioned price can be seen to be reacting at discount of 50% EQ on H4 timeframe, therefore, it is a viable alternative that price could potentially print a bullish iBOS on M15 timeframe despite internal structure being bearish.
Price has printed a bullish iBOS followed by a bearish CHoCH, which indicates, but does not confirm, bearish pullback phase initiation. I will however continue to monitor, with respect to depth of pullback.
Intraday Expectation:
Price to continue bearish, react at either M15 supply zone, or discount of 50% internal EQ before targeting weak internal high priced at 3,451.375.
Note:
Gold remains highly volatile amid the Federal Reserve's continued dovish stance, persistent and escalating geopolitical uncertainties. Traders should implement robust risk management strategies and remain vigilant, as price swings may become more pronounced in this elevated volatility environment.
Additionally, President Trump’s recent tariff announcements are expected to further amplify market turbulence, potentially triggering sharp price fluctuations and whipsaws.
M15 Chart:

GOLD IS MELTING LIKE A ICEGOLD IS MELTING LIKE A ICE -
Trading below 20SMA and 50SMA making it less attractive at current price level.
ALSO RELATIVE STRENGH IS WEAKNING .
As per my view Sell on rise will be profitable for short term .
DOWNSIDE TARGET SHOULD BE WITHIN 92000 TO 90000 .
(XAU/USD) 3H Chart – Bearish Reversal Setup from Resistance Zon1. Entry Point (Sell):
Marked at 3,335.03
This is a key resistance level where price is expected to reverse downward.
2. Stop Loss:
Placed above at 3,354.88
This acts as a protection level in case the trade goes against the direction.
3. Take Profit Targets (EA Target Points):
TP1 (Downside): 3,245.65
TP2 (Upside - if Stop Loss is hit): 3,455.76 (in case of reversal or long position)
4. Price Action Observation:
Price is currently around 3,320.56, climbing back toward the entry zone.
The red 50-period moving average (EMA) and blue 200-period MA show convergence, often preceding volatility.
---
📉 Bearish Scenario (Main Setup)
Sell Bias is expected from the 3,335 region.
If price respects the resistance zone and breaks down again, the target is 3,245.65, yielding approximately 90-point move.
This is a risk-reward favorable setup, with:
Risk: ~20 points
Reward: ~90 points
RRR ≈ 1:4.5
---
⚠️ Bullish Invalidity (Stop Loss Hit)
If the price breaks and closes above 3,354.88, it invalidates the bearish setup.
Then, the market may shift towards targeting 3,455.76 — about 100 points to the upside.
---
🔧 Technical Factors Supporting the Setup
Supply zone marked by the purple box around the entry.
Trend previously bearish — recent upward move may just be a retracement.
Confluence with MAs: Price is testing MAs — rejection here would add bearish confirmation.
---
✅ Summary of Trade Setup
Element Value
Entry 3,335.03
Stop Loss 3,354.88
Take Profit 3,245.65
Alt Target 3,455.76 (if SL hit)
Risk-Reward ~1:4.5
Bias Bearish (Sell Setup)

Gold fell under pressure, and the watershed is 3321.
⭐️Gold Information:
During the Asian session on Wednesday, gold prices (XAU/USD) continued to be under pressure, falling below the $3,300 mark, hitting the lowest point in more than a week. The decline in gold prices comes as the market generally believes that the Federal Reserve (Fed) will maintain high interest rates for a longer period of time, especially as the market expects that tough U.S. tariffs may exacerbate inflation in the coming months.
Such expectations have pushed up U.S. Treasury yields and stabilized the U.S. dollar (USD) near a two-week high hit on Tuesday - a key resistance for the non-yielding precious metal, which continues to face downward pressure.
⭐️Personal comments:
Gold price fell below support, Dow Jones H1 pattern, gold price fell below 3300
⭐️Set gold price:
🔥Sell gold area: 3344-3446 SL 3351
TP1: $3335
TP2: $3320
TP3: $3302
🔥Buy gold area: $3256-$3254 SL $3249
TP1: $3268
TP2: $3280
TP3: $3298
⭐️Technical analysis:
Set reasonable sell orders based on technical indicators EMA 34, EMA89 and support and resistance areas.

XAU/USD) bearish Trand analysis Read The captionSMC trading point update
Technical analysis of (XAU/USD) on the 3-hour timeframe, projecting further downside after rejection from a resistance zone aligned with a descending trendline.
---
Analysis Summary
Trend Bias: Bearish
Current Price: ~$3,301.96
Structure: Price is respecting a descending channel, with multiple rejections from the upper boundary and key resistance zone.
---
Key Technical Insights
1. Resistance Zone & Downtrend Line:
Price was rejected from a resistance block near the EMA 200 (~$3,331) and descending trendline.
This level has repeatedly triggered strong downside moves (highlighted with red arrows).
2. EMA 200 Reaction:
The EMA 200 at $3,331.10 is acting as dynamic resistance.
Each time price reaches or crosses above this line, selling pressure increases.
3. Bearish Price Projection:
After recent rejection, the chart anticipates a pullback to the support zone between $3,248.26 and $3,245.71.
A deeper drop toward $3,159.13 is projected as a next major target, consistent with previous price moves.
4. RSI Indicator:
RSI at 40.24 suggests bearish momentum is still in play but not yet oversold—indicating room for more downside.
---
Bearish Trade Idea
Element Level / Description
Entry Zone Below resistance: $3,310–$3,320
Target 1 $3,248.26–$3,245.71 (support zone)
Target 2 $3,159.13 (channel base / next support)
Stop-Loss Above $3,335 (above resistance zone)
---
Risk Considerations
Fundamental catalysts: Gold is sensitive to USD strength, interest rate decisions, and macroeconomic data.
Invalidation: A strong breakout and close above the descending trendline and EMA 200 would negate the bearish outlook.
---
Summary
This analysis outlines a bearish setup for XAU/USD, supported by trendline resistance, EMA rejection, and RSI momentum. If current structure holds, a move toward the $3,245 and $3,159 levels is likely.
Please support boost 🚀 this analysis)

Gold shocks and alternating long and short ideas
💡Message Strategy
As we mentioned before, the upper 3345-50 is the suppression position after the non-agricultural data last week. We can short at the 45-50 line when it rebounds. Yesterday, we also gave the idea of going long at the 3295-3301 line. At midnight, gold rebounded perfectly above the 3330 line and closed at the 3336 line.
Today we continue to pay attention to the short-term suppression of the 3345-50 line. If the rebound does not break, we will intervene in the short order. After all, the technical side needs to be adjusted and repaired during the day. We try to grasp the good entry position for operation. If your current gold operation is not ideal, welcome to communicate!
📊Technical aspects
From the 1-hour analysis, the short-term support of 3290-3295 is concerned below, the short-term resistance above is concerned about the 3345-50 line, and the suppression of 3365-70 is focused on. The overall main tone of high-altitude low-multiple cycle participation remains unchanged. In the middle position, watch more and do less, and follow orders cautiously, and maintain the main tone of participation in the trend. Wait patiently for key points to participate. Pay attention to the specific operation strategy in time.
💰Strategy Package
Long Position:3290-3300,SL:3275,Target: 3320-3340

Gold Setup for longs and shorts This video covers gold on the local range whereby I expect price to eventually complete the move to the downside and clear the equal lows from MAy and June as well as take care of the poor lows and fill Quart Pivots .
I talk also about the Tradingview session volume profile chart and how this feature can really be a simple yet powerful guide for taking scalp trades off of specific levels and I show a couple of examples of the respect PA has for hitting those daily POC .
I Welcome any questions you may have

Gold Returns to the $3,300 per Ounce ZoneOver the past two trading sessions, gold has depreciated more than 1.5%, as a consistent bearish bias begins to emerge in price action. For now, selling pressure has remained steady, supported by a temporary decline in global economic uncertainty and a recent rebound in U.S. dollar strength, factors that have led gold’s upward momentum to steadily weaken.
Lateral Range Remains Intact
Recent price action in gold has defined a well-established sideways channel, with resistance near $3,400 and support around $3,200 per ounce. So far, price movement has been insufficient to break out of this range, making it the most relevant technical structure to monitor in the short term. As long as price remains within these boundaries, neutrality may continue to dominate.
Technical Indicators
MACD: The MACD indicator continues to oscillate near the neutral zero line, signaling that momentum from moving averages remains balanced. If this pattern persists, the sideways range could extend further.
RSI: A similar pattern is unfolding with the RSI, which is hovering around the 50 level, indicating a constant balance between buying and selling pressure. Sustained moves at this level could reinforce short-term price neutrality.
Key Levels to Watch:
$3,400 per ounce: This historical high acts as the most significant resistance in the short term. A breakout above this level could trigger a stronger bullish bias and revive the upward trend stalled in recent weeks.
$3,300 per ounce: The current level aligns with the 50-period simple moving average. Price movement around this zone could extend market neutrality.
$3,200 per ounce: A key support level and recent low. A retest of this area could trigger a more decisive bearish bias in the short term.
Written by Julian Pineda, CFA – Market Analyst
