Short-term gold bulls and bears are anxious,3330 becomes the keyAt present, the market has been fluctuating narrowly in the range of 3330-3320, and both bulls and bears are in a stalemate. However, gold has formed a double-layer head and shoulders bottom pattern, so the short-term bullish trend is definitely unchanged. In the previous post, I also mentioned that if the rebound in the European session is weak and gold continues to be below 3345, then the short-term NY session may usher in a retracement and a second bottom. Therefore, I still hold a long order of 3325-3315, and temporarily modify the TP to the 3335 line. I expect that there may be a retracement here, but there may also be a direct retracement. No matter what the situation is, we need to stabilize before entering the market.
In addition to investment, life also includes poetry, distant places, and Allen. Facing the market is actually facing yourself, correcting your shortcomings, facing your mistakes, and exercising strict self-discipline. I share free trading strategies and analysis ideas every day for reference by brothers. I hope my analysis can help you.
PEPPERSTONE:XAUUSD FOREXCOM:XAUUSD FX:XAUUSD FXOPEN:XAUUSD OANDA:XAUUSD TVC:GOLD
Goldprice

Gold Ranges at $3,330–$3,335 – Ready for the Next Move📊 Market Overview:
Gold is currently trading around $3,330–$3,335/oz, supported by a softer US Dollar and cautious sentiment ahead of key US labor data. According to TradingView, gold is consolidating in a tight range, reflecting market indecision while awaiting a clear breakout signal.
📉 Technical Analysis:
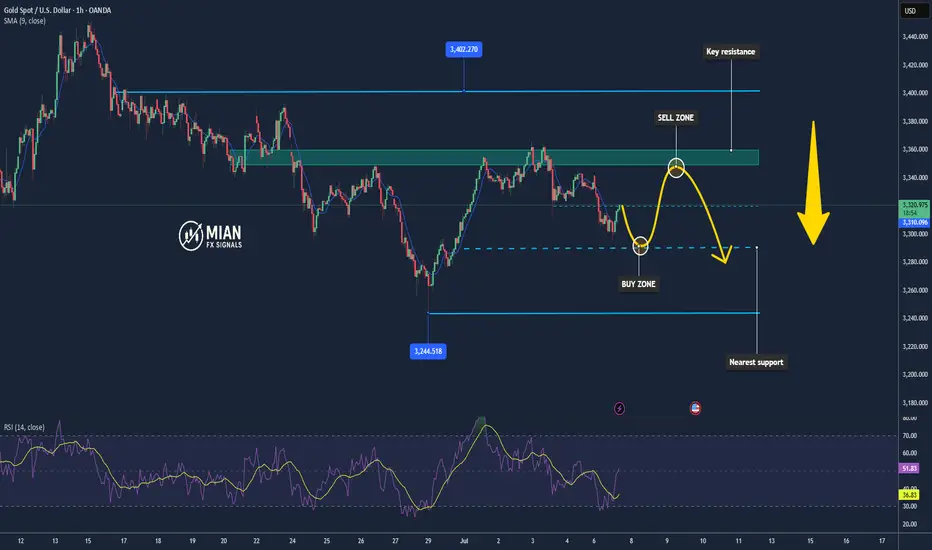
• Key resistance: $3,345–3,350 – a strong supply zone that recently rejected price.
• Nearest support: $3,320–3,330 – multiple bounce points observed here.
• EMA09: Price is hovering around the 09 EMA on both 1h–4h timeframes → neutral/slightly ranging.
• Candlestick / Volume / Momentum:
o A “bearish flag” pattern appears to be forming, suggesting potential for a downside breakout.
o Weak buying volume during upward moves signals limited bullish strength.
📌 Outlook:
• Gold may continue to consolidate between $3,330–$3,345.
• A break above $3,345 with strong volume could open the path to $3,360–$3,380.
• A break below $3,330 could lead to further correction toward $3,300–$3,320.
💡 Suggested Trading Strategy:
SELL XAU/USD at: 3,343 – 3,345
🎯 TP: 40/80/200 pips
❌ SL: 3,355
BUY XAU/USD at: 3,330 – 3,327
🎯 TP: 40/80/200 pips
❌ SL: 3,320

How to solve the problem of order being trapped in a loop📊 Gold Day Trading Strategy (Recommendation index ⭐️⭐️⭐️⭐️⭐️)
📰 News information:
1. The lasting impact of new tariffs
2. The impact of geopolitical conflicts
3. The Fed’s interest rate cut
📈 Technical Analysis:
The recent market conditions have been volatile. Many brothers have reported that they have been trapped recently. They have just been released from short positions, but have fallen into the situation of being trapped by long orders again. I have also encountered such a situation recently. Brothers who follow me must know that I have been trapped, but in the process of being trapped, I still share my trading ideas for the brothers who are trapped to check, so that we can all get out of the trap.
Gold fell as expected and hit the lowest point of 3287 before rebounding. The current 3300-3290 range given at the bottom has certain support. At present, I have answered it. As long as it does not fall below 3285, we can still go long and look for rebound correction. TP can temporarily look at 3305-3310. At present, the short-term upper watershed is near the 3321 line. As time goes by, the medium-term point can be seen at 3345. Only when the price stands above 3345 can the upward momentum continue to touch the 3380 line, or even 3400. In the short term, you can go long if you look at the support below. In the short term, pay attention to the resistance above 3315-3320. If it encounters resistance under pressure, it will fall back. On the contrary, after breaking through the first level of resistance, the upward trend will continue.
🎯 Trading Points:
BUY 3300-3290-3285
TP 3305-3315-3320-3345
SELL 3315-3321
TP 3300-3290
In addition to investment, life also includes poetry, distant places, and Allen. Facing the market is actually facing yourself, correcting your shortcomings, facing your mistakes, and exercising strict self-discipline. I share free trading strategies and analysis ideas every day for reference by brothers. I hope my analysis can help you.
TVC:GOLD OANDA:XAUUSD FXOPEN:XAUUSD FX:XAUUSD FOREXCOM:XAUUSD PEPPERSTONE:XAUUSD
Gold is going down without any signs. Will it continue?Yesterday's seemingly strong rise in gold's safe-haven market may make people mistakenly think that gold is going to rise sharply, but the recent safe-haven market has poor sustainability and poor upward momentum, and cannot maintain the continuation of the upward trend.
Looking at gold in 1 hour, after the price surged, it continued to fall under pressure at 3345. 3345 is also the recent key position for long and short positions. The 1-hour moving average of gold is still in a short position and continues to diverge downward. The short-term short momentum of gold still exists. I think the price will still fall after the rebound. Gold started to fall directly at 3330, and 3330 formed a strong resistance for gold in the short term. The downward low point did not continue after touching 3288. The current price rebounded and fluctuated around 3295. So we can sell high and buy low around 3385-3325.
Gold Price Setup: Bullish Continuation or Rejection? 🧠 Chart Analysis (XAU/USD – 1H):
Key Structure Highlights:
CHoCH (Change of Character) zones marked both up and down indicate a battle between bulls and bears.
Recent bullish CHoCH followed by a fair value gap (FVG) retest suggests potential continuation to the upside.
Price recently bounced strongly from demand zone, shown by the green arrows and strong candle reaction.
Ichimoku Cloud:
Price is trying to break back above the Kumo (cloud), a sign of bullish momentum building.
However, resistance is still present with the Kijun and Tenkan lines converging.
FVG (Fair Value Gap):
The current price is attempting to fill and break above the FVG zone.
A successful breakout above this area confirms bullish intention.
Fibonacci Levels:
Price is hovering around the 0.5 - 0.618 retracement zone, often a strong reversal or continuation point.
Upside targets lie near the 0.786 retracement (3352) and ultimate target at 3391, a major resistance level.
Risk Management:
Trade setup shows an excellent Risk:Reward ratio.
Stop-loss placed just below the last structure low.
Potential downside to 3290–3258 if breakout fails.
🟢 Possible Next Move:
Bullish Scenario: If price clears the FVG and breaks above 3353, expect continuation to 3391.
Bearish Rejection: If rejected at FVG/0.618 level, watch for a drop back to 3290 or even 3259.

GOLD - The One That Survived All Ages - Trading PsychologySummer light reading between trades💫
From Ancient Gods to modern banks — Gold never needed marketing to be priceless.
Gold was never invented.
It was found, worshipped, stolen, buried, and bled for.
Long before charts, before forex pairs, before brokers — it was power.
So if you're wondering why this metal moves the world?
Let’s take it back — way back.
But before we dive into history, here’s why traders are addicted to XAUUSD:
It’s fast. Ruthless. Liquid. It can deliver a week’s profit in one candle — or wipe you out in seconds.
If you understand structure, it will reward you like nothing else.
If you’re lazy, impulsive, or just guessing?
It’ll humble you fast and without mercy.
The Discovery – Gold Before Currency
• Gold was first discovered in Paleolithic caves (~40,000 B.C.), admired purely for its beauty.
• Ancient Egyptians called it “The flesh of the Gods” — Pharaohs were buried with it, because in their mind, you couldn’t enter the afterlife without gold.
• No value was assigned — it simply was value.
Empire Fuel – Gold as the Engine of War
• The Roman Empire used Gold Coins (Aureus) to expand its reach.
• Spain and Portugal built fleets just to steal it from the Americas.
• Entire wars were started and sustained by it — Gold wasn’t a luxury; it was national survival.
Gold & the Banks – Trust in a Metal
• 1816: The UK made Gold its official standard.
• By the early 1900s, most major economies followed — every currency was tied to the physical rulling metal .
• Why? Because you can’t print trust. But you can weigh it.
• Even today, central banks don’t hoard crypto or tech stocks — they hoard Gold, quietly, relentlessly.
Collapse, Rebirth, and Chaos – The Modern Era of Gold
• 1971: U.S. President Nixon kills the gold standard.
➤ Until then, every dollar had to be backed by real gold in U.S. vaults.
➤ After that? Dollars became promises, not assets.
• Welcome to the fiat era — where money has no anchor, just hope.
• Gold, no longer “money,” became something more powerful:
➤ The panic button, the global fallback, the last honest asset when everything else crumbles.
• And crumble it did:
🔹 2008: Banks collapse — Gold soars.
🔹 2020: Global lockdown — It explodes.
🔹 2022–2024: War, inflation, debt ceilings, de-dollarization — Gold reclaims the throne.
When fear wins, this metal doesn’t blink. It rises.
From Ancient Tombs to 2025 – Gold’s Unshakable Throne
• Today, you stare at candlesticks.
You mark order blocks, gaps, and key level zones.
But beneath that technical setup is a story written in blood, empire, and survival.
• Gold has outlived Kings. Outlasted currencies. Outsmarted every attempt to replace it.
You can crash a stock. You can ban a coin.
But you can’t cancel this number 1.
• And now? It’s 2025.
The world is uncertain. Digital assets are volatile.
And Gold is still the most traded, most hoarded, most feared asset on Earth.
• You’re not here by accident. You chose to trade this beast — not because it’s easy, but because you know what it means to master chaos.
So you’re not trading a metal.
You’re trading a legacy, so pay respect.
Every setup is a whisper from history — and every move on Gold is just the past repeating itself…
Only this time, the empire isn’t outside.
It’s YOU.
And your chart is your battlefield. So make an effort and study XAUUSD before trading it.
If this lesson helped you today and brought you more clarity:
Drop a 🚀 and follow us✅ for more published ideas.

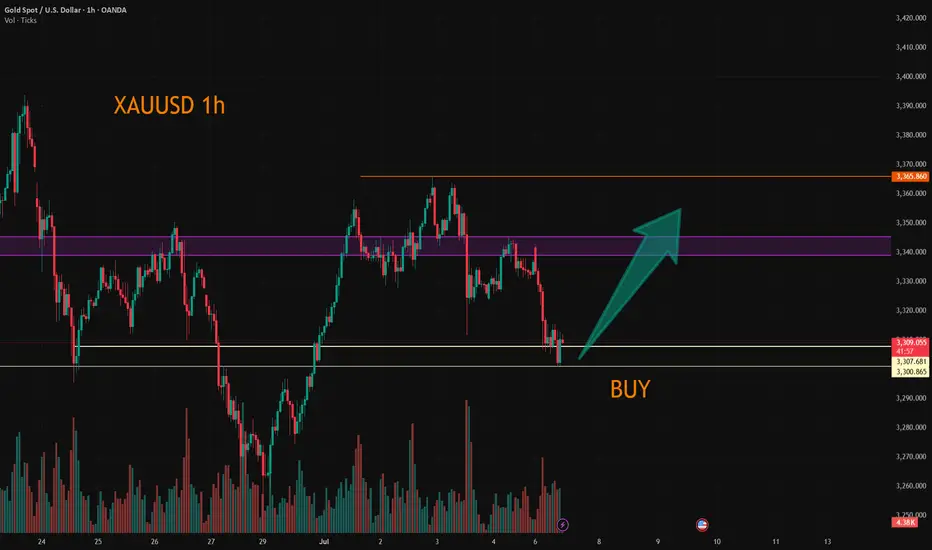
XAUUSD Short-Term Correction From the Top ZoneOn the 15-minute chart, XAUUSD showed a strong upward momentum starting below the 3,300 USD mark, reaching a peak near 3,346 USD. This rally was supported by a clear bullish structure and an ascending trendline.
However, once the price hit resistance at the top, selling pressure intensified, pushing the price into a downward correction. A clear pullback zone has formed between 3,346 USD and the support area around 3,318 USD — currently acting as a buy-side liquidity pocket.
Crucially, the price broke below the previous uptrend line and is now being capped by a descending resistance trendline, indicating a short-term bearish bias. Multiple failed attempts to break above the 3,332 – 3,335 USD area confirm that sellers still have the upper hand.
Additionally, the price action within this correction zone hints at a potential distribution pattern. Without strong buying interest to reclaim the 3,335 USD level, further downside remains possible.
Suggested Trading Strategy:
In the short term, traders may consider a “Sell on Rally” approach if price continues to fail at the 3,332 – 3,335 USD resistance zone.
Conversely, if a clear breakout occurs above the descending trendline and especially above the 3,336 – 3,338 USD area, the bullish trend may resume.
Conclusion:
XAUUSD is undergoing a technical pullback after a sharp rise. The market is currently in a tug-of-war between profit-taking pressure and recovery attempts. How price reacts at the current resistance will determine the next key move.

EURUSD Setup Scenario A – Bearish Continuation:
🔻 Sell near 1.17300–1.17340 (Resistance Zone)
🎯 Target: 1.17200 or lower
📉 Stop Loss: Above 1.17350
Scenario B – Bullish Breakout:
🔼 Buy if price breaks above 1.17350 with volume
🎯 Target: Next resistance zone (e.g., 1.17450 or more)
📉 Stop Loss: Below 1.17280
🧠 Summary:
Market is consolidating after a drop.
Watching for breakout above resistance or breakdown below support for next move.
Currently, the bias is slightly bearish, but breakout scenarios must be monitored.

GBPUSD Chart Analysis & Scenarios✅ Bullish Breakout (if breaks 1.3666):
Target: 1.3680–1.3700
Confirmation: Price closes above resistance with strong volume
❌ Bearish Rejection (if rejected at 1.3637–1.3666):
Target: 1.3610, possibly 1.3588
Watch for: Bearish candlestick pattern at resistance + drop in volume
✅ Summary:
GBP/USD is recovering strongly but faces heavy resistance at 1.3637–1.3666.
Breakout above could open room toward 1.3700.
Rejection likely if momentum weakens near resistance, targeting previous lows.

XAU/USD 08 June 2025 Intraday AnalysisH4 Analysis:
-> Swing: Bullish.
-> Internal: Bullish.
You will note that price has targeted weak internal high on two separate occasions forming a double top which is a bearish reversal pattern. This is in-line with HTF bearish pullback phase.
Remainder of analysis and bias remains the same as analysis dated 23 April 2025.
Price has now printed a bearish CHoCH according to my analysis yesterday.
Price is now trading within an established internal range.
Intraday Expectation:
Price to trade down to either discount of internal 50% EQ, or H4 demand zone before targeting weak internal high priced at 3,500.200.
Note:
The Federal Reserve’s sustained dovish stance, coupled with ongoing geopolitical uncertainties, is likely to prolong heightened volatility in the gold market. Given this elevated risk environment, traders should exercise caution and recalibrate risk management strategies to navigate potential price fluctuations effectively.
Additionally, gold pricing remains sensitive to broader macroeconomic developments, including policy decisions under President Trump. Shifts in geopolitical strategy and economic directives could further amplify uncertainty, contributing to market repricing dynamics.
H4 Chart:
M15 Analysis:
-> Swing: Bullish.
-> Internal: Bullish.
H4 Timeframe - Price has failed to target weak internal high, therefore, it would not be unrealistic if price printed a bearish iBOS.
The remainder of my analysis shall remain the same as analysis dated 13 June 2025, apart from target price.
As per my analysis dated 22 May 2025 whereby I mentioned price can be seen to be reacting at discount of 50% EQ on H4 timeframe, therefore, it is a viable alternative that price could potentially print a bullish iBOS on M15 timeframe despite internal structure being bearish.
Price has printed a bullish iBOS followed by a bearish CHoCH, which indicates, but does not confirm, bearish pullback phase initiation. I will however continue to monitor, with respect to depth of pullback.
Intraday Expectation:
Price to continue bearish, react at either M15 supply zone, or discount of 50% internal EQ before targeting weak internal high priced at 3,451.375.
Note:
Gold remains highly volatile amid the Federal Reserve's continued dovish stance, persistent and escalating geopolitical uncertainties. Traders should implement robust risk management strategies and remain vigilant, as price swings may become more pronounced in this elevated volatility environment.
Additionally, President Trump’s recent tariff announcements are expected to further amplify market turbulence, potentially triggering sharp price fluctuations and whipsaws.
M15 Chart:

Gold fluctuates. Beware of highs.On Monday, the U.S. dollar index rose sharply, reaching an intraday high of 97.65 as Trump announced that he would impose new tariffs on a series of countries including Japan and South Korea on August 1.
Spot gold fell first and then rose. It once fell below the $3,300 mark during the session, but then rebounded strongly in a V-shaped manner by nearly $40. As of now, it has stabilized above 3,330.
From the current daily line:
3,320 is the absolute support position for gold at present. Although it fell below 3,320 yesterday, Monday, it then reversed and stabilized above 3,320. For now, the daily line still cannot close below 3,320. If it closes below 3,320, the decline may open further. On the contrary, the current upper suppression position of gold is around 3,350. That is to say, it is basically maintained at 3,320-50 for rectification.
If the daily line stabilizes at 3350 again, the bulls may rise again.
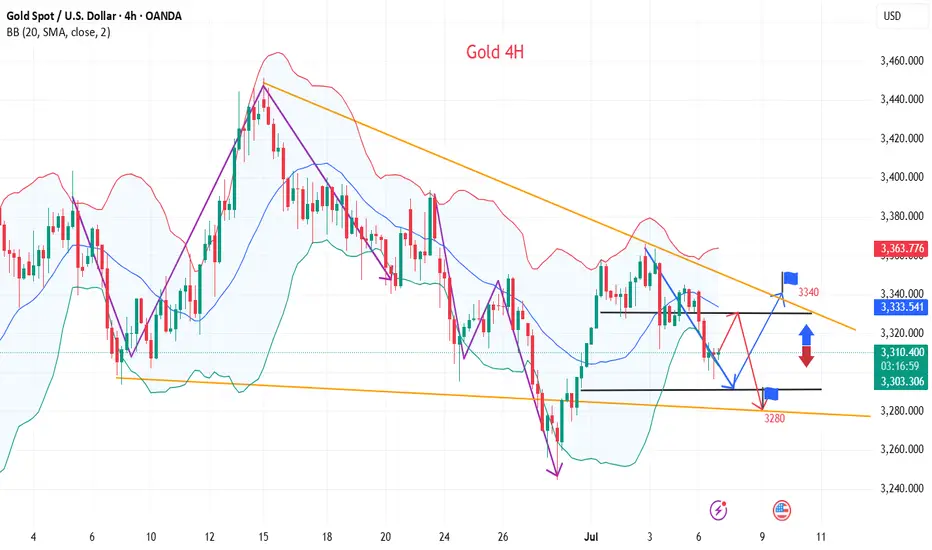
From the 4-hour chart, gold currently shows signs of a head and shoulders bottom. If the 4-hour chart stabilizes above 3340 again, the suppression level of 3350 may be directly broken. Next, it may directly touch the high level of 3380-90. Therefore, in terms of operation, I suggest that you can maintain long positions at 3320-30.
The first target is 3340-50. As long as the 4-hour chart stabilizes above 3340, you can continue to look at 3380-90.

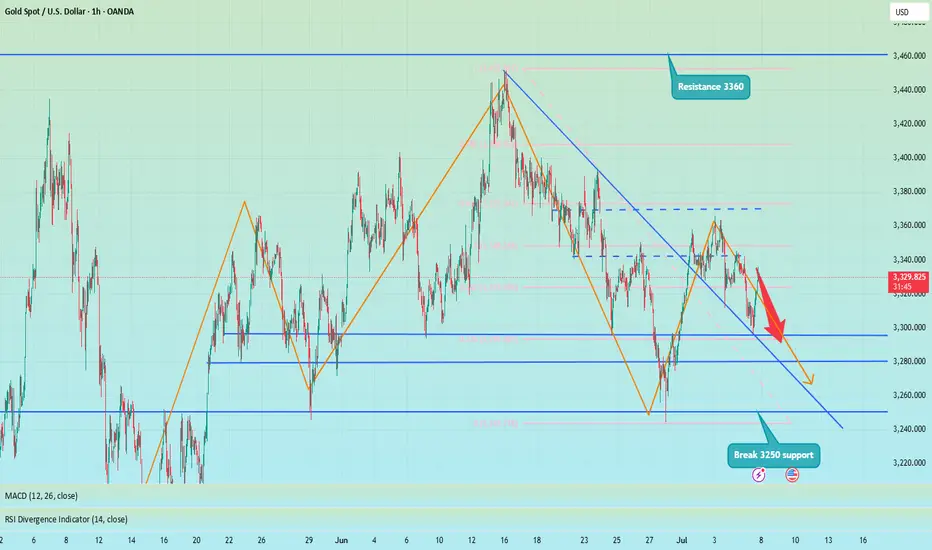
XAUUSD D1 – Gold Under Long-Term Bearish PressureGold is currently trading around 3,328 USD after failing to break above the descending trendline that started from the mid-June peak. On the chart, the price forms a series of lower highs and lower lows — a classic signal of a medium-term downtrend.
The descending trendline (green) acts as dynamic resistance. Each time price approaches it, strong selling pressure pushes it back down, showing sellers are in control.
In the short term, the 3,300 – 3,310 USD area serves as immediate support. If this zone is broken, price could drop further toward the major support zone around 3,260 – 3,270 USD.
Conversely, a confirmed reversal would only be valid if price breaks above the descending trendline and closes sustainably above 3,371 USD — a historically significant distribution zone.
The most recent daily candle is a small-bodied red candle with a long lower wick, indicating weak buying pressure and market indecision — typical in a consolidation phase before further downside.
Strategy Summary:
Favor short positions on pullbacks to the descending trendline.
Avoid bottom-fishing until a confirmed breakout above major resistance.
Traders should monitor the 3,300 USD zone closely in upcoming sessions.
Note: The analysis above is for informational purposes only and does not constitute investment advice. Stay tuned for further updates and adjust your trading plan accordingly.
What’s your take on the next move for gold? Share your thoughts in the comments!

Gold Continues Slight Pullback📊 Market Overview:
• Gold prices dropped ~0.7% to around $3,319/oz as optimism over the US trade negotiations and a tariff delay (from July 9 to August 1) reduced safe-haven demand.
• The US dollar strengthened slightly on upbeat economic data and expectations that the Fed will not cut interest rates in July, adding pressure on gold prices.
📉 Technical Analysis:
• Key resistance: $3,348 – $3,360 – $3,400
• Nearest support: $3,318 – $3,290
• EMA09: Gold is trading below the EMA50, indicating a short- to mid-term bearish bias.
• Candle/volume/momentum: On the 1H and 15-min charts, the price structure shows a clear bearish expansion – trading below pivot levels with a "bearish opening" setup, suggesting strong selling momentum.
📌 Outlook:
Gold may continue to move slightly lower in the short term if positive trade headlines and USD strength persist. However, if there’s unexpected negative news—like geopolitical tensions or a Fed policy pivot—gold could quickly rebound.
💡 Suggested Trading Strategy:
SELL XAU/USD at: 3,348 – 3,350
🎯 TP: ~40/80/200 pips
❌ SL: ~3,355
BUY XAU/USD at: 3,290 – 3,295
🎯 TP: ~40/80/200 pips
❌ SL: ~3,285
Shorts trapped? No, the head and shoulders top is still downOver the weekend, I gave a trading strategy for going long at 3315-3305. Today, I updated and optimized the long order trading, maintained the high-short-low-long trading strategy, and began to rebound near the 3300 line, and successfully touched the long TP 3333. At present, I am executing short trades again according to the trading strategy and holding short orders.
Although gold has only retreated to around 3330, I am not worried about losses and failures in short trades. As I wrote in today's post, the daily K-line chart has a head and shoulders top pattern. As long as the bulls fail to recover 3360, it is still a short trend. Therefore, in the short term, I still think that the rebound is a good opportunity for us to go short.
At present, the short-term bullish momentum of gold has been consumed and the downward trend continues. Therefore, I still insist on holding short orders in the short term.
In addition to investment, life also includes poetry, distant places, and Allen. Facing the market is actually facing yourself, correcting your shortcomings, facing your mistakes, and being strict with yourself. I share free trading strategies and analysis ideas every day for reference by brothers. I hope my analysis can help you.
FXOPEN:XAUUSD PEPPERSTONE:XAUUSD FOREXCOM:XAUUSD FX:XAUUSD FXOPEN:XAUUSD OANDA:XAUUSD TVC:GOLD
90-day tariffs expire, how to position gold next week📰 News information:
1. 90-day tariffs are about to expire
📈 Technical Analysis:
With the Trump administration's massive tax cut and spending bill officially implemented, the U.S. Treasury may start a "supply flood" of short-term Treasury bonds to make up for the trillions of dollars in fiscal deficits in the future. Concerns about the oversupply of short-term Treasury bonds have been directly reflected in prices. The yield of 1-month short-term Treasury bonds has risen significantly since Monday this week. Slowing wage growth, falling total work hours, stagnant wage income growth and concerns about consumer spending are all signs that support gold.
From a technical perspective, Friday's closing long shadow small candle body, the price closed at a high of 3345 and a low of 3224. The overall idea for next week is to follow the trend and rely on the first short-term support of 3323 below to participate in long positions. Secondly, 3315-3305 is given below. If the support point is lost, then 3300 below is also in danger, and there is no need to overly insist on continuing to do more at low levels in the short-term rhythm. The key pressure above is 3340-3350, and the limit is the pressure of 3360 above.
🎯 Trading Points:
BUY 3325-3323
TP 3333-3340-3350
BUY 3315-3305
TP 3325-3333-3340
In addition to investment, life also includes poetry, distant places, and Allen. Facing the market is actually facing yourself, correcting your shortcomings, confronting your mistakes, and strictly disciplining yourself. I hope my analysis can help you🌐.
FXOPEN:XAUUSD PEPPERSTONE:XAUUSD FOREXCOM:XAUUSD FX:XAUUSD OANDA:XAUUSD TVC:GOLD

GOLD TODAYHello friends🙌
🔊Due to the weakness of buyers and the strength of sellers, the price continues to fall...
We have identified two supports for you that will not be seen if the price continues to fall, and if the selling pressure increases, we will update you.
🔥Join us for more signals🔥
*Trade safely with us*

Gold: update hello friends✋️
According to the recent growth of gold, you can see that it is constantly resisting and forming a falling pattern.
For this reason, it can be a warning that the fall can continue and the price will fall to the specified limits.
🔥Follow us for more signals🔥
*Trade safely with us*

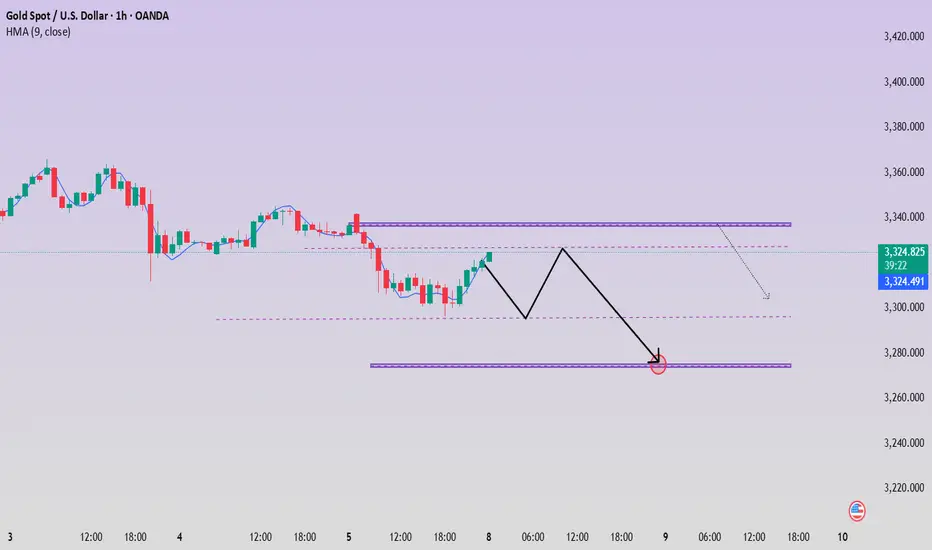
Gold rebounded from the bottom. Is the decline over?Gold prices faced selling pressure in today's Asian market. The price fell from 3343 to around 3320 in the early Asian session. The European price continued to fall, reaching a low of around 3296, and then rebounded upward. The current price is fluctuating around 3320.
Most investors will focus on the minutes of the Federal Open Market Committee (FOMC) meeting to be released on Wednesday to get guidance on the trend.
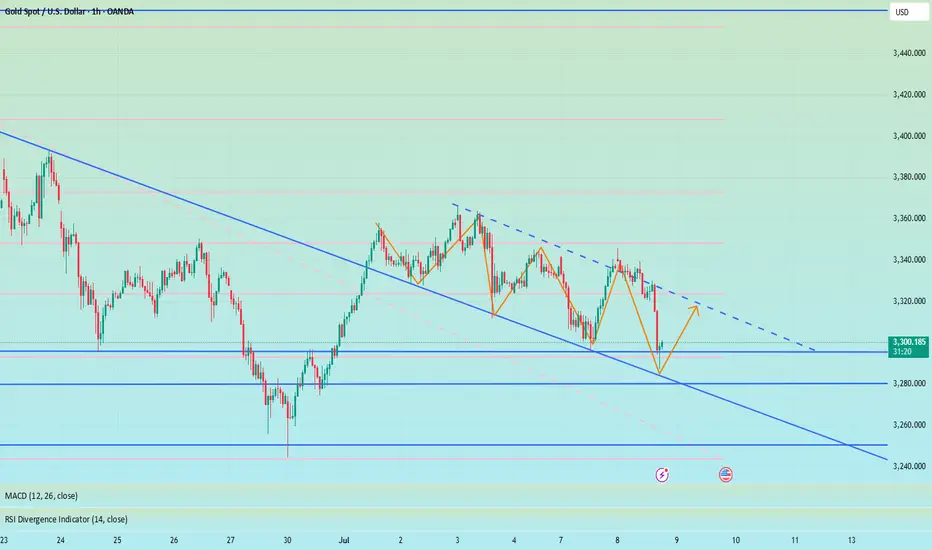
From the hourly chart, the upper pressure position is constantly being corrected. The current average pressure value is around 3330-3335. At the same time, this position is also the watershed between long and short positions in the previous dense area. The price may rebound to this position again. The lower support level is in the range of 3300-3290.
Quaid believes that the current market is still showing a downward trend, and the price may fall back below 3300 again.
Operation strategy:
Short around 3330, stop loss 3340, profit range 3310-3300, sustainable ownership after breakthrough.

XAUUSD:Go long
Gold prices fell back in Asian trading on Monday, as they digested Friday's negative data. The short term may be partial shock, but the medium and long term news surface uncertainty or to provide support for gold prices, so trading ideas, retracement to do long can.
Trading Strategy:
Both 3300 and 3308 can be used to enter the long position, short-term traders can look at 3325-30, followed by 50 around.
For intermediate traders, the target sees 3365-70 unchanged, and the retracting of 3300/3310/3330 is an opportunity to go long.
More detailed strategies and trading will be notified here ↗↗↗
Keep updated, come to "get" ↗↗↗
Bearish pressure below 3,300 at the start of the week
📌 Driving Events
Gold prices (XAU/USD) faced renewed selling pressure in early Asian trading on Monday, falling to the $3,320 level. Gold's pullback came as stronger-than-expected U.S. nonfarm payrolls data for June reshaped market expectations for the Federal Reserve's (Fed) policy path. Investors are now turning their attention to the Federal Open Market Committee minutes, which will be released on Wednesday, for further guidance.
The U.S. added 147,000 jobs in June, better than expected and slightly higher than the revised 144,000 in May. Meanwhile, the unemployment rate remained stable at 4.1%. These data reinforce the view that the labor market remains resilient, reducing the likelihood of an imminent rate cut by the Federal Reserve. As a result, the U.S. dollar strengthened, weighing on non-yielding assets such as gold.
📊Comment Analysis
The decline at the beginning of the week, gold prices give up accumulation below 3300
💰Strategy Package
⭐️Set gold price:
🔥Sell gold area: 3337-3339 SL 3344
TP1: $3328
TP2: $3312
TP3: $3300
🔥Buy gold area: $3297-$3295 SL $3290
TP1: $3308
TP2: $3320
TP3: $3330
⭐️ Note: Labaron hopes that traders can properly manage their funds
- Choose the number of lots that matches your funds
- Profit is 4-7% of the fund account
- Stop loss is 1-3% of the fund account
Gold fluctuates, beware of rebound caused by new tariffs📊 Gold Day Trading Strategy (Recommendation index ⭐️⭐️⭐️⭐️⭐️)
📰 News information:
1. 90-day tariffs are about to expire
2. New unilateral tariffs
3. Geopolitical situation
📈 Technical Analysis:
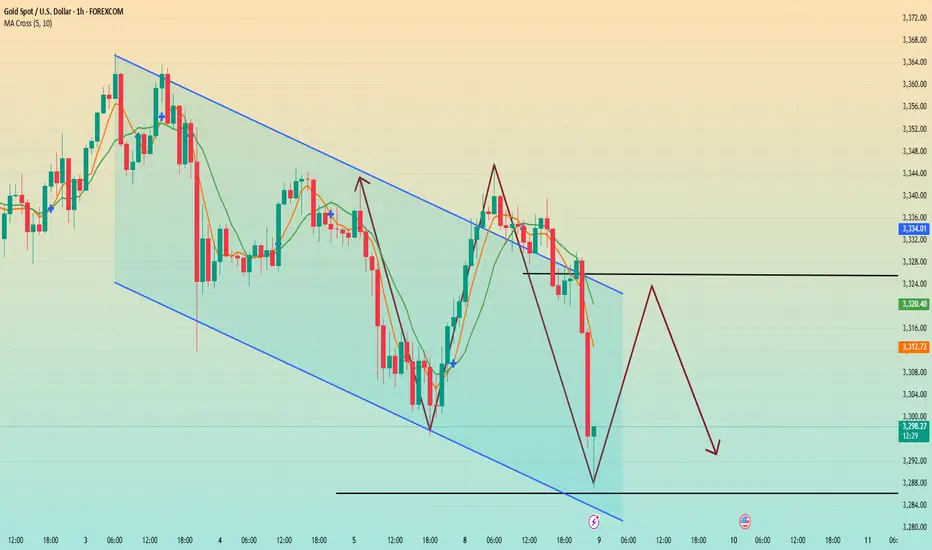
As I said this morning, shorting gold is divided into two times, the first time is near 3324, and the second time is at 3340 or 3345. If there is a short-term retracement after breaking through 24, you can follow up with a long order to look at 3335-3340. If gold is in a very weak state, you can consider shorting near 3315 and look at 3300. Because during the European session, 3300 has strong support, and the European session repeatedly tests this support. If it falls below 3300, we will go to 3295-3285, or even 3250. But at the same time, we need to pay attention to the rebound of gold that may be caused by tariff policies and geopolitical situations.
🎯 Trading Points:
SELL 3315-3325-3335
TP 3305-3295-3285
BUY 3290-3285
TP 3300-3310-3320
In addition to investment, life also includes poetry, distant places, and Allen. Facing the market is actually facing yourself, correcting your shortcomings, facing your mistakes, and being strict with yourself. I share free trading strategies and analysis ideas every day for reference by brothers. I hope my analysis can help you.
TVC:GOLD OANDA:XAUUSD FX:XAUUSD FOREXCOM:XAUUSD PEPPERSTONE:XAUUSD FXOPEN:XAUUSD

Gold is adjusting downward, don't blindly chase the short positi
Today, gold is in a consolidation and downward trend. As of now, the lowest price has reached around 3296, and it is still consolidating around 3300.
From the current point of view, gold is indeed in a bearish trend.
However, don't chase orders, this is very dangerous.
Because from the hourly chart, although the low point of gold is constantly refreshing, the key hourly chart support range position has not yet broken.
So, here I may think that gold may still be tempting to short in the short term.
There is still a possibility of a pullback on the hourly chart.
From the current point of view, before the range is broken, there is still a probability of a pullback to 3320-30.
So, in the next operation, I suggest that you can pay attention to 3320-30.
But there is no guarantee that it will definitely pull back, because it is indeed in a bearish trend now, and it may also go down directly.
However, if it does rebound again, as long as it does not stabilize at 3330 again.
Then, we can short at 3320-30.
On the contrary, if the rebound breaks directly above 3340, then be careful.
The rebound may turn into a reversal, and it is very likely to replicate the rhythm at the beginning of last week.

Gold short-term shock operation ideas
💡Message Strategy
Current Price and Context
Gold is trading around $3,310 and continues to retreat as traders remain cautious amid heightened macroeconomic uncertainty. While some safe-haven demand remains, a stronger dollar and weakening confidence among safe-haven buyers put gold under selling pressure. Concerns about global trade policy and tightening monetary policy continue to weigh on gold's short-term outlook.
Key Drivers
Geopolitical Risks: Trade tensions and global uncertainty have again sparked cautious sentiment, which has provided limited support for gold, but the absence of major conflicts has left it lacking direction.
U.S. Economic Data: Strong labor market data and upcoming inflation data supported the dollar, curbing gold's upward momentum.
FOMC Outcomes: The Fed remains cautious and does not signal an immediate rate cut; high yields reduce the appeal of non-interest-bearing assets such as gold.
Trade Policy: While tariffs have been a concern, flows between risk and safe-haven assets have been mixed as there has been no new escalation.
Monetary policy: Rising global bond yields and the Federal Reserve's wait-and-see attitude limit gold's gains in the short term.
📊Technical aspects
From the 4-hour analysis, the support line of 3290-3300 is concerned below, the short-term resistance above is concerned about 3315, and the suppression line of 3345-50 is focused on. The overall main tone of high-altitude low-multiple cycle participation remains unchanged. In the middle position, watch more and do less, and follow orders cautiously, and maintain the main tone of participation in the trend. Wait patiently for key points to participate. Pay attention to the specific operation strategy in time.
💰Strategy Package
Long Position:3290-3300,SL:3275,Target: 3330-3340
Short Position:3320-3330,SL:3305,Target: 3280-3290