"The Great Gold Heist" – XAU/USD Master Plan🏆 "The Great Gold Heist" – XAU/USD Master Plan (High-Risk, High-Reward Loot!) 🚨💰
🌟 Attention, Market Robbers & Money Makers! 🌟
Hola! Oi! Bonjour! Hallo! Marhaba! 🤑💸
🔥 Based on the legendary Thief Trading Strategy (technical + fundamental heist tactics), here’s our blueprint to STEAL massive profits from the XAU/USD (Gold vs. Dollar) market! 🔥
🎯 The Heist Plan (Long Entry Setup)
Entry Point 📈: *"The vault is UNLOCKED! Swipe bullish loot at any price—but for a cleaner steal, set Buy Limits within 15-30M recent swing lows/highs. ALERT UP! ⏰"*
Stop Loss 🛑: "Thief’s SL hides at the nearest swing low (4H TF: 3310.00) OR below the last daily candle wick. Adjust based on your risk appetite & lot size!"
Target 🏴☠️: 3440.00 (or escape early if the cops—err, bears—show up!)
⚡ Scalper’s Quick Loot Guide:
"Only scalp LONG! Rich? Go all-in. Broke? Join the swing traders & rob slow ‘n’ steady. Use Trailing SL to lock profits!"
📊 Market Status:
XAU/USD (GOLD) – Neutral (But Bullish Sneak Attack Likely! 🐂💥)
"The heist is ON, but watch for traps—overbought zones, consolidation, and bearish robbers lurking!"
🔍 Pro Thief Moves:
✅ Fundamentals Matter! (COT Reports, Geopolitics, Macro Data, Sentiment—check our Bii0 for the full loot list!) 🔗👉🏻☝🏻 klik lin.kk
✅ News = Danger! Avoid new trades during releases. Trail your SLs to protect stolen cash! 📰🚨
💖 Support the Heist Crew!
"Hit the BOOST BUTTON 💥 to strengthen our robbery squad! More boosts = easier money steals daily!"
🚀 Stay tuned—another heist drops soon! 🐱👤💎
Goldprice

Gold May Pull Back After Day’s High📊 Market Overview:
• Gold is currently trading around $3,350/oz, with the daily high at $3,366/oz.
• The rally stalled as traders took profits near the session high, while a slight rebound in the USD and rising U.S. Treasury yields weighed on gold’s momentum.
📉 Technical Analysis:
• Key Resistance: ~$3,366 (today’s high), with next level at ~$3,375–3,380 if breached.
• Nearest Support: ~$3,342 (intra-day low), stronger support seen at $3,329–3,330.
• EMA 9/21: Price is hovering near the EMA21 (~$3,350); this area is crucial to determine the short-term trend.
• Candle/Momentum Indicators:
o RSI is around 53-55, signaling a neutral stance;
o MACD shows weakening bullish momentum after hitting resistance.
📌 Viewpoint:
Gold may see a minor pullback in the short term, possibly testing the $3,342–3,329 zone after reacting to the daily high. However, if it holds above EMA21 and EMA50, the medium-term bullish trend remains intact.
💡 Suggested Trading Strategy
SELL XAU/USD at: $3,363–3,366
🎯 TP: 40/80/200 pips
❌ SL: $3,370
BUY XAU/USD at: $3,329–3,332
🎯 TP: 40/80/200 pips
❌ SL: $3,325

GOLD LOND TRADE IDEA We Are Looking Gold Bullish Today ,
TL BUY AREA : 3347 💡
1ST SUPPORT BUY : 3336, 3333 💡
2ND SUPPORT BUY: 3329, 3325 💡
If Gold Break The Trendline Then We See Gold Bearish Price Then We Buy At Support The Target Will Be ATH Liquidity 3390
If Gold Breaks Also 2nd Support Then Continue Bearish Trend Then We Trade Sell On a2nd Support Break
Manage Trades Properly Dont Forget To Follow Us For More Free Trades

Non-farm data is coming. Upward breakthrough?Information summary:
ADP data supports the rise of gold. Secondly, the weaker-than-expected non-farm data has triggered people's hope that the Federal Reserve will cut interest rates earlier. The gold price hit the 3360 mark, then fell back slightly, and is currently fluctuating around 3350.
This Friday is the Independence Day holiday in the United States. The non-farm data will be released on Thursday. Today, we will focus on this data, which will trigger a new trend.
Market analysis:
From the 4-hour chart, gold is currently in a suppressed state. However, it is not ruled out that it will be supported at the bottom as before, and then break through the upper suppression position again with the help of non-farm data.
Therefore, the most critical position today is not above, but near the support of 3325 below. On Wednesday, the support near 3325 was tested many times but did not break down. If the price remains above this position today, the probability of an upward breakthrough is very high.
Based on the current market conditions and the data to be released soon, Quaid recommends that everyone wait and see for a while and wait for the new trend to come. Of course, according to the current forecast data, this will support the rise of gold. A radical approach can also try a long strategy around 3345.

Elliott Wave Analysis of XAUUSDOn the daily chart of XAUUSD, we are witnessing a clearly defined Elliott Wave structure, with the potential formation of an extended wave (5) targeting the $3,726 region — aligned with the 0.618 Fibonacci extension. This is a key technical signal that could capture the attention of both long-term investors and strategic swing traders.
1. Elliott Wave Overview:
Wave (3) concluded at the peak around $3,365, followed by a textbook a-b-c corrective pattern.
Waves "a" and "b" are clearly identifiable, with wave "c" appearing to have completed.
The current price action suggests a rebound from the bottom of wave c — a strong indication of a possible start to wave (5).
2. Wave (5) Target Zone:
The Fibonacci 0.618 extension projects a target near $3,726 — a significant price level the market could approach if bullish momentum builds up.
This level also serves as a psychological resistance zone, so expect possible volatility as the price nears this area.
3. Price Behavior & Confirmation Signals:
Recent candlestick formations reveal renewed buying interest, with multiple bullish candles showing long bodies and lower wicks.
Holding above the key support around $3,300 is crucial for confirming the formation of an uptrend.
A breakout above the $3,365 high (wave (3) peak) would be a strong signal that wave (5) is in motion.
4. Suggested Trading Strategies:
Buy limit: Consider entries around the $3,310 – $3,320 support zone on a retest.
Buy breakout: Trigger entries if price breaks decisively above $3,365 with strong volume.
Take profit: Gradually scale out positions around the $3,680 – $3,726 area.
Stop loss: Place stops below the wave c bottom — under $3,245.
5. Conclusion:
XAUUSD is currently in a sensitive phase with a high probability of a bullish breakout. The Elliott Wave structure shows that there is still considerable upside potential. However, traders should maintain strict risk management, as wave (5) formations often involve significant price swings.

XAUUSD Technical Analysis – 02/07/2025On the 1-hour chart, Gold (XAUUSD) has just confirmed the completion of corrective wave (4) around the 3,328.3 zone, which aligns with the 1.0 Fibonacci level and EMA9 support. Currently, price is rebounding with increasing volume, signaling that buying momentum is returning.
Key Technical Highlights:
Elliott Wave Structure:
Wave (4) found support at 3,328.3.
Wave (5) targets are forming, with Fibonacci extensions pointing to:
0.618: 3,360.05
1.0: 3,380.07
=> These are critical resistance zones to watch.
Fibonacci Retracement Zones:
The current rebound is heading toward the 0.5 and 0.618 retracement levels of the previous down leg, located at 3,362.4 and 3,354.4 – short-term upside targets.
Volume Analysis:
Rising volume on bullish candles confirms a legitimate buying interest, supporting the upward movement.
EMA9 Breakout:
Price has broken above the EMA9 at 3,338.2, shifting short-term trend bias to bullish.
Suggested Trading Strategy:
Favor Buy on Dip entries near the 3,340–3,342 zone if a minor pullback occurs.
Short-term targets: 3,354 – 3,362
Extended target: 3,380
Suggested stop loss below 3,328.0 to manage risk.
Conclusion:
A bullish impulse is forming following the end of wave (4). If price holds above 3,340 and breaks through the nearby Fibonacci resistance levels, wave (5) could extend towards the 3,380 area. This is a pivotal moment to watch for a confirmed short-term uptrend.


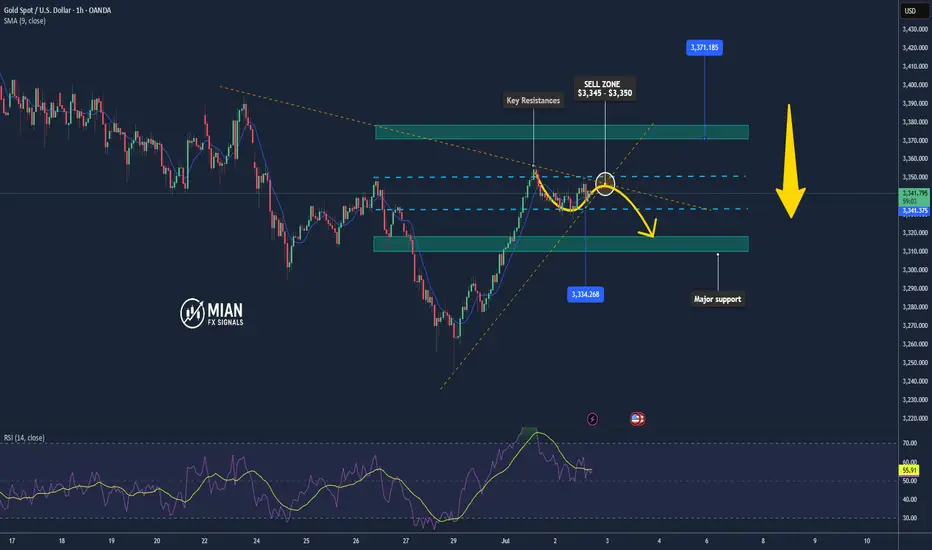
Gold Sees Volatile Swings – Pullback Risk Remains📊 Market Highlights:
Gold surged to $3,351 earlier today after weaker-than-expected US ISM manufacturing data, which boosted expectations of a Fed rate cut. However, profit-taking quickly pushed prices down to $3,334 before recovering to $3,342.
📉 Technical Analysis:
• Key Resistance: $3,351
• Nearest Support: $3,334
• EMA: Price is above EMA 09 → uptrend still intact.
• Candles / Volume / Momentum: H1 candle shows a long upper wick, indicating selling pressure near the recent high. Bullish momentum is slowing, and volume has started to normalize.
📌 Outlook:
Gold may face a short-term pullback if it fails to break above $3,351 and the USD strengthens during the US session.
________________________________________
💡 Suggested Trading Strategy:
🔻 SELL XAU/USD at: $3,345 – $3,350
🎯 TP: $3,334
❌ SL: $3,353
🔺 BUY XAU/USD at: $3,332 – $3,334
🎯 TP: $3,350
❌ SL: $3,323
Gold Trading Strategy February 7✏️As expected from the analysis, after the D1 candle showed buying pressure again, the price continued its uptrend yesterday and reached 3357.
Currently, the price is consolidating within a relatively wide sideways range, extending from 3328 to 3344.
A trend-following trading strategy will be set up when the price breaks out of this range.
The BUY signal is expected to bring good profits if the price retests the support.
The SELL signal at resistance is considered to look for rebound points in an uptrend.
📈 Key Levels
Breakout Range: 3344-3328
Support: 3310-3298
Resistance: 3368-3386
📊 Recommended Trade Setups
BUY: 3310-3308 | SL: 3305
SELL: 3368-3370 | SL: 3373

As expected, it will fall and form a head and shoulders bottom📰 News information:
1. ADP data, for reference of tomorrow's NFP data
2. Interest rate cuts and Powell's dovish comments
3. Geopolitical impact on the gold market
📈 Technical Analysis:
Yesterday we expected gold to retreat to the 3330-3320 area. Today, gold hit a low of around 3328 during the Asian session, which is in line with our judgment of the market trend. In the short term, gold may still fall. First, it may test the 3323 support line. If it falls back to this position during the day, you can try to go long. In the short term, focus on the 3315-3305 long-short dividing line below. If gold gets effective support below, it is expected to form a head and shoulders bottom pattern. The short-term decline will accumulate momentum for the future rise. Pay attention to the ADP data during the NY period
🎯 Trading Points:
BUY 3323-3315-3305
TP 3340-3350-3360-3375
In addition to investment, life also includes poetry, distant places, and Allen. Facing the market is actually facing yourself, correcting your shortcomings, confronting your mistakes, and strictly disciplining yourself. I hope my analysis can help you🌐.
FXOPEN:XAUUSD PEPPERSTONE:XAUUSD FOREXCOM:XAUUSD FX:XAUUSD OANDA:XAUUSD TVC:GOLD

How do we plan before ADP and NFP?📰 News information:
1. ADP data, for reference of tomorrow's NFP data
2. Interest rate cuts and Powell's dovish comments
3. Geopolitical impact on the gold market
📈 Technical Analysis:
The market will continue to fluctuate before the ADP data, and the market will continue to rise after the adjustment. In the 4H cycle, the upper rail of the pressure is temporarily suspended, and the Bollinger Bands also close. This is why I emphasize the need to pay attention to the 3323 support line below. At present, gold rebounded, I think it will touch 3348 at most, that is, it rebounded to 50%. Therefore, before the ADP data, I still hold the position of 3340-3350 for shorting, and find support for long at 3325-3315 below. I have marked the pattern of head and shoulders bottom in the figure. I have been engaged in spot, futures, foreign exchange and other transactions for many years. My analysis ideas can be referred to by brothers
🎯 Trading Points:
SELL 3340-3350
TP 3330-3325-3315-3295
BUY 3323-3315-3305
TP 3340-3350-3360-3375
In addition to investment, life also includes poetry, distant places, and Allen. Facing the market is actually facing yourself, correcting your shortcomings, confronting your mistakes, and strictly disciplining yourself. I hope my analysis can help you🌐.
TVC:GOLD OANDA:XAUUSD FX:XAUUSD FOREXCOM:XAUUSD PEPPERSTONE:XAUUSD FXOPEN:XAUUSD

Gold Pulls Back Slightly After Peaking at $3,357📊 Market Overview:
Gold rallied to $3,357 yesterday following weak US manufacturing PMI, sparking expectations of an upcoming Fed rate cut. This morning, prices are pulling back to around $3,340 as traders await the FOMC meeting minutes for further guidance.
📉 Technical Analysis:
• Near resistance: $3,357
• Key resistance: $3,370
• Near support: $3,330
• Major support: $3,318
• EMA: Price is still above the 09 EMA, but starting to slope downward → short-term weakness emerging.
• Candlestick & momentum: Doji candle with a long upper wick on H4 chart around $3,357 → showing fading bullish momentum. RSI dropping out of overbought zone confirms potential short-term pullback
📌 Outlook:
Gold is currently in a mild downward correction, and may continue to decline toward $3,330 – $3,318 if the FOMC minutes do not suggest strong dovish intent.
💡 Suggested Trading Strategy:
🔻 SELL XAU/USD at: $3,350 – $3,354
🎯 TP: $3,330
❌ SL: $3,359
🔺 BUY XAU/USD at: $3,328 – $3,332
🎯 TP: $3,350
❌ SL: $3,318

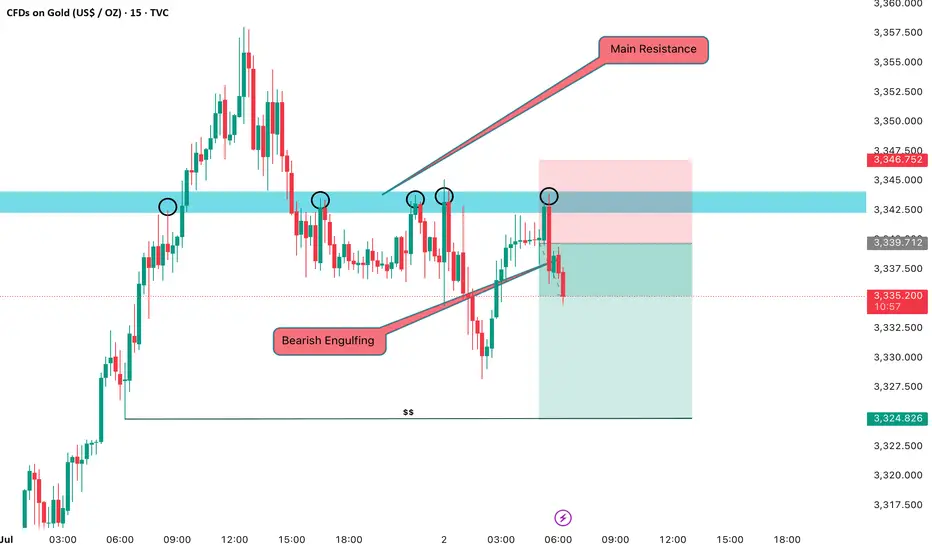
GOLD SHORT TRADE SIGNALGold Sell Now 3338 / 3343
Stoploss : 3347
Target : 3324
Reason Main Resistance Rejection
Bearish Engulfing Conformation To Sell
Gold prices have risen sharply. How should we trade gold?
📣Gold news:
US Senate passes Trump tax reform bill. Trump wins major victory
Trump's signature tax and spending cuts bill passed the Senate on Tuesday. Republican leaders finally convinced dissenting lawmakers after a hard fight, helping Trump win another political victory.
Trump refuses to extend July 9 tariff deadline
US President Trump reiterated on Tuesday that he has no intention of extending the 90-day suspension of reciprocal tariffs on most countries after it expires on July 9.
When asked whether he would extend the suspension of tariffs, Trump replied on Air Force One: "No, I haven't thought about it. I will write to many countries to notify them of the tariff rates they will face."
Gold (XAU/USD) struggled to extend its two-day rally, fluctuating narrowly in the Asian session on Wednesday, just below Tuesday's one-week high. The dollar's slight rebound - from its lowest level since February 2022 - put pressure on gold. Moreover, improving market sentiment continues to weaken demand for safe-haven assets such as gold, further limiting its upside.
⭐️Technical Analysis:
Trend lines are steadily picking up, and continued buying could move towards 3383 based on today's ADP-NF data
💰Set Gold Price:
💰Sell Gold Zone: 3375-3385 SL 3395
TP1: $3370
TP2: $3360
TP3: $3350
💰Buy Gold Zone: $3315-$3310 SL $3305
TP1: $3320
TP2: $3330
TP3: $3340
⭐️Technical Analysis:
Set reasonable buy orders based on technical indicators EMA 34, EMA89 and support resistance areas.
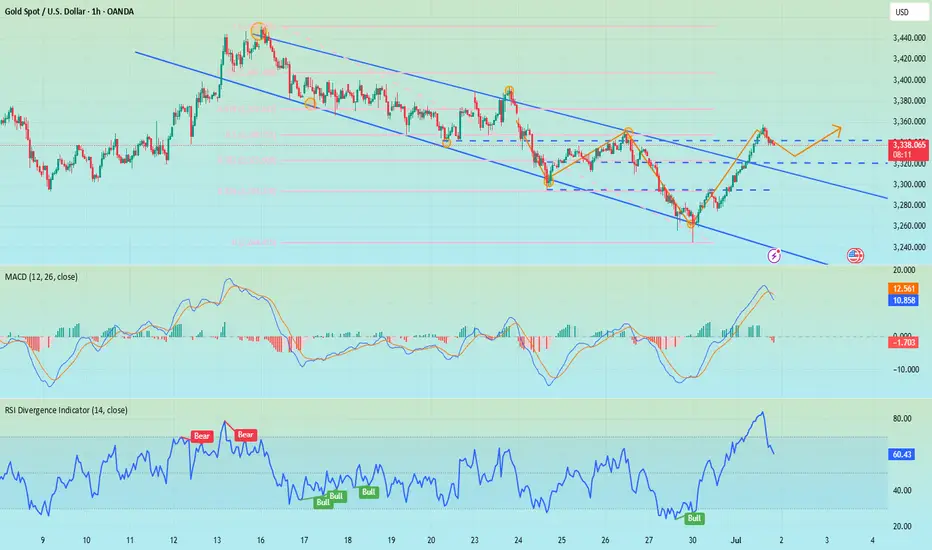
Gold breaks trend – bullish wave returnsIn the most recent trading session, gold (XAUUSD) has made a strong rebound from the key support zone around $3,263 and is now approaching a short-term resistance near $3,347 – signaling a potential continuation of the bullish momentum in the short term.
1. Price Structure & Market Behavior After reaching a local top around $3,347–$3,350, gold entered a clear downtrend.
However, the breakout of the descending trendline (yellow line) with solid bullish candles is a strong reversal signal.
The market has formed higher highs and higher lows with strong bullish candles, confirming a V-shape reversal pattern from the bottom zone.
2. Key Support & Resistance Levels Immediate resistance: $3,347–$3,350 – previous rejection zone.
Short-term support: $3,308 – newly broken resistance now acting as support.
Major support: $3,263 – previous low with strong bullish bounce, highlighting significant buyer interest.
3. Suggested Trading Strategy Given the strong breakout and bullish trend structure, traders may consider a buy-the-dip strategy around $3,308–$3,315 on potential pullbacks.
Stop-loss should be placed below $3,263 to protect against false breakouts.
Short-term take-profit targets can be set at $3,350–$3,360. If this level breaks, extended targets could reach $3,375.
Volume & Momentum Volume is increasing along with price, confirming strong buyer participation.
Bullish candles are closing near highs, showing weak selling pressure and suggesting the uptrend may continue.
Conclusion: Gold has resumed a short-term uptrend after breaking its previous downtrend. Traders should favor bullish setups and look for pullbacks to enter at better prices. Watch the $3,347 zone closely – if gold breaks and holds above it, further upside is likely.

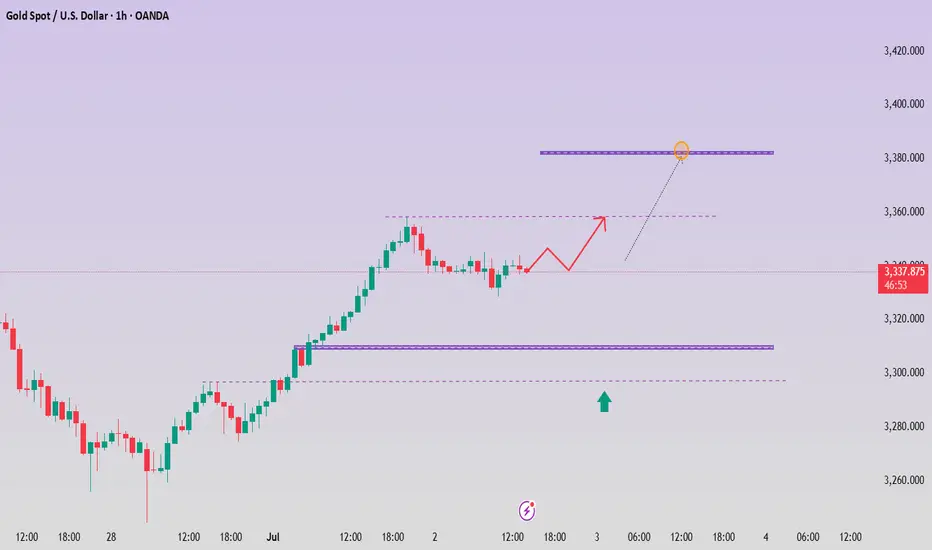
XAUUSD Consolidates Near Resistance After Strong RallyGold (XAUUSD) on the 1H timeframe has staged a solid bullish reversal from the 3,263 USD support zone, reaching a recent high of 3,357 USD. Now, the market is entering a consolidation phase just below this resistance. This price action may be setting the stage for the next directional move.
After breaking a clear descending trendline, XAUUSD formed a two-leg bullish structure with higher highs and higher lows – a classic signal of trend reversal. The rally paused around 3,357 USD, a previous swing high acting as short-term resistance. The price is currently ranging between 3,330–3,340 USD with decreasing volume, indicating a potential accumulation zone rather than distribution.
Resistance: 3,357 USD – breakout target
Support zone: 3,330–3,335 USD – short-term demand zone
Invalidation level: 3,306 USD – below this, bullish structure breaks
As long as price holds above 3,330 USD, a bullish continuation remains the primary scenario. Traders can look for pullbacks or bullish patterns within this zone for potential long entries. A break and close above 3,357 USD would confirm strength, opening the path toward 3,370 or even 3,390 USD.
Stop-loss should be placed below 3,306 USD to manage risk if the breakout fails. If price loses the 3,306 support decisively, the setup turns neutral to bearish short-term.
The breakout leg was supported by rising volume, validating real demand. Current low-volume sideways movement suggests the market is “cooling off” after the rally, often a precursor to the next breakout move. Watching for bullish engulfing candles or volume spikes near support can offer trade confirmation.
Conclusion:
Gold remains in a bullish technical structure on the 1H chart. The current range between 3,330–3,357 USD is key. If price breaks above resistance, we could see strong continuation toward higher levels. Traders should stay patient, manage risk carefully, and let price action confirm the next move.

Gold Trading Strategy July 1✏️ D1 candle has a bullish recovery when closing above 50% of last Friday's decline.The bullish wave of Gold is forming, heading back to the GAP 3363 zone.Today's main strategy is to wait for BUY if there is a retest of 3300. Reaction sell strategy is focused on resistance zones with not too long expectations.
📈 Key Levels
Support 3300- 3379- 3360
Resistance 3334-3348-3363
📊 Recommended Trade Setups
BUY GOLD 3300-3298 Stoploss 3295
SELL GOLD 3348-3350 Stoploss 3353

GOLD H2 Intraday Chart Update For 2 July 2025Hello Traders,
Today all eyes on breakout of 3360-70 zone in order to GOLD go for further advance below this zone all eyes are remains on 3318 level if market successfully maintain 3330 level then will go down further towards 3300 Psychological Level after passing 3318
NFP main event of the day which is held by tomorrow
Disclaimer: Forex is Risky

Gold retreats as expected, how to trade in the future📰 News information:
1. Geopolitical situation
2. PMI data
3. Global Central Bank Governors Meeting
📈 Technical Analysis:
Our short orders have achieved profits. I closed the position near 3337, turning losses into profits. Interested friends can follow my previous post. In the short term, I am still optimistic that gold will retreat below 3335-3325. Today, gold rose sharply, and the rebound momentum was strong, while the short-term correction was slightly weak, so the space for a second decline in the short term will be limited. If it falls to the 3333-3323 range during the day and gets effective support, you can consider going long. The short-term upper resistance is 3360-3375.
🎯 Trading Points:
BUY 3333-3323-3315
TP 3341-3355-3360-3375
In addition to investment, life also includes poetry, distant places, and Allen. Facing the market is actually facing yourself, correcting your shortcomings, confronting your mistakes, and strictly disciplining yourself. I hope my analysis can help you🌐.
TVC:GOLD OANDA:XAUUSD FX:XAUUSD FOREXCOM:XAUUSD PEPPERSTONE:XAUUSD FXOPEN:XAUUSD
Gold falls back, is a bottom structure emerging?In terms of one-hour structure, this round of phased adjustment started from 3450 has not ended yet, but it will soon, especially the rapid rebound after the bottom of 3260 on Monday. This rebound has strong momentum. After bottoming out and rebounding, it is currently fluctuating around 3340, with a large overall span. This also shows that after the price has risen, the amplitude of the correction has increased, which means that the upward space is limited. This adjustment is likely to be over soon, but there is no definite bottom structure yet, so we need to wait for some time.
Before going out of the definite bottom structure, based on the principle of following the trend, you can try to short with a light position. At present, in terms of the one-hour pattern, the key point is here at 3355, and it is currently falling back from this position to 3340. If it falls back to the 3320 area today and stabilizes above it, you can operate a long strategy. On the whole, Quaid suggests that the short-term operation strategy for gold today should be mainly long on pullbacks, supplemented by shorting on rebounds.
Operation strategy:
Short at 3345, stop loss at 3355, profit range 3330-3325.
Long at 3320, stop loss at 3310, profit range 3340-3345.

Why Gold Trading is Not Easy for Beginners - Trading PsychologyGold Doesn’t Just Teach Trading. It Teaches You Discipline.
1. Why Gold? Why Not Everything Else?
Gold is the most honest manipulator in the market.
It respects structure down to key intraday levels—but builds traps around it like a pro.
It fakes direction, sweeps liquidity, teases early entries, then moves beautifully for anyone patient enough to wait.
And it’s daily: one premium buy and one killer sell almost every day—hundreds of pips on the table for eyes that can see.
Other assets feel slow once you lock into Gold’s rhythm.
So what to expect:
2. The Phases Before Profit
• Lucky Dumb Money
Early wins boost your confidence. You increase your risk. It all feels easy—until the market proves otherwise.
• The Slap
Suddenly, things don’t work anymore. Indicators stop making sense. Emotions interfere. Results shift, and frustration creeps in. This is the breaking point for most traders. 6 months to 1 year on XAUUSD and they are out.
• The Awakening
This is when clarity begins. Indicators are dropped. Structure, liquidity, and timing take center stage.
What once looked random now starts to make sense.
Progress begins the moment YOUR EGO gets quiet.
Consistency only follows those who choose patience over panic.
3. Gold Is a Mirror
Gold doesn’t just reflect your trades — it reflects YOU.
Every personal flaw shows up on the chart: impatience, doubt, greed, fear, ego.
It mirrors your decisions, your reactions, your emotional patterns — all of it.
Blaming the market delays growth.
But the moment you turn inward, you begin to see the truth:
your results reflect your level of discipline, clarity, and self-awareness.
Gold forces you to evolve.
Not just as a trader, but as a thinker, a decision-maker, a human.
That’s why it’s not for everyone. Some people are not ready to recognize who they truly are yet.
4. What Leads to Profitability
What actually leads to profitability in Gold?
It’s fast. It’s full of adrenaline.
But you have to get a routine - consistent, structured, and effective — when applied with discipline.
→ One pair only. Mastery on XAUUSD
→ Structure first. Liquidity, imbalance, session timing
→ Fewer trades, cleaner entries
→ Smaller lots, more control = emotions are in check
→ Relentless observation. Learn from each execution and adjust with intention
This is what leads to results.
Not noise. Not hope. Just precision and presence — again and again.
5. You Won’t Win Until You Commit
You don’t need to destroy your schedule or stay up all night.
But you do need to make time for growth.
Signals won’t help if you’re not willing to understand the asset you’re trading.
Gold filters out shortcuts, distractions, and surface-level effort.
But those who take it seriously earn every pip — and they earn it with clarity, not luck.
So stop asking,
“How long until I’m profitable?”
Start asking,
“Am I ready to do what Gold actually demands?”
CONCLUSION:
Most traders don’t fail because Gold is too complicated—
they fail because they try to figure it out alone.
They chase signals, skip the process, and ignore the real path to consistency:
invest in education, proper mentorship, and trading psychology coaching.
The ones who grow fastest are those who seek guidance early—
from people who live and breathe this market, and understand structure, mindset, and pressure.
If you choose to go at it alone, that’s also a good choice.
Just know: it will take longer. It will test your patience and your clarity.
But when the structure clicks… when you stop chasing setups and start executing with confidence…
When you secure 3–4 solid trades a week and avoid unnecessary losses—
everything changes. Trading becomes calm. Focused. Even enjoyable.
Whichever path you take, the outcome depends on the same thing:
Gold won’t just test your trades.
It will develop your discipline.
If this lesson helped you today and brought you more clarity:
Drop a 🚀 and follow us✅ for more published ideas.

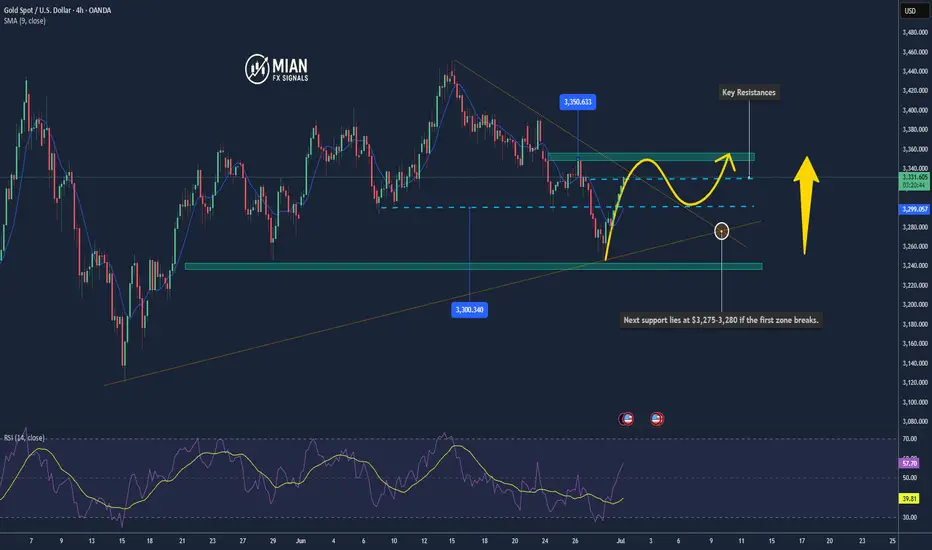
Gold Might Break Higher As It Hits $3,330 Resistance📊 Market Drivers
Gold has just climbed to $3,330/oz, supported by ongoing safe-haven demand and a slightly weaker U.S. dollar ahead of Fed Chair Powell’s speech. Investor expectations of a rate cut in September are keeping bullish momentum alive.
________________________________________
📉 Technical Analysis
• Resistance:
→ $3,330–3,335 (50-day SMA & Fibonacci level)
A breakout above $3,335 could open the door to $3,350+.
• Support:
→ $3,300–3,310 (psychological level & EMA9)
→ Next support lies at $3,275–3,280 if the first zone breaks.
• EMA09:
Price is currently above the 9-EMA, confirming a short-term bullish trend.
• Momentum Indicators:
o MACD is bullish; Stochastics is high — all signaling upside, though a short-term pullback may occur if the resistance holds.
________________________________________
📌 Outlook
Gold is likely to continue climbing in the short term if it breaks above the $3,330–$3,335 resistance zone, fueled by bullish sentiment and dovish Fed expectations.
If it fails to break higher, a minor correction toward $3,300–$3,310 could follow.
________________________________________
💡 Suggested Trade Strategy
BUY XAU/USD : $3,320–3,325
🎯 TP: 40/80/200 pips
❌ SL: $3,310
SELL XAU/USD : $3,340–3,345
🎯 TP: 40/80/200 pips
❌ SL: $3,350
Gold surged and then fell. Has it reached its peak?Information summary:
Today, the United States and Japan negotiated on tariffs. Trump said that the US-Japan deal was unfair and might send a letter to Japan; the US-Japan trade negotiations seemed to be at a standstill. Trump also threatened that he would not extend the expiring tariff period and would send letters to most countries and regions in the next few days.
Secondly, the United States accused the EU of unfair digital legislation and asked the EU to relax its supervision of US technology giants. In addition, Trump accused "Mr. Too Late" Powell and the entire committee on social media that they should be ashamed of not cutting interest rates.
Affected by the above news, gold's risk aversion sentiment heated up and prices started to rise for the second time.
Market analysis:
From the 4-hour chart, the market is currently in a slow upward trend in a downward channel, and the price is also repeatedly testing the upward pressure position of 3355. MA5-day and 10-day moving averages turned upward and crossed with the 20-day and 30-day moving averages. At present, the upward momentum is slightly insufficient. In the short term, we should focus on the suppression position of 3355. If we fail to break through this position for a long time, the trend will most likely turn into a downward trend. If no black swan event occurs, today's price will most likely fluctuate around the 3320-3350 range. If there is no black swan event, the price today will most likely fluctuate around the range of 3320-3350.
Operation strategy:
Short near 3355, stop loss 3365, profit range 3340-3330.
Long near 3315 when the price falls back, stop loss 3305, profit range 3340-3345.
