GOLD (XAU/USD) MA Breakout – High-Probability Long Setup!💰🚨 GOLD HEIST ALERT! XAU/USD MASTER PLAN (Thief Trading Style) 🎯
🔥 Steal Pips Like a Pro – High-Probability Gold Breakout Strategy! 🔥
🎯 Thief Trading’s GOLD Heist Strategy (Swing/Day Trade) �💸
👋 Hey there, Market Pirates & Profit Snatchers! 🌍✨
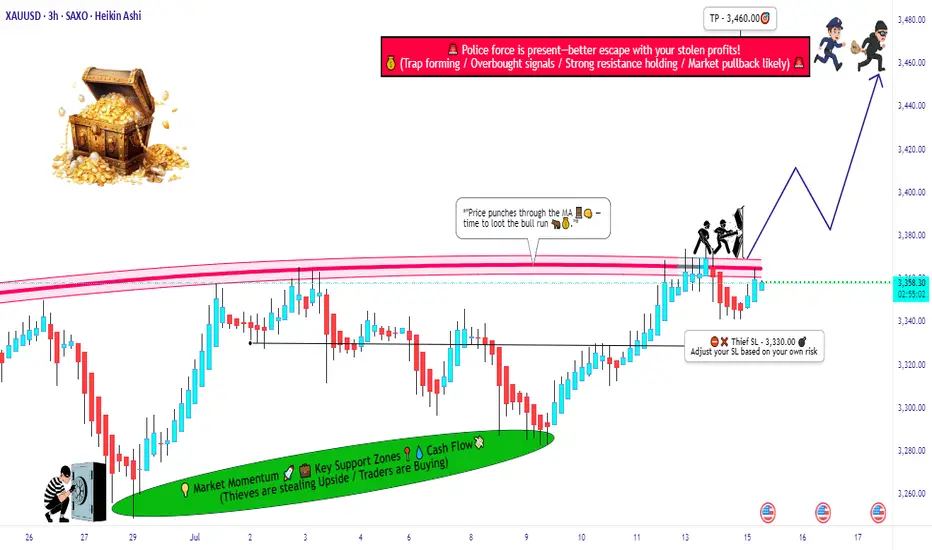
Based on our 🔥Thief Trading Style🔥 analysis, we’re plotting a major heist on XAU/USD (GOLD). The plan? Buy the breakout, escape before the cops (resistance) arrive! 🚔💨
📈 ENTRY ZONE: The Heist Begins!
🚀 "Wait for the MA Breakout (3400) – Then Strike!"
Bullish Confirmation: Enter on a 15M/30M pullback after MA breakout.
Thief’s Trick: Use Buy Stop above MA or Buy Limit near swing lows for best risk-reward.
DCA/Layering Strategy: Deploy multiple limit orders to maximize gains.
🔔 Set an ALERT! Don’t miss the breakout – thieves move fast! ⏳
🛑 STOP LOSS: Protect Your Loot!
📍 Thief’s SL Placement: 3330.00 (4H Swing Low) – Adjust based on your risk & lot size.
⚠️ WARNING: If using Buy Stop, DO NOT set SL until after breakout – unless you love unnecessary losses! 🔥
🎯 TARGET: Escape with the Gold!
🏴☠️ Take Profit Zone: 3460.00 (or Exit Early if Bears Show Up!)
Scalpers: Only trade LONG side – use trailing SL to lock in profits.
Swing Traders: Ride the wave but watch for resistance traps!
📰 MARKET CONTEXT: Why This Heist?
Neutral Trend (But Bullish Potential! 🐂)
Key Factors: Geopolitics, COT Data, Macro Trends, Sentiment Shift
🚨 News Alert: Avoid new trades during high-impact news – trailing SL saves profits!
💥 BOOST THIS HEIST! (Like & Share for More Pips!)
💖 Hit the 👍 Boost Button to strengthen our Thief Trading Crew!
🚀 More Heist Plans Coming Soon – Stay Tuned!
⚠️ DISCLAIMER (Stay Safe, Thieves!)
This is NOT financial advice. Do your own analysis & manage risk.
Markets change fast! Adapt or get caught.
🎯 Happy Trading, Pirates! Let’s Steal Some Gold! 🏴☠️💛
Goldprice
"GOLD Bandit Strategy: Loot Pips Like a Pro!🏆 GOLD HEIST ALERT! 🏆 XAU/USD Bandit Strategy (Swing/Day Trade)
Steal Pips Like a Pro! 💰🔓 Bull vs. Bear Raid Plan
🌟 Greetings, Market Pirates! 🌟
"The trend is your accomplice—time to loot!"
🔮 Thief’s Technical & Fundamental Intel:
XAU/USD (The Gold Vault) is flashing BEARISH signals, but we’re ready to raid both sides! Follow the heist blueprint below 👇
🎯 ENRY POINTS (Where to Strike!)
🏴☠️ LONG RAID (Bullish Thieves):
Break & Grab: Enter above 3450.00 (Pullback Zone)
"Wait for the breakout, then ambush!"
🐻 SHORT RAID (Bearish Bandits):
Sneak Attack 1: Sell below 3300.00
Sneak Attack 2: Sell below 3260.00 (Support Wall Cracked!)
🛑 STOP-LOSS (Escape Routes)
Bullish Trade: SL at 3230.00 (Guard your loot!)
Bearish Trade 1: SL at 3360.00 (Don’t get caught!)
Bearish Trade 2: SL at 3280.00 (Risk = Reward!)
(Adjust SL based on your risk appetite & lot size!)
💰 TAKE-PROFIT (Cash Out & Flee!)
Bullish Thieves: TP at 3270.00 (Or escape early!)
Bearish Bandits (1): TP at 3270.00
Bearish Bandits (2): TP at 3210.00 (Big score!)
⚠️ WARNING: Market Traps Ahead!
News = Danger Zone! 📢 Avoid new trades during high-impact news.
Trailing SL = Your Getaway Car! Lock profits & evade reversals.
📰 FUNDAMENTAL BACKUP (Why This Heist Works)
Bearish momentum fueled by macro trends, COT data, & sentiment.
Stay sharp—markets shift fast!
💥 BOOST THIS HEIST! 💥
Like & Share to strengthen our pirate crew! 🚀 More alerts = More profits!
🚨 Next Heist Coming Soon… Stay Tuned! 🚨

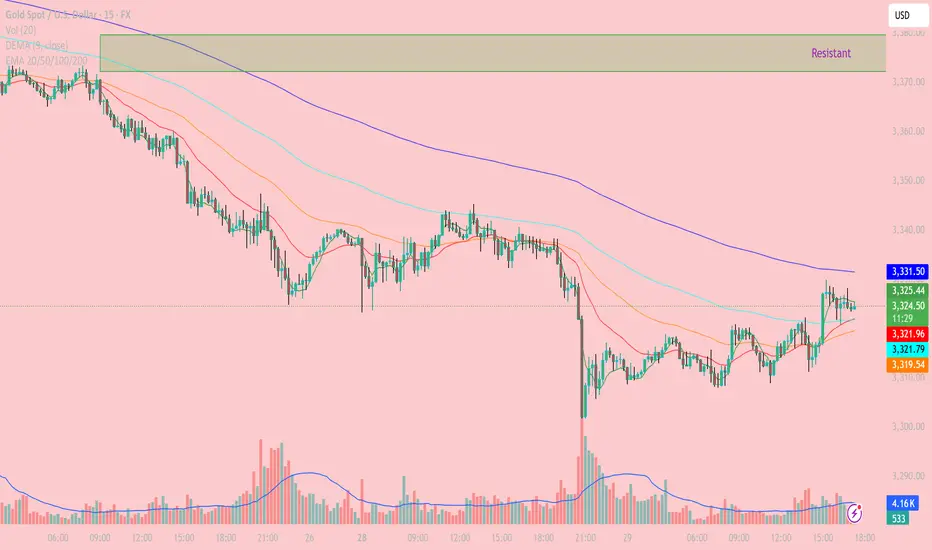
XAUUSD – Gold Intraday Technical Analysis (15-Min Chart) - July Current Price: 3,323.93 USD
Timeframe: 15 minutes
Last update: 17:14 UTC+7
- Trend Overview:
The 15-minute chart shows a minor recovery after a sharp drop in gold prices. However, overall pressure remains bearish as price continues to trade below all key EMAs (50–100–200), and the bulls have yet to break through significant resistance above.
- Key Technical Zones:
Nearby Resistance:
3,331.57 (EMA200): dynamic resistance, repeatedly tested but not broken
3,340 – 3,350: supply zone + 0.618 Fibonacci retracement
3,360 – 3,375: strong resistance zone (purple box), previous major rejection area
Nearby Support:
3,321.70 – 3,319.34 (EMA50 – EMA100): also aligns with 0.382 Fibonacci support
3,309 – 3,310: previous low, potential demand zone on deeper pullback
- Technical Analysis:
EMA & Structure:
Price is testing EMA200 (3,331.57) – a key level to watch for confirmation of any trend reversal. However, the larger trend remains bearish as long as this resistance holds.
EMA9 and EMA20 have crossed above EMA50, suggesting short-term bullish momentum, though not yet strong enough to confirm a full reversal.
Volume Analysis:
Recent bullish candles were supported by higher volume, but the current rally is weakening in volume – a sign of fading buying pressure.
RSI (not shown but recommended):
Watch for RSI break above 60 to signal potential continuation toward higher resistance levels.
- Trading Strategies:
Scenario 1 – Sell at Resistance (Sell on Rally):
Entry zone: around 3,330 – 3,335
Stop loss: above 3,340
Targets: 3,320 → 3,310
Rationale: Price is testing EMA200 and resistance; no confirmed breakout yet
Scenario 2 – Short-Term Buy on Dip:
Entry zone: 3,319 – 3,321 (EMA50/100 confluence)
Stop loss: below 3,308
Targets: 3,330 – 3,335
Rationale: Minor support holding, potential short bounce if price stabilizes
- Conclusion:
Gold is attempting a short-term rebound, but the broader trend remains bearish unless price breaks above 3,340 – 3,350 resistance. For now, focus on short setups at resistance and scalping small bounces from strong support zones.
Follow to receive more daily strategies – and don’t forget to save this if you find it useful.
Got a different view on gold today? Let’s discuss it in the comments!
How to accurately capture golden opportunities during volatilityAt present, the trend of gold is that gold is under pressure and fluctuates below 3320-22 in the Asian session, and it rises and breaks through in the European session. The rhythm is strong correction. So we should first look at the continuation of the rebound, and continue to short after the pressure appears. Combined with the closing of the daily and weekly lines, there is still a need for further adjustment. The rebound focuses on the pressure area around 3340-3350. In terms of operation, continue to go high after the pressure appears.
Operation suggestion: short gold around 3340-3350, target 3330-3320.

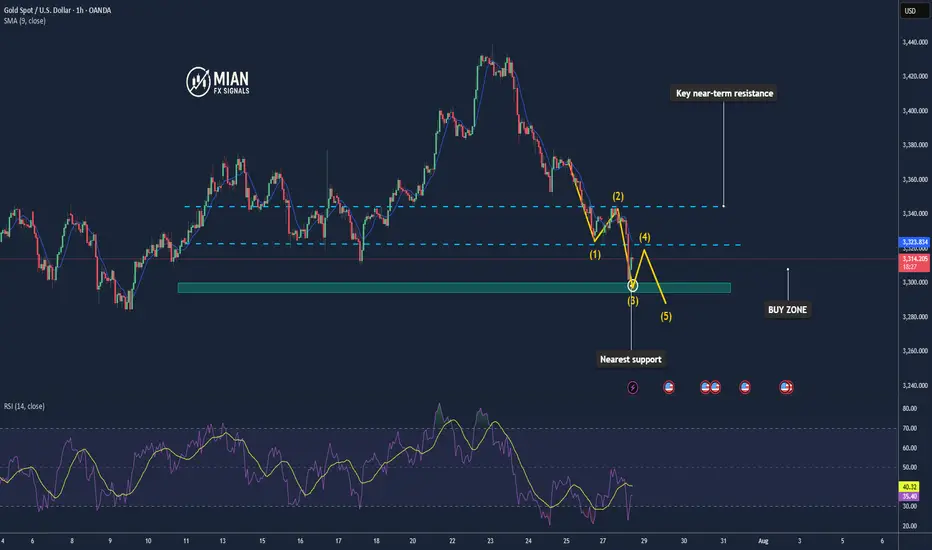
Downward Pressure Resumes After Channel BreakdownXAUUSD OANDA:XAUUSD – Downward Pressure Resumes After Channel Breakdown: Key Levels and Strategy for Today
As of the July 29 session, gold (XAUUSD) remains under short-term bearish pressure, having broken below the descending price channel on the 1H timeframe. The market structure confirms a dominant bearish trend as price continues to trade below the EMAs cluster.
1. Price Action and Market Behavior
XAUUSD is forming a clear sequence of lower highs and lower lows, confirming a short-term downtrend.
Price is currently hovering around $3,316 after breaking below the lower boundary of the channel, signaling potential continuation of the sell-off.
2. Key Resistance and Support Levels
Immediate resistance: 3,337 – 3,346 USD (aligned with EMA20, EMA50 and prior channel resistance).
Major resistance: 3,378 – 3,385 USD (confluence of Fibo and former high).
Near-term support: 3,300 USD (psychological level).
Major support: 3,248 USD (projected target based on measured move from channel height).
3. Technical Indicators
EMA20 and EMA50 are both below EMA200, forming a classic “death cross” – a strong bearish signal.
Volume increased on the breakdown, reinforcing the strength of bearish momentum.
RSI remains below 50, indicating weak bullish retracements and room for further downside.
4. Trading Strategy
Primary Strategy: Sell on Rally
Ideal entry zone: 3,331 – 3,346 USD.
Stop Loss: Above 3,353 USD (above key resistance zone).
TP1: 3,300 USD.
TP2: 3,248 USD (extended target based on breakout structure).
Alternative Strategy: Countertrend Long
Only consider buy setups if strong reversal candles and bullish RSI divergence appear near 3,248 USD.
XAUUSD continues to face downside risk after the channel breakdown. Unless bulls reclaim the 3,337 – 3,346 zone, price is more likely to drift lower toward 3,300 and potentially 3,248. Traders should remain patient and wait for clean setups around these key zones.
Follow for more strategies and remember to save this post if you found it helpful.
Let me know if you'd like a short version for the TradingView caption or hashtags suggestion.

Gold Recovers After Sharp Drop – Trend Not Yet Reversed📊 Market Overview:
Gold rebounded from a sharp fall earlier in the session, rising from $3301 to around $3315 as the U.S. dollar weakened slightly and sellers took partial profit. However, no strong fundamental catalyst confirms a trend reversal yet.
________________________________________
📉 Technical Analysis:
• Key Resistance: $3315 – $3322
• Nearest Support: $3300 – $3295
• EMA 09 (H1): Price is currently just below EMA09, indicating a slight bearish bias
• Candlestick / Volume / Momentum:
• H1 candle shows a long lower wick at $3301 → some buying interest
• No H1 candle has closed above $3315 yet → no confirmed reversal
• Volume remains weak, RSI still under 50 → limited bullish momentum
________________________________________
📌 Outlook:
Gold may continue to consolidate between $3300 and $3315 in the short term. If it fails to close above $3315, bearish pressure could return toward $3295–$3288.
________________________________________
💡 Suggested Trade Setups:
🔻 SELL XAU/USD: $3315 – $3318
🎯 TP: 40/80/200 pips
❌ SL: $3323
🔺 BUY XAU/USD: $3295 – $3300
🎯 TP: 40/80/200 pips
❌ SL: $3285
Gold price bottoming out?Market news:
In early Asian trading on Tuesday (July 29), spot gold fluctuated in a narrow range and is currently trading around $3,320 per ounce. The international gold price fell to a three-week low on Monday, mainly because the United States and the European Union reached a trade agreement over the weekend, boosting the dollar and risk sentiment. In addition, Trump said that he would impose a "global tariff" of 15% to 20% on most countries, which was different from his statement last week. The dollar index rose to a one-week high, making gold relatively expensive for investors holding other currencies.The volatile downward trend of London gold prices was not only directly affected by the trade agreement reached between the United States and Europe, but also closely related to the strong rebound of the US dollar index, the recovery of global risk appetite and the market's expectations for the Federal Reserve's interest rate policy. At the same time, the progress of Sino-US trade negotiations, Trump's tough stance on Russia and the Middle East, and the continued tension in geopolitics still add more uncertainty to the future trend of the gold market.Gold is facing multiple tests: the three unfavorable factors of a strong dollar, a rebound in risk appetite, and a rise in real interest rates have formed a combined force. In addition, the US Conference Board Consumer Confidence Index for July and the US JOLTs job vacancy data for June will also be released on this trading day, and investors need to pay attention to them.
Technical Review:
The further strengthening of the US dollar index has caused gold to continue to adjust close to the 3300 mark under pressure. As the price crosses below the short-term moving average, the current short-term moving average and other periodic indicators have begun to turn downward, and the Bollinger Bands as a whole are also intended to shrink. In addition, the macd indicator has a dead cross pattern again and has no upward intention, and it has a strong downward extension and obvious volume. Therefore, the daily line should continue to tend to sell. However, while selling, we should also pay attention to the strength of the rebound.The daily chart closed with a continuous negative structure, and the price was running in the middle and lower tracks of the Bollinger Bands and below the MA10 daily moving average of 3360. The short-term four-hour chart hourly chart Bollinger Bands opened downward, and the moving average opened downward. In addition, the macd indicator maintained a dead cross pattern, and the downward volume showed sufficient potential, so the 4-hour gold price can continue to participate in selling at a high level after a short-term rebound, assisting low-price buying!
Today's analysis:
Gold bears are galloping all the way, and gold buying has basically no rebound strength. Gold is still in a selling trend. Go with the trend, the trend is king, and continue to sell with the trend. As long as gold does not show an obvious buy reversal signal, then the rebound is to continue to sell gold to the end.The gold 1-hour moving average continues to form a dead cross selling arrangement. The selling strength of gold is still very strong, and gold selling will continue to exert its strength. Gold rebounded to 3318 yesterday, which is still a weak rebound. The watershed for buying and selling gold is now at 3330. Gold rebounds above 3330 in the Asian session, which is an opportunity to sell at highs.
Operation ideas:
Buy short-term gold at 3300-3302, stop loss at 3292, target at 3330-3350;
Sell short-term gold at 3330-3333, stop loss at 3342, target at 3300-3290;
Key points:
First support level: 3308, second support level: 3293, third support level: 3284
First resistance level: 3330, second resistance level: 3346, third resistance level: 3360

Gold repeatedly tested lows. Will it break through?On Monday, the Asian market opened low and rose in the early trading. In the European trading, it rose to around 3345. The European trading was under pressure and fluctuated. The US trading began to accelerate its decline, and the lowest point reached around 3302. Then it continued to fluctuate in the range of 3300-3320.
On July 27, the United States and the European Union reached a framework trade agreement; the agreement reduced market concerns about the global economic recession, promoted the attractiveness of risky assets, and boosted the stock market and the US dollar. Although Trump has repeatedly pressured for a substantial interest rate cut, the market has strong expectations for a September interest rate cut. The current expectation of maintaining a stable interest rate dominates the market, coupled with the strength of the US dollar, which puts gold prices under downward pressure in the short term.
Gold opened low in the early trading on Monday and then rebounded to recover the losses, but then fell below the low again, and the daily line closed in the negative, and now it has formed a four-day negative decline. MA5 and 10-day moving averages form a dead cross, and there is a downward turn.
The focus on the upper side is around Monday's high of 3345, which is also near the current position of MA5, 20, and 30-day moving averages. Below this position, gold is weak; if it breaks upward, it is necessary to prevent the possibility of a rebound correction.
The lower support first focuses on the 3300 integer mark; secondly, focus on the area around 3285-3275.
Operation strategy:
Short near 3340, stop loss 3350, profit range 3320-3300;
Long near 3300, stop loss 3290, profit range 3320-3340.
Before the release of US data on Tuesday, you can maintain this operation strategy; after the data is released, adjust the strategy based on the impact of the data.
XAU/USD(20250729) Today's AnalysisMarket news:
After gold prices soared to an all-time high of more than $3,500 an ounce in April, the latest report from the Commodity Futures Trading Commission (CFTC) showed that fund managers have increased their bullish bets to the highest level in 16 weeks.
Technical analysis:
Today's buying and selling boundaries:
3320
Support and resistance levels:
3363
3347
3337
3303
3293
3277
Trading strategy:
If the price breaks through 3320, consider buying in, with the first target price of 3337
If the price breaks through 3303, consider selling in, with the first target price of 3293

Scalp long position on Gold: R/R 1:3, Risk 1%Hello Guys
You can enter to this long position with maximum risk 1%
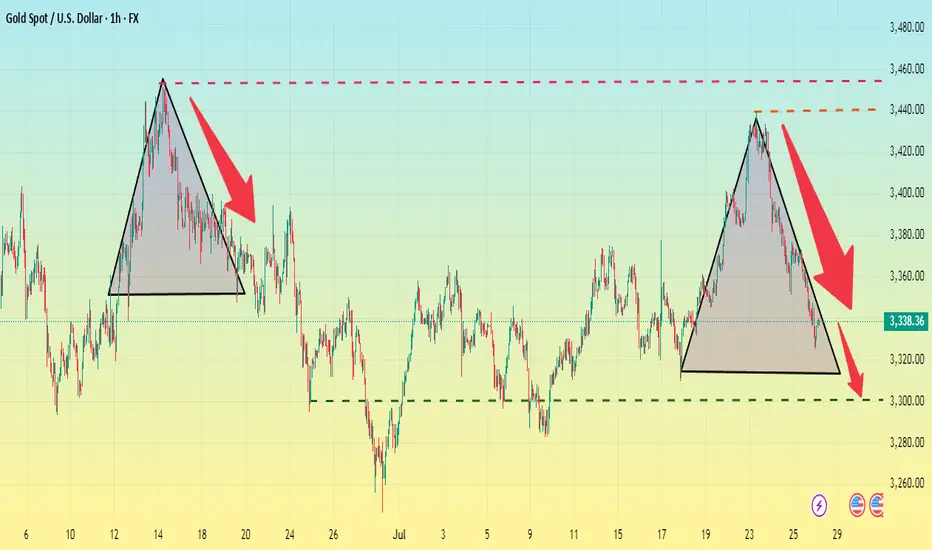
Maintain a bearish view as long as 3355 is not broken!Market view and technical pressure: At present, the decline of gold is mainly due to the good news of the trade agreement. Since hitting a high of $3,500/ounce in April, gold has been in a sideways range. It has only returned to the lower edge of the range and has not formed a trend reversal. Since April, gold has experienced multiple "saw-tug" fluctuations, with the highs gradually lower and the lows gradually higher. The overall pattern is a triangular convergence. If it breaks down, it may drop to the 100-day moving average (about $3,227-3,232/ounce) or even test the 200-day moving average (about $3,000/ounce). However, since gold failed to stand above $3,450/ounce for the fourth time, it shows that there is great pressure for selling at high levels. It is expected that gold will continue to fluctuate this week, but it may be slightly weaker because the overall risk appetite of the market has increased.
Views on today's gold trend: Gold fell weakly last Friday, beyond everyone's expectations. It touched the 4-hour trend line of 3335 that we talked about last week and then fell directly. From the current trend, the trend is bearish and there is no rebound, so the weakness will continue. Only after the decline reaches a certain position and bottoms out will there be buying. At the beginning of this week, we can continue to be bearish. The rotation of long and short positions on the hourly line is more obvious. The first three days were still in the upward trend channel, and the next two days directly gave up the gains and rebuilt a new downward channel. Then the position of 3350 is our key point to continue to be bearish today. After all, both the 4-hour and daily lines have fallen below our key support, so it is inevitable to change our thinking and be bearish!

Market forecasts are completely accurate, trading signals#XAUUSD
After opening today, gold tested the lowest point near 3324 and then rebounded, which is in line with my prediction of gold trend last night. Next, we need to pay attention to whether the upper 3345-3350 constitutes a short-term pressure level. If you are aggressive, you can consider shorting at 3345-3350, with the target at 3330-3325. Continue to hold if it falls below 3325, and stop loss if it breaks above 3350. After it breaks above, you can consider following up with a long order to close the position at 3360-3370. Short once at 3370-3380 for the first time, and stop loss if it breaks above 3380.
🚀 SELL 3345-3350
🚀 TP 3330-3325
🚀 BUY 3352-3355
🚀 TP 3360-3370
🚀 SELL 3370-3380
🚀 TP 3345-3325-3310
Be sure to study my trading strategy carefully. If you only look at the price points, you will definitely suffer certain losses. Participate in the transaction at the right time based on your own account funds and set stop losses.

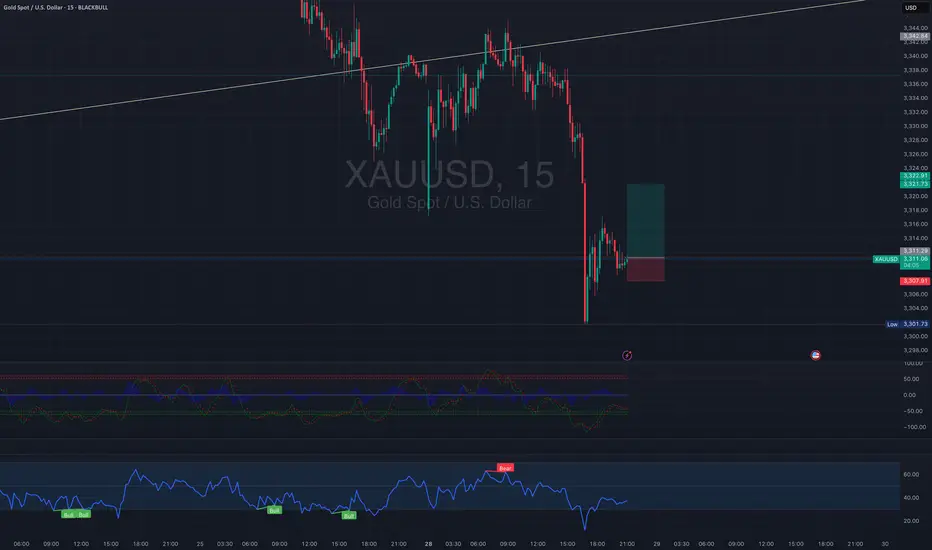
[XAUUSD] Reversal Signals from Key Support As of the July 28–29 trading sessions, the XAUUSD 15-minute chart is showing early signs of a bullish reversal, with price reacting strongly at a key Fibonacci support zone and breaking through a descending trendline.
1. Price Action and Technical Structure
After a prolonged downtrend from the 3,430 zone, gold found support at the 0.618 Fibonacci retracement (3,327.85), aligning closely with the horizontal support at 3,324 – 3,327.
A descending trendline has been breached, signaling a potential breakout setup.
A potential ZigZag corrective wave structure is forming, hinting at the beginning of a new bullish swing.
2. Fibonacci Extension & Upside Targets
The Fibonacci extension tool suggests a possible rally toward the 3.618 extension at 3,425.
This level marks the next major upside target if the breakout holds.
3. Key Price Levels
Price Zone
Technical Significance: 3,327 – 3,324 Major support zone (Fib 0.618 + horizontal support)
3,350 – 3,355 First reaction zone / interim resistance
3,380 – 3,400 Strong resistance zone
3,425 Final target – 3.618 Fib extension
4. Suggested Trading Strategy
Long Setup – Breakout & Reversal Confirmation
Entry: 3,328 – 3,332 (after bullish confirmation above trendline and support)
Stop Loss: Below 3,320 (beneath local swing low)
Take Profit: 3,355 → 3,380 → 3,425 (scaling out by zone)
Bearish Continuation Scenario
If price drops below 3,320 and breaks 3,307 support, the bullish outlook is invalidated, and a retest of deeper levels is likely.
5. Volume and Confirmation Cues
Volume has started to pick up as price tests the breakout zone – indicating that buying pressure may be returning.
Wait for a strong bullish candle with volume above average before committing to the trade.
Gold is approaching a critical inflection point, and bulls may regain control from this confluence support zone. Stay alert for a breakout confirmation. Save this idea if you find it helpful and follow for more high-probability strategies!
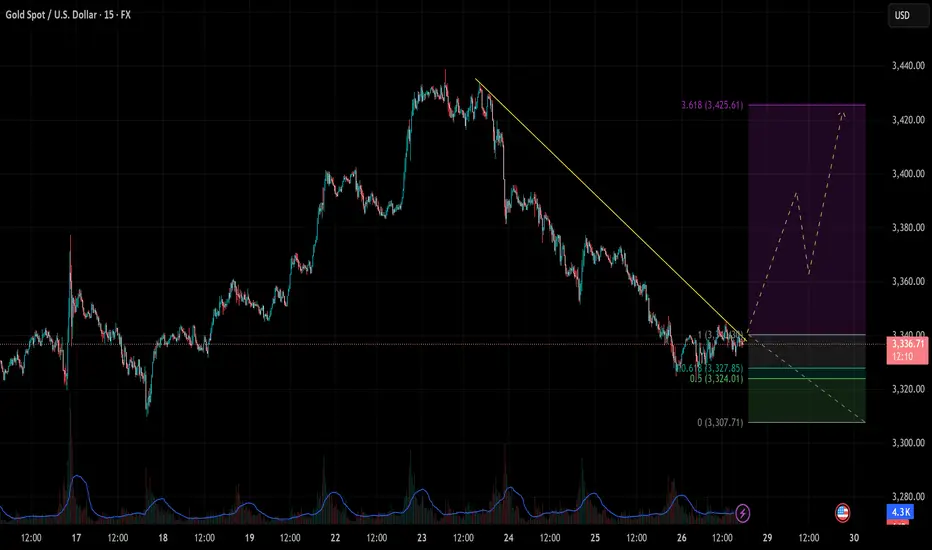
[XAUUSD] Gold Price Analysis July 28Symmetrical Channel Structure and High-Probability Trading Strategies
In today’s trading session (July 28), the XAUUSD 15-minute chart reveals a clear symmetrical channel pattern, indicating a technical correction after a previous strong uptrend.
1. Trend Structure
Phase 1 (July 18–23): Price moved within an ascending channel, forming higher highs and higher lows — a clear bullish structure.
Phase 2 (July 23–26): After peaking, price reversed into a descending channel, establishing a bearish sequence of lower highs and lower lows.
Currently, price is consolidating near the lower boundary of the descending channel, testing short-term support.
2. Key Support and Resistance Levels
Price Level
Technical Significance 3,360 – 3,365
Key resistance zone – top of descending channel 3,345
Dynamic resistance – EMA21 on M15 3,320 – 3,315
Crucial support zone – lower boundary of channel 3,300
Psychological support & prior swing low (July 10)
3. Price Action and Indicators
Volume has gradually decreased, signaling potential weakening of selling momentum.
RSI on M15 has rebounded from the oversold zone, currently moving above 40, suggesting a short-term technical bounce.
EMA21 & EMA50 are still sloping downward, confirming short-term bearish pressure.
4. Intraday Trade Scenarios
✅ Scenario 1: Rebound Play from Channel Support
Entry: 3,320 – 3,325 (after bullish confirmation candle)
Stop Loss: Below 3,312
Take Profit: 3,345 – 3,355 (resistance zone & mid-channel)
⚠️ Scenario 2: Trend-Following Short from Resistance
Entry: 3,345 – 3,350 (if price rejects at EMA21 or channel resistance)
Stop Loss: Above 3,360
Take Profit: 3,320 – 3,310
5. Strategy Outlook
XAUUSD remains in a corrective bearish phase after a strong rally. As long as the 3,312 level holds, there’s potential for a technical rebound during the London–New York session. However, sellers remain in control unless price breaks and closes above 3,360.
Follow for more real-time gold strategies. Save this post if you found it helpful!

Analysis of technical prospects for gold prices!Market news:
In the early Asian session on Monday (July 28), spot gold bottomed out and rebounded. At the beginning of the session, it continued the decline of last Friday to around 3320. As the United States and Europe reached a trade agreement, the international demand for gold hedging further declined. However, the price of gold was supported by bargain hunting and quickly recovered most of the decline. It is currently trading around 3337 US dollars per ounce. As the global reserve currency, the trend of the US dollar is crucial to the price of gold. Last week, the US dollar index rebounded from a low of more than two weeks, significantly pushing up the cost of gold for overseas buyers. The progress of US-EU trade negotiations has become another major driver of the recent decline in London gold prices. Although the demand for hedging has been suppressed in the short term, geopolitical uncertainty still provides long-term support for gold. At the same time, the trend of global central banks buying gold provides a solid bottom support for gold.Looking ahead to this week, the economic calendar will provide several high-impact data releases. The Federal Reserve will announce its monetary policy decision after the policy meeting on July 29-30. On Friday, the US Bureau of Labor Statistics will release the July employment report. If the number of non-farm payrolls (NFP) increases by more than 100,000, it may indicate that the labor market is in good enough condition that the Fed can prioritize controlling inflation and supporting the dollar when making policies. If the new non-farm payrolls data reaches or falls below 70,000, the dollar may find it difficult to find demand before the end of next week and help gold gain bullish momentum.
Technical analysis:
Technically, the gold daily chart forms a continuous negative structure, and the New York closing price re-loses the key support of the MA10-day moving average at 3360 and the middle track of the Bollinger Band. The RSI indicator breaks through the middle axis and runs in a short-term ... Pay attention to the rebound repair after selling low opening at the beginning of the gold week. The main idea is to sell at a high price and buy at a low price as an auxiliary.
Today's analysis:
Gold rebounded after opening low in the Asian session. Gold continued to refresh the low point. Then gold was obviously still in a selling trend. Since gold is still in a selling trend, it will continue to sell to the end. Gold rebounded in the Asian session and continued to sell. Gold continued to sell under pressure in the Asian session. Gold waited patiently for 3350 to continue selling in the Asian session. Gold's 1-hour moving average continued to cross downward and arranged for selling. There was basically no obvious rebound in this round of gold's decline. Then gold was likely to continue the short selling trend after the rebound correction. The wave structure of gold's current decline remained intact. Gold continued to sell under pressure near the last low of 3350.
Operation ideas:
Buy short-term gold at 3309-3312, stop loss at 3300, target at 3340-3360;
Sell short-term gold at 3350-3353, stop loss at 3362, target at 3320-3300;
Key points:
First support level: 3320, second support level: 3306, third support level: 3292
First resistance level: 3346, second resistance level: 3358, third resistance level: 3467

Gold remains unchanged. Still weak.Last Friday, gold rebounded around 3373, but the bullish momentum was insufficient, and then it bottomed out and fell sharply. The price fell below the short-term rising trend line support. At present, the MA5-10 daily moving average is in a high dead cross short arrangement. On this basis, Quaid believes that gold can still be bearish now. At present, the Asian market continues to fluctuate downward in the early trading. Today, we will focus on the support of 3310-3300.
The short-term price is currently maintained at around 3335, which can be regarded as the watershed between long and short today. If the European session stabilizes above the MA50 moving average, the trend will change to a certain extent. Now we still look at the bottom near 3300.
Operation strategy:
Short near 3340, stop loss 3350, profit range 3310-3300.

Gold is weak. It may break through next week.This week, gold rose and fell, rising for two consecutive days on Monday and Tuesday, and falling for three consecutive days from Wednesday to Friday. The weekly line finally closed with a small real body negative line with a long upper shadow.
Gold's trend this week was due to the strengthening of the US dollar and the progress in US-EU trade negotiations, which hit the safe-haven demand, leading to a decline in gold prices.
Next week, focus on multiple time points that may trigger market trends, including the Federal Reserve's decision, non-agricultural data, the August 1 tariff deadline, and the economic and trade talks between Chinese representatives in Sweden and the United States. These events may set the tone for the market in the second half of the year and need to be paid attention to.
At the beginning of this week, we focused on the triangular convergence pattern formed by the high and low points since 3500 points. On Tuesday, gold broke through the pattern upward, but failed to stand firm on Wednesday. Instead, it fell to form a false breakthrough, and on Friday it fell to the lower edge of the triangular convergence range. However, from the perspective of the international futures market, the overall situation is still in the triangular convergence pattern and has not achieved an effective upward breakthrough. Based on this, we need to continue to keep a close eye on the changes in the triangle convergence pattern next week. The direction of its next breakthrough will have an important impact on the short-term trend.
Operation strategy:
Short near 3350, stop loss 3360, profit range 3320-3315. If the price continues to fall, you can hold a small position, and the area near 3300 is likely to be touched.
XAUUSD BearishGold, Price have been moving side-ways taking out internal highs & lows inside PREMIUM, now we have clean lows that are still intact with equal lows near equilibrium. I would like to see price dropping low to take out liquidity resting below those previous lows and drop into DISCOUNT.

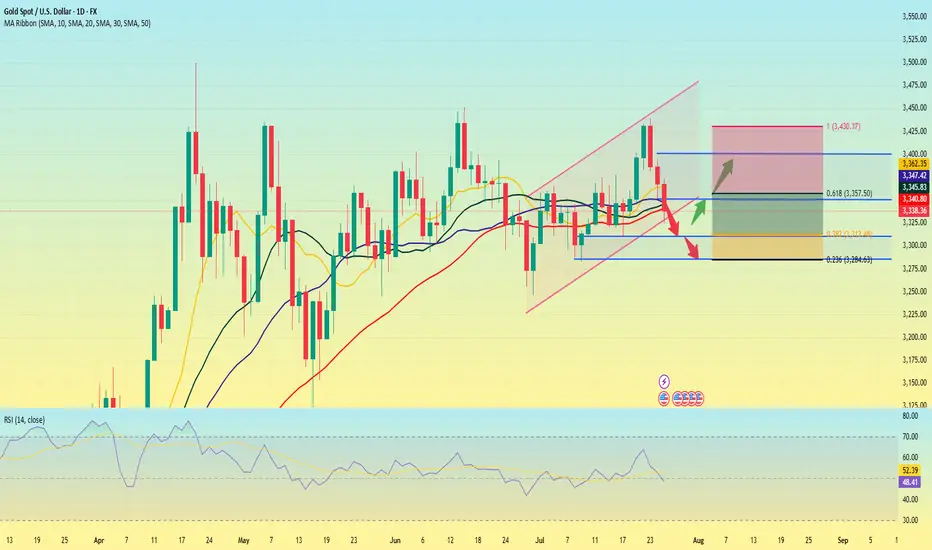
Analysis of gold price trend next week!Market news:
This week, international gold recorded its biggest weekly decline in a month. Spot gold turned sharply lower after a sharp rise and finally closed lower. Signs of progress in US-EU trade negotiations hit the safe-haven demand for London gold prices. Geopolitical situation is also a factor in the downward trend of gold prices. On the 25th local time, Tahir Noonu, a senior Hamas official, said that Hamas was absolutely positive about the efforts of the relevant mediators, but was surprised by the US statement. Before the United States and the European Union made progress in trade negotiations, fund managers raised their bullish bets on gold to the highest level since April this year. The trade war has pushed gold prices up 27% this year. Although the easing of trade tensions will weaken safe-haven demand, gold has also been supported by strong buying from central banks.Next week, international gold prices will focus on US-EU and US-China trade negotiations. If the negotiations are optimistic, gold prices may continue to test the $3,300/ounce mark; in addition, focus on the Federal Reserve's resolution. After Trump's visit to the Federal Reserve headquarters, whether the Federal Reserve will maintain its independence will be highlighted in this resolution. Non-agricultural data will also be released on Friday, which needs attention.
Technical Review:
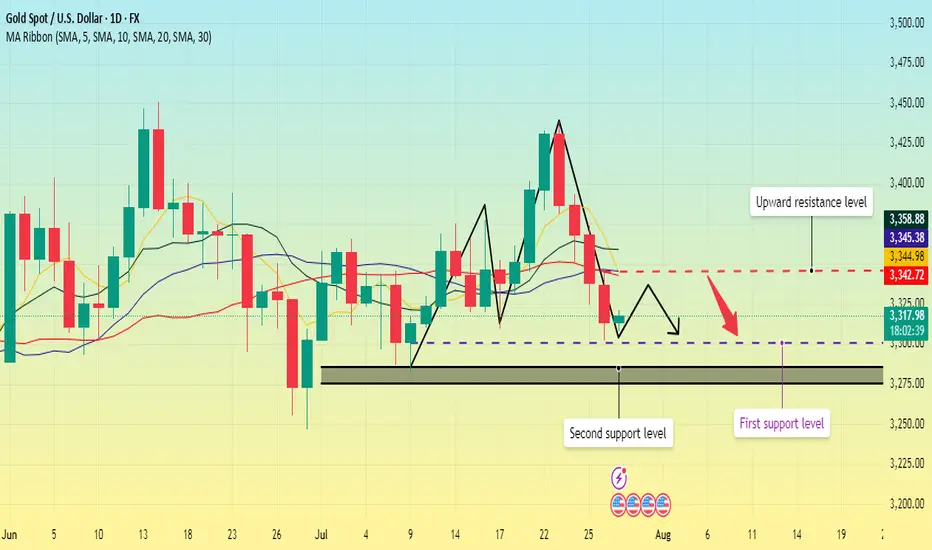
From the weekly gold level, gold is still in a wide range of 3500-3120. It has been fluctuating for ten weeks. The Bollinger Bands are gradually shrinking. MA5 and MA10 are running horizontally, indicating that gold fluctuations will continue. This time, gold stabilized and rose from 3247 to 3438 and then fell back. The current short-term range is 3247-3438! Next week, pay attention to the range of fluctuations and choose a new direction after the narrowing. The daily level is currently in the 4th wave adjustment. There is a high probability that there will be a 5th wave rise after the adjustment, and then a large-scale ABC adjustment will be started. At present, there are two changes in the structure of the 4th wave, one is the triangle contraction and the other is the ABC structure. No matter how it runs, the market outlook is to wait for low-level long positions to see the 5th wave rise. In the short term, gold is still oscillating and selling.
Next week's analysis:
Gold is still adjusting, but it has basically adjusted in place. The current daily price has also adjusted to the key support level of 3300. Similarly, the four-hour chart just stepped back to the upward trend line support, which is the short-term long order entry. Buy above the 3300 mark next week! Next week, gold is expected to further test the 3310-3280 support level. Gold at the 4-hour level peaked at 3438 and then fell back. It has now formed a unilateral trend. The K-line is under pressure from the 5-day moving average and continues to set new lows, and breaks the short-term upward trend line. The Bollinger band opens downward and diverges, and the MACD water cross diverges downward to underwater, indicating that the current gold trend is in an absolute weak position! Next, gold will continue to test the support near the previous low of 3300. If 3300 is not broken, gold buying will continue to have momentum. If 3300 is broken, the short-term rise will end, and the subsequent rebound will basically be just a correction. However, the current 4-hour green column shows signs of shrinking volume, so it is not easy to sell at a low level. Try to sell after the rebound correction, or buy at a low level!
Operation ideas:
Short-term gold 3305-3308 buy, stop loss 3297, target 3350-3370;
Short-term gold 3350-3353 sell, stop loss 3362, target 3320-3300;
Key points:
First support level: 3320, second support level: 3309, third support level: 3300
First resistance level: 3346, second resistance level: 3360, third resistance level: 3375

Gold is weak. Will it explode next week?Gold prices failed to stabilize above $3,400 after a bullish breakout this week. The technical outlook highlights the recent indecision of gold bulls.
In the first two trading days of this week, spot gold prices rose by 2.4%, but the cumulative decline in the last three trading days of this week reached nearly 3%. The sharp fluctuations this week were due to the positive progress in Trump's trade negotiations, and the rebound in market risk appetite, which hit the safe-haven demand for gold.
Looking at next week, the economic calendar will provide several high-impact data releases. The Federal Reserve will announce its monetary policy decision after the policy meeting on July 29-30; the US Bureau of Labor Statistics will release the July employment report; and some important news such as the US-China trade negotiations may trigger the next major move for gold.
From a technical perspective, the current market short-term technical outlook highlights the hesitation of gold buyers. The daily chart shows that the RSI is still slightly below 50, and gold prices have difficulty staying away from the 20-day and 50-day MAs after breaking through these two levels earlier this week.
On the upside, 3450 constitutes the first resistance for gold prices. If it breaks through this resistance, gold prices will most likely hit the 3400 integer mark again.
On the downside, if gold prices remain below 3340, technical sellers may still be interested. In this case, 3310 can serve as the first support level, followed by the second support level near 3285.
A new week is about to begin, and I wish all traders good luck.
GOLD (XAU/USD) SHORT TRADE PLAN
July 25, 2025
Trade Overview (My setup)
- Direction: Short (SELL)
- Entry Price: $3,330
- Take-Profit: $3,270
- Stop-Loss: $3,370
- Lot Size: 0.18 lots (18 oz)
- Risk: $720
- Reward: $1,080
- Risk/Reward Ratio: 1.5 : 1
Technical Analysis Supporting the Bearish Bias
1. Price Structure & Trend
- Descending channel observed on the 4H chart - strong short-term bearish signal.
- Series of lower highs and lower lows confirms bearish trend.
- Price is testing $3,325-$3,300 support - breakdown opens downside to $3,270-$3,250.
2. Key Support/Resistance Zones
- Key support: $3,300 being tested.
- Resistance: $3,360-$3,370 zone - logical stop-loss location.
3. Indicator Confirmations
RSI (4H): ~35-40, bearish territory, no bullish divergence.
Moving Averages: Price below 50 EMA and 200 EMA - bearish crossover.
MACD: Bearish crossover, histogram confirms selling momentum.

How can we seize the golden opportunity steadily and accurately?Yesterday, gold showed a trend of falling first and then rising to bottom out and rebound. After falling back to 3351, it quickly rebounded to around 3377. The overall fluctuation rhythm was highly consistent with our prediction. We accurately grasped the opportunity to arrange long orders and promptly notified the high position to reduce positions and make profits. The rhythm was properly controlled and we gained good returns.
From a technical point of view, the four-hour line fell and rebounded, and the short-term short momentum slowed down. Although it has not completely turned into a long structure, the short trend is no longer valid. At this stage, we will not look at new lows for the time being, and the operation is mainly based on the main long idea. At the daily level, pay attention to the long-short watershed of 3385. If it breaks through this level, it is expected to open up the upward space and look to 3392 or even above 3400; if it does not break, the market may continue the shock and wash pattern. Pay attention to the support below around 3365-3350. As long as it does not break and stabilizes, you can still choose to arrange low and long positions. In the short term, pay attention to the breakthrough of the rebound high point 3377. If it successfully stands firm, it will further enhance the continuity of the long position.

Gold Trade SetupI will risk!!!
It seems we are near at the end of correction wave...
The first target R/R is 2 and the second is 4...
