Gold May Dip Short-Term Amid Cautious Fed & Geopolitical Calm📊 Market Overview:
• Gold saw a slight correction as Middle East tensions eased following a ceasefire agreement between Iran and Israel.
• A weaker USD and lower U.S. Treasury yields offered some support to gold prices.
• However, the Fed’s cautious stance on rate cuts and upcoming testimony from Chair Powell continue to weigh on gold sentiment.
📉 Technical Analysis:
• Key Resistance Levels:
– $3,350–3,360 (21/50-day SMAs)
– $3,370–3,385 (Fibonacci zone and swing highs)
• Nearest Support Levels:
– $3,316–3,320 (intraday lows and psychological level)
– $3,300–3,305 (strong support), followed by $3,245–3,275 if broken
• EMA 09: Price is currently trading below the 09 EMA, indicating a short-term downtrend.
• Candlestick Pattern / Volume / Momentum:
– The 15-minute chart shows slight recovery signals, but with weak momentum; RSI is below average and MACD is slightly bearish.
– No strong reversal candlestick pattern detected; small-bodied candles (doji) suggest indecision and selling pressure remains near $3,340.
📌 Outlook:
Gold may decline slightly in the short term, potentially retesting the $3,316–3,320 support zone. A rebound is possible if the USD weakens further or the Fed unexpectedly signals rate cuts.
💡 Suggested Trading Plan:
🔻 SELL XAU/USD at: $3,335–3,340
🎯 TP: $3,330 - $3,325
❌ SL: $3,345
🔺 BUY XAU/USD at: $3,318 – 3,315
🎯 TP: $3,320 - $3,325
❌ SL: $3,312
Goldprice

The current price of gold is 3330-3335, go short directly!Gold rebounded after hitting the bottom of 3295. At present, gold is just a rebound, not enough to reverse directly. Gold rebounds and continues to be short. After all, the daily line has fallen continuously, so the short momentum of gold is still there. In the short term, the rebound of gold is just a repair after oversold. Gold is currently priced at 3330-3335 and is directly short.
The 1-hour moving average of gold continues to be arranged in a short position downward. After gold fell below the previous low of 3340 yesterday, gold has not been able to rebound again. In the short term, 3340 has become the key to long and short positions. In the short term, gold rebounds below 3340 and continues to be shorted. If gold breaks through and stabilizes at 3340 again, then gold may start to fluctuate again. Before breaking through 3340, gold is still weak and continues to maintain a short trend.

4‑Hour Analysis – Supply & Demand Overview 25 June 20251. Market Structure
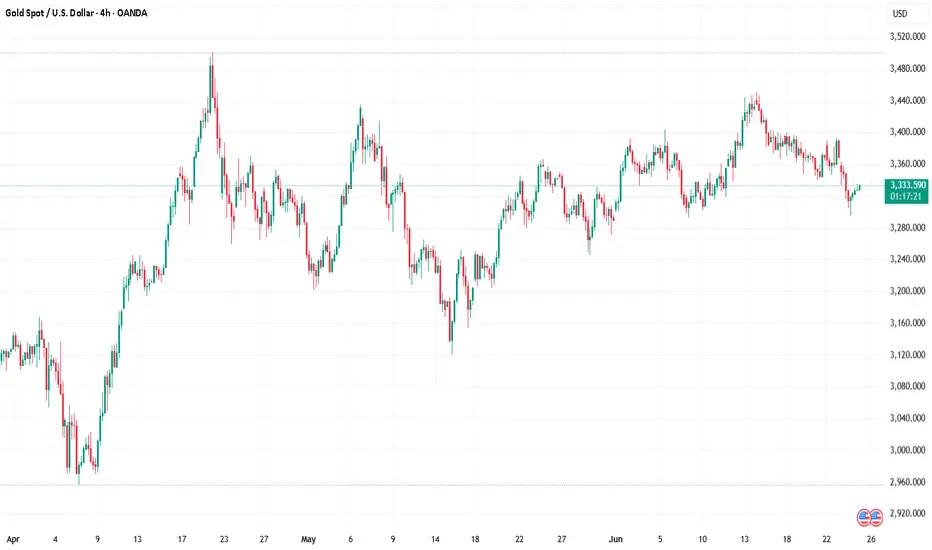
XAU/USD currently trades at 3333 and shows clear higher highs and higher lows on the 4‑hour timeframe—reflecting a bullish structure backed by recent swing lows above 3300 and highs nearing 3365
2. Key Demand Zones
DZ1: 3320–3330 – Consolidation region with multiple wicks and price rejections; confirmed buying volume (aligned with ML and 50‑EMA confluence)
DZ2: 3300–3310 – A deeper base with strong reversal history; aligns with psychological round number and 0.382 Fib of recent up-swing
3. Key Supply Zones
SZ1: 3350–3360 – Upper resistance cluster formed by repeated spikes and quick rejections; overlapping 0.5–0.618 Fib from the last retracement
SZ2: 3380–3400 – Broader distribution area with past failed breakouts; significant liquidity shelf noted
4. Why These Zones Matter
Demand zones act as value entry areas where institutional and retail buyers absorb selling pressure, usually followed by swift reversals.
Supply zones represent distribution pockets where buy orders face strong pushback, often leading to corrective moves.
5. Bias
✅ Overall Bias – Bullish (4‑hour) thanks to structural trend (HH/HL), price above key previews like 50‑EMA & 20‑EMA, and consistent demand responses. Only a break below 3320 invalidates bullish tilt.
⚡ 1‑Hour Intraday Setups (Aligned with Bullish 4H Bias)
Buy the Dip (Main Entry)
Zone: 3320–3325
Context: Retest of DZ1, tagging the 4H structure and 1H ascending trendline.
Confirmation: Bullish pin bar or long tail candle + volume surge.
Channel Retest Quick‑Entry
Zone: 3330–3335
Context: Price remediates after a clean breakout above the 1‑hour descending channel.
Confirmation: Trendline bounce or bullish engulfing on the first test.
Supply‑Fade (Aggressive)
Zone: 3350–3355
Context: Approach to SZ1—plays the bearish reaction in a bull market context.
Confirmation: Bearish pin bar, upper wick exhaustion, and slim 1H RSI divergence.
📈 Chart Snapshot & Confluences
DZ1 (3320–3330) aligns with the 0.382 Fib and ascending 1‑hour trendline.
Quick-entry zone (3330–3335) sits close to the 1‑hour 50‑EMA, offering dynamic multi‑timeframe confluence.
SZ1 aligns with higher-term fib and previous supply peaks.
📝 Ready Summary
XAU/USD – 4H Structure: Bullish – higher highs & higher lows.
Major Demand Zones: 3320–3330 (primary), 3300–3310 (secondary).
Major Supply Zones: 3350–3360 (hot zone), 3380–3400 (upper resistance).
Bias: Bullish as long as price holds above 3320.
Intraday Trade Zones:
Buy the Dip: 3320–3325 – look for pin‑bar/volume bounce.
Quick Re‑Entry: 3330–3335 – trendline or 50‑EMA test confirmation.
Supply Fade (Aggressive): 3350–3355 – bearish rejection setup.
Pro Tip: Focus on clean price action signals (wicks, engulfings, volume) within entry zones and confirm with multi‑timeframe confluences (Fib, EMA, trendlines).
Gold is under pressure. Will the trend change?Information summary:
The easing of tensions in the Middle East is the main reason for the suppression of gold. Risk aversion has weakened, and the market has entered a risk-taking mode. Gold prices are well supported near $3,300.
Powell released an important signal: The market expected Powell to strongly refute the possibility of a rate cut, but he remained on the sidelines. The market still generally believes that the July 29-30 meeting is unlikely to initiate a rate cut, and the first rate cut is expected to be in September.
Market analysis:
Gold has fallen for seven consecutive weeks, which has changed the current bull structure in stages, so there is no doubt that gold is expected to fall back as a whole. The early decline was near 3355, which is the current long-short watershed of gold. As long as the adjustment does not break through the 3355 position, the overall short-term adjustment pattern of gold will not change.
The early Asian market did not continue to retreat, but the short-term rebound had a long buying force accumulation, but as long as it did not break through 3355, the market trend was still weak, and it was adjusted by low-level shock correction. Today, there is a high probability of movement around the falling range. The short-term support below is around 3290. If this position is lost, it may touch the turning point around 3275.
Operation strategy:
Go long when the price falls back to around 3315, stop loss at 3305, and profit range 3345-3350.

Gold Forming Triple Top – Correction Ahead?Gold is currently showing a triple top pattern while holding at a key trendline support.
With geopolitical tensions easing, US inflation cooling off, and a potential Fed rate cut on the horizon, gold may be set for a correction.
A drop toward the $2,900/oz zone looks likely — this will be a critical support level. A break below it could trigger a long-term downtrend.

Gold today high-altitude low-multiple operation
📌 Gold news
On Tuesday, the spot gold price plummeted, hitting a two-week low. The main reason was that Iran and Israel announced a ceasefire, which suppressed the demand for safe-haven gold. In addition, Fed Chairman Powell made hawkish remarks, which also hit the gold price trend. Short-term long-short game will focus on the PCE inflation data to be released by the United States. If the economic data performs poorly or inflation continues to fall, it may still provide a medium-term rebound opportunity for gold.
📊Comment analysis
Yesterday, gold was weak overall, and the decline and rebound were limited. It fell directly from around 3357 to 3295, and then rebounded according to the news. It ran around 3326 in the morning. From a technical point of view, the daily low trend line support is around 3290, the 4-hour long lower shadow line bottomed out, and three consecutive positive rebounds, the daily line supports the lower track of the Bollinger band, and the Bollinger band tends to be parallel. There is no sign of opening downward, so the short-term decline of gold prices is limited. Consider paying attention to the support of 3294 during the day, and mainly use this position for defense and low long. Pay attention to the important suppression of the middle track 3363 above, and mainly short.
💰Strategy Package
Focus on the support near 3316-3317 in the short term, rely on this position to go long, stop loss 3307, take profit near 3345, and break 3363. If it falls strongly below 3294, then don't consider going long during the day.
Gold operation strategy: long near 3316, stop loss 3307. Take profit 3345
⭐️ Note: Labaron is not 100% correct here, only a steady operation idea, large warehouse for trend, small warehouse for wave, control the proportion by yourself, there is no unprofitable investment, only unsuccessful orders, whether to make money depends on the timing of buying up and buying down, making money depends on opportunities, investment depends on wisdom, and financial management depends on professionalism.

The latest analysis of gold trend on June 25From the perspective of technical analysis, based on the daily level, the gold price is expected to be further under pressure in the future. At the daily level, the current focus is on the 3370 area resistance. The 1-hour line shows that the short-term pressure is at the position of the previous upward trend line retracement. Due to the short-term market volatility and decline, it is necessary to temporarily focus on the current downward trend line area resistance, which is also the daily and four-hour resistance area. The 3330-3315-3310 area will be followed below. If the market is in an extremely weak state, the gold price is expected to test the 3330-3270 area. From the indicator signal, the RSI oscillation around 50 shows that the market is balanced between long and short forces, the MACD red column shrinks, and the fast and slow lines flatten, indicating that the bullish momentum is weakened; the KDJ high dead cross shows that the short cycle may be corrected.
Comprehensive technical analysis, today's short-term operation strategy for gold is mainly rebound short selling, supplemented by low long selling. The short-term focus on the upper side is the 3370 - 3380 resistance line, and the short-term focus on the lower side is the 3330 - 3315 support line.

Dark moment for prices. Will it fall even lower?Information summary:
Due to the ceasefire in the 12-day war between Iran and Israel, market risk appetite has rebounded, demand for safe-haven assets has declined, and gold prices have plummeted. As an interest-free asset, gold prices are under pressure against the backdrop of declining risk aversion, but there is still buying support at low levels.
Investors are currently focusing on the speech of Federal Reserve Chairman Jerome Powell at a hearing of the House Financial Services Committee. Powell has been cautious about whether to cut interest rates in the near future.
Market analysis:
The current market selling sentiment has increased significantly, and for gold, falling has become the only path. It seems that the market has lost hope in gold, and the current gold price has fallen to around 3295, then rebounded slightly, and is currently fluctuating around 3313. The break of 3300 declares that gold still has further room to fall, and from the trend point of view, it is likely to continue to fall.
The current trend shows that the important support is around 3285. It is possible that it will fall directly to the current position. The Fed is still speaking, and it is unpredictable whether it will cause drastic fluctuations in gold in the future. However, from today's trend, shorting is the best solution at present, and the upper resistance position is in the range of 3315-3325.
Operation strategy:
Short around 3320, stop loss 3330, profit range 3290-3285.

Gold prices rose as dollar data was not good
📌 Gold information:
Gold prices plunged on Tuesday as a ceasefire was declared in the 12-day war between Iran and Israel, market risk appetite rebounded, and demand for safe-haven assets declined. The ceasefire news pushed global stocks higher, while oil prices fell to a two-week low as concerns about supply disruptions eased. The plunge in crude oil prices also further suppressed gold's inflation hedging appeal. As an interest-free asset, gold prices are under pressure against the backdrop of waning risk aversion, but there is still buying support at low levels.
Investors are currently focusing on Federal Reserve Chairman Jerome Powell's appearance at a House Financial Services Committee hearing. Powell has been cautious on whether to cut interest rates in the near future.
📊Comment Analysis
The current market selling sentiment has increased significantly, and for gold, falling seems to be the only way to go. Today, whether you look at rebound short or low long, basically you will not have a chance, that is, falling, it seems that the market has lost hope in gold, and the current gold has fallen to 3295, and the break of 3300 declares that gold has further room to fall. From the trend point of view, it is likely to fall now!
The further strong support on the current trend line is around 3274, and it is not ruled out that it will fall directly to the current position. At present, the Federal Reserve is still speaking, and whether it will cause drastic fluctuations in gold in the future is still unpredictable, but from today's trend, shorting is already the best solution at present, and the upper resistance can first look at 3330!
💰Strategy Package
Gold: Rebound 3325-3335 short, stop loss 3345, target 3290-3300!
⭐️ Note: Labaron hopes that traders can properly manage their funds
- Choose the lot size that matches your funds
XAUUSD - Prop firm or your own account? - Trading Psychology"$100K Funded? Or $1K account you own?? Welcome to the Inside Battle of Every Trader"
You want capital, freedom and win big.
But the question is: do you do it with your own money, or someone else’s?
You’ve got the $100K funded dream on one side. Big leverage, strict rules, payout drama.
And on the other side? Your own $1K account. Zero limits, zero support, and a whole lot of emotional damage.
This is a breakdown of what really happens behind both paths — the adrenaline, the self-sabotage, the mind games, and the payouts that sometimes never come.
The Prop Firm Path: Pass, Survive, Then Pray
Phase 1: You trade with hunger.
You’ve got the goal in sight, and every move is calculated. You’re alert, focused, mechanical. The structure helps. The rules feel like a challenge. Everything feels possible.
Phase 2: You trade with fear.
Now you’re tiptoeing. The target’s smaller, but the pressure is suffocating. Hesitation.Overthink. You play defense — and that’s when you lose. You stop executing your edge and start trading to avoid failure.
Funded: The real test begins.
You go live, you trade well, you hit payout… and suddenly the firm has a problem. A new rule is “suddenly” enforced. A clause is reinterpreted. A delay happens. You’re told to wait. Or worse — your account is shut with no warning.
That’s the part no one prepares you for: the waiting, the silence, the mental snap.
Passing isn’t the end. It’s barely the middle.
✅ So, Should You Go Prop? Here's What You Need to Know
Yes — if you’re ready to treat this like a hostile contract.
If you’re trading a prop account, you are trading their rules, their terms, their timing. You are not a partner — you are a performer. And they are very comfortable pulling the plug.
If you do it:
• Be colder than the system.
• Read every rule twice.
• Trade Phase 2 like a surgeon — no ego, no rush.
• And never treat a payout like it's guaranteed — treat it like a fight you have to win more than once.
You don’t just pass. You survive.
And if you’re not ready to survive, stay out.
🚨 Do not forget — It’s Simulated Capital. And That’s the Game.
Let’s not pretend it’s hidden:
You’re NOT TRADING REAL MONEY. You’re executing on a simulated account that mirrors real conditions — nothing more.
When you get paid, it’s not because you “grew” capital. It’s because you performed better than the masses who failed their challenges and fed the payout pool.
This isn’t shady. It’s the model — and it works because most traders lose.
So don’t delude yourself into thinking you’re managing funds.
You’re monetizing discipline inside a challenge-based system.
And if you know how to work that system? You get paid.
If you don’t? You become someone else’s payout.
🔓 Trading Your Own Money: Real Freedom or Emotional Damage?
With your own capital, there’s no one watching — and no one helping.
You set the rules. You decide how aggressive, how cautious, how chaotic.
But the second you click “Buy,” your psychology comes for you like a debt collector.
Because real trading isn’t what’s on the screen — it’s what’s happening between your ears.
You lose your money, you lose your confidence.
You win big, and suddenly you think you’ve figured out the market — until the market slaps you for it.
There’s no one to blame, and that makes it ten times harder.
But here’s the part no one can take away from you: every lesson is yours.
Every win is clean. Every loss hits deep. And if you make it — you really made it.
💡 How to Make Self-Funded Work for You
✅ Start with small capital — but also invest in your trading education.
Join a group that teaches you how to trade, not signal groups that just give you orders when to buy or sell, without explaining why.
✅ Join a real trading community.
Surround yourself with people who post actual breakdowns — who teach, not flex.
Avoid ego chats. Avoid circus chats. Find people who show the why, not just the entry.
(If you’re reading this, you already found the right space.)
✅ Focus on fixing mistakes — not faking wins.
Nobody cares how many pips you caught if you blew 5 trades getting there. Get real about your risk management and lot size.
✅ Learn to stop after a win.
Don’t feed your dopamine. Protect your equity. Walk away while you’re still in control.
✅ Respect your losses. Don’t chase them.
Red days don’t destroy traders. Revenge trading does. Stop. Reset. Come back sharper.
✅ If you’re not paying yourself yet, don’t panic.
Some seasons are for building, not cashing out. Don’t force results just to feel good — let the system earn before it pays.
🔄 The Hybrid Advantage: Rent the rules. Own the skill.
Some traders don’t pick a side.
They use prop firms like a hired weapon — fast, effective, disposable and
Personal accounts like a vault — protected, scalable, sacred.
They switch between them based on market conditions, mental load, and long-term goals.
You don’t need to be loyal to a style just be loyal to your results.
🧠 Final Word:
Trading becomes real, sustainable, and successful only when your mind is at peace with the path you chose.
If you wake up anxious about your account — if you feel pressure before you even open the chart — that’s not discipline, that’s misalignment.
This doesn’t mean trading should feel easy. But it should feel right.
You should wake up curious to read price, not terrified to take a trade.
Whether you trade $100K or $1K, the real account is always in your head.
You should feel like this work belongs to you — not like you’re trying to survive someone else’s idea of success.
Whether you trade with a prop firm or your own account, or both, the goal is the same:
Mental clarity. Emotional control. Strategic confidence. You’ll know you’re on the right path the moment the stress fades — and the obsession becomes patience, structure and joy with success.
If this lesson helped you today and brought you more clarity:
Drop a 🚀 and follow us✅ for more published ideas.
Gold Trading Strategy June 24Quite surprised with the price gap down at the beginning of the day. A sweep to 3333 and recovery to increase again in the Tokyo trading session.
This recovery completely breaks the market's bullish wave structure.
3363 and 3335 are paying attention in today's Asian and European trading sessions. This area can be traded short-term in the sideways range. The SELL area pays attention to the opening gap at 3368.
The upper range has some adjustments compared to yesterday in the direction of decreasing prices, so the SELL range 3386 and 3410 is paid attention to for trading.
Resistance: 3363-3368-3386-3410
Support: 3335-3322-3296
Good trading signal
BUY GOLD 3323-3321 Stoploss 3318
SELL GOLD 3363-3365 Stoploss 3370

XAUUSD Beginning of a Trend Reversal? Bearish Move IncomingGold is showing signs of potential downside pressure on the 4-hour chart. After a rejection from the upper volatility band and a failure to sustain bullish momentum above the dynamic EMA cloud, price has rolled over and is now trading below the midline support area.
🔻 Bearish Structure Developing:
Price rejected strongly from the upper gray zone (Resistance band).
A new lower high has formed, aligning with bearish market structure.
Candles are trading under the red-to-blue transition EMA ribbon, indicating increasing bearish sentiment.
🎯 Trade Setup:
Entry: Near 3,365
SL: Above the recent high near 3,406
TP: Targeting the lower band support around 3,300 – 3,323

Continue to short after the rebound on 6.24Judging from the current market trend, the upper short-term resistance is around 3343-48, the lower short-term support is around 3310-15, the short-term long-short strength watershed is 3300-05, the daily level is under pressure and continues to see suppression and adjustment, and the main tone should actually be rebound shorting.
Gold operation strategy:
Gold rebounds to 3343-48 and shorts, stop loss 3356, target 3317-3323, continue to hold if it breaks;

Gold Pulls Back to 3332 Before Mild Rebound📊 Market Overview:
This morning, gold dropped sharply to $3,332/oz, marking the lowest level in recent sessions, due to profit-taking after the early-week rally and a slight recovery in the USD.
However, dip-buying interest returned near key support, pushing the price back up to around $3,350/oz.
The market remains sensitive to Middle East geopolitical headlines and comments from Fed officials scheduled throughout the week.
📉 Technical Analysis:
• Resistance: $3,360 – $3,370
• Support: $3,332 – $3,340 (tested this morning)
• EMA 09: Price is currently below EMA09 ($3,355) → short-term trend remains slightly bearish
• Momentum / Volume / Candlesticks:
o H1 candle shows a bullish hammer formation at $3,332 → signal of potential short-term rebound.
o RSI recovered from oversold (<30) to ~42 → mildly positive signal.
o StochRSI indicates short-term buying pressure, but a break above $3,355 is needed to confirm a reversal.
📌 Outlook:
Gold may see a mild recovery toward the $3,360–3,370 area if buying interest holds near the $3,330 support. However, failure to break above $3,370 could lead to a pullback during the US session.
💡 Suggested Trading Plan:
🔻 SELL XAU/USD at: $3,365–3,370
🎯 TP: $3,345 (~20)
❌ SL: $3,375
🔺 BUY XAU/USD at: $3,332–3,340
🎯 TP: $3,355 (~20)
❌ SL: $3,325

XAU/USD) Bullish reversal analysis Read The captionSMC trading point update
Technical analysis of Gold (XAU/USD) on the 30-minute timeframe, based on technical signals and price action behavior. Here's the breakdown
---
Gold Bullish Reversal Setup – Targeting 3,384
---
Key Technical Highlights:
1. Support Zone & Price Reaction:
Price has tested a strong horizontal support level (highlighted in yellow).
Multiple bullish rejection wicks indicate buying pressure at this zone.
The green arrows show successful support bounces, hinting at bullish intent.
2. Trendline Analysis:
Price bounced near the lower boundary of the falling wedge/downtrend channel.
An uptrend line convergence supports potential reversal.
A breakout above the short-term descending trendline is indicated.
3. EMA & Target Projection:
EMA 200 at 3,364.33 may act as dynamic resistance, the next short-term hurdle.
Target zone projected at 3,384.04, offering a potential move of +65.67 pts (~1.98%).
4. RSI Indicator:
RSI(14) is oversold (~29.93), signaling a potential reversal.
A bullish crossover may be forming, supporting upward momentum.
---
Trading Plan:
Entry Zone: Near current support area around 3,325
Target: 3,384
Stop Loss (Suggested): Below 3,300, under support structure
Risk/Reward: Favorable based on support hold and breakout projection
Mr SMC Trading point
---
Conclusion:
This setup suggests a short-term bullish reversal from a key support area, with confirmation likely if price breaks above the descending trendline and clears the 200 EMA.
Please support boost 🚀 this analysis)

War breaks out again? The latest analysis and layout of gold📰 Impact of news:
1. The ceasefire agreement reached earlier did not take effect, and Trump believed that both sides violated the agreement
2. Federal Reserve Chairman Powell delivered a speech 3 hours later
📈 Market analysis:
At the 4H level: the Bollinger Band opening is enlarged, the MACD indicator double-line death cross is downward, the short-selling force is strengthened, but the RSI indicator rebounds after being oversold. Overall, there are obvious signs of a rebound in gold prices. At the hourly level: the gold price is in a downward channel, the Bollinger Bands are expanding, the MACD indicator is dead cross and the red bars are converging, and the short momentum has weakened. The RSI indicator rebounds from oversold, and the demand for spot gold rebounds is obvious. Therefore, we still hold long orders near 3320 in the short term. Short-term operation suggestion: go long when it stabilizes at 3325-3315, pay attention to the resistance range of 3370-3380 on the upside, and consider shorting when encountering resistance and pressure.
🏅 Trading strategies:
BUY 3325-3315
TP 3335-3345-3365
SELL 3370-3380
TP 3340-3330
If you agree with this view, or have a better idea, please leave a message in the comment area. I look forward to hearing different voices.
OANDA:XAUUSD FX:XAUUSD FOREXCOM:XAUUSD FXOPEN:XAUUSD TVC:GOLD

Gold continues to decline, can it still change the trend?Information summary:
Will the Fed cut interest rates in July? The latest statements of Fed officials have released a heavy signal. Fed Governor Michelle Bowman said that as long as inflationary pressures remain moderate, she will support a rate cut at the next policy meeting in July. At the same time, Trump has continued to put pressure on the Fed.
Next, investors need to pay attention to the testimony of Fed Chairman Powell on the semi-annual monetary policy report to the House Financial Services Committee today.
Market analysis:
Gold fell sharply today, directly breaking the key support level of 3350. From a 4-hour perspective, the MA moving average shows a short trend arrangement, and the MA5\10 moving average crosses the MA20/30 long-term moving average downward, which indicates that the short force is dominant. In addition, the RSI indicator also fell rapidly and entered the oversold area, but this may also suggest that prices have a rebound trend in the short term.
I think the current market price decline trend is more obvious, unless there is significant positive data, the gold price may continue to decline.

Gold updateAfter the previous level was broken and structure shifted, we’re now entering a new phase of analysis.
In this fresh setup, we’re looking for buy opportunities — but not blindly!
As always, waiting for a clean pullback to the new zone and a solid entry signal.
Experience teaches us: real profits come from patience and planning.
Here’s my new gold analysis — high probability, low risk.
For detailed entry points, trade management, and high-probability setups, follow the channel:
ForexCSP

Weakness continues, continue to short the bear market📰 Impact of news:
1. Pay attention to Powell's speech in New York
2. Pay attention to geopolitical influence
📈 Market analysis:
Gold opened lower and showed a weak situation. The 1H moving average was arranged downward. In the short term, bears still occupied the main trend. From the 4-hour analysis of gold, the bulls still had repeated resistance before breaking down. Once it breaks down, the market will go further bearish. Pay attention to 3330 below. 3400 is still the key above in the short term. Only by breaking through the bulls can the rebound continue. In terms of operation, high-altitude and low-long are temporarily maintained. Pay attention to the short-term resistance of 3355-3365 above, and the support of 3340-3330 below. Pay attention to the breakthrough! Pay attention to Powell's speech in the New York session.
🏅 Trading strategies:
SELL 3370-3365-3355
TP 3340-3330
BUY 3340-3335-3320
TP 3345-3355-3365
If you agree with this view, or have a better idea, please leave a message in the comment area. I look forward to hearing different voices.
TVC:GOLD FXOPEN:XAUUSD FOREXCOM:XAUUSD FX:XAUUSD OANDA:XAUUSD

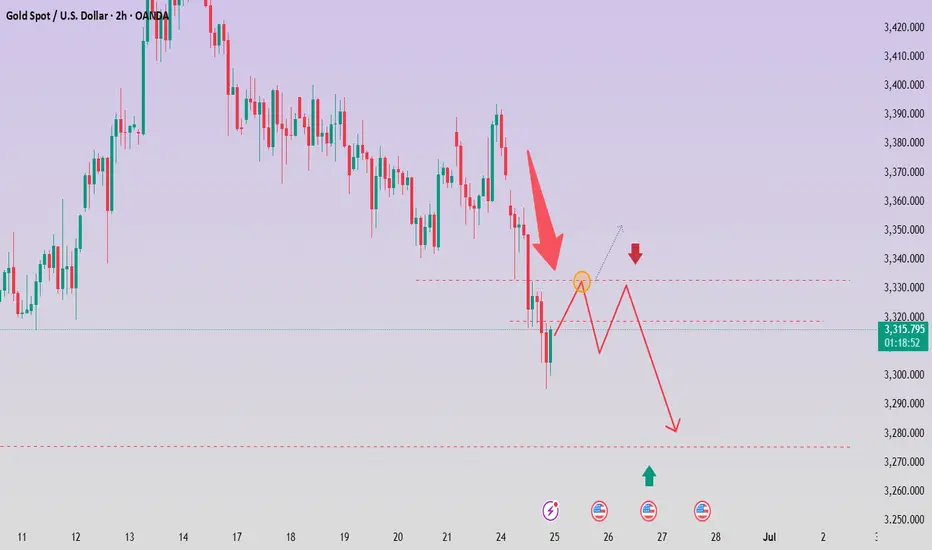
Bearish Continuation Pattern Detected on GOLD/USD Bearish Continuation Pattern Detected on GOLD/USD 📉
📊 Chart Analysis Summary:
The GOLD/USD chart shows a clear bearish continuation pattern, following a rejection from a major resistance zone.
🔍 Key Technical Highlights:
🔺 Resistance Zone:
Strong resistance at 3,420 – 3,440 USD, marked by multiple rejections (🔴 red arrows).
Price formed a Bearish Harmonic Pattern (likely a Gartley or Bat), suggesting reversal from this resistance.
🔻 Bearish Momentum:
After the pattern completed, price broke below the minor support structure and is currently forming lower highs and lower lows, indicating bearish structure.
📉 Support Level:
Strong horizontal support zone around 3,298 – 3,300 USD, marked as “TARGET.”
This area was previously tested (🟠 orange circles) and now projected to act as a target level again.
🔄 Minor Retracement Zone:
Expecting a minor pullback to 3,347 USD (purple line) before potential continuation downward.
This zone aligns with the previous support turned resistance (classic SR flip).
🎯 Target Projection:
Based on the bearish impulse and measured move, the projected target is around 3,298.758 USD, which coincides with the previous support zone.
📌 Conclusion:
The price action suggests a high-probability bearish continuation, targeting the 3,298 USD zone unless the price breaks and holds above 3,347 USD. Traders may consider selling on rallies with a confirmation of rejection at resistance.
📉 Bias: Bearish
📍 Invalidation: Break and daily close above 3,347 USD
📉
📊 Chart Analysis Summary:
The GOLD/USD chart shows a clear bearish continuation pattern, following a rejection from a major resistance zone.
🔍 Key Technical Highlights:
🔺 Resistance Zone:
Strong resistance at 3,420 – 3,440 USD, marked by multiple rejections (🔴 red arrows).
Price formed a Bearish Harmonic Pattern (likely a Gartley or Bat), suggesting reversal from this resistance.
🔻 Bearish Momentum:
After the pattern completed, price broke below the minor support structure and is currently forming lower highs and lower lows, indicating bearish structure.
📉 Support Level:
Strong horizontal support zone around 3,298 – 3,300 USD, marked as “TARGET.”
This area was previously tested (🟠 orange circles) and now projected to act as a target level again.
🔄 Minor Retracement Zone:
Expecting a minor pullback to 3,347 USD (purple line) before potential continuation downward.
This zone aligns with the previous support turned resistance (classic SR flip).
🎯 Target Projection:
Based on the bearish impulse and measured move, the projected target is around 3,298.758 USD, which coincides with the previous support zone.
📌 Conclusion:
The price action suggests a high-probability bearish continuation, targeting the 3,298 USD zone unless the price breaks and holds above 3,347 USD. Traders may consider selling on rallies with a confirmation of rejection at resistance.
📉 Bias: Bearish
📍 Invalidation: Break and daily close above 3,347 USD

XAU/USD 24 June 2025 Intraday AnalysisH4 Analysis:
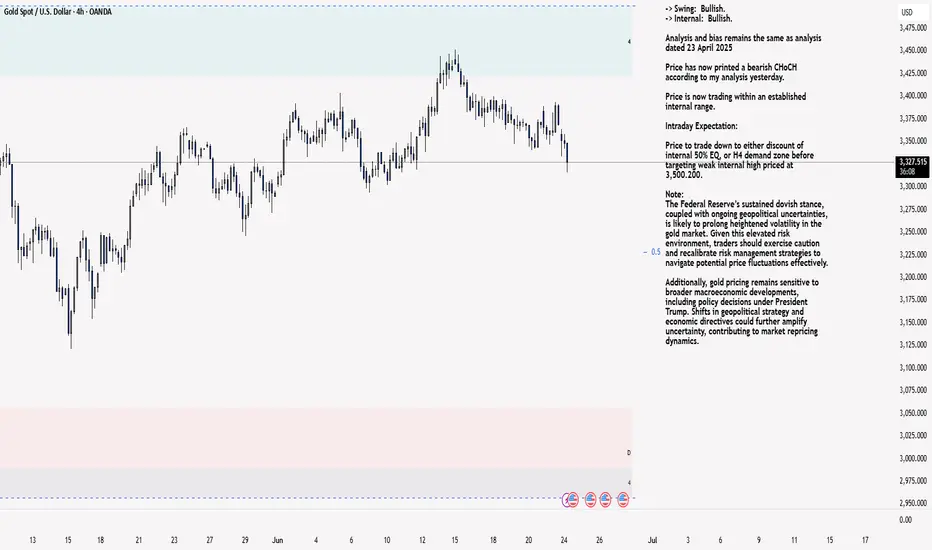
-> Swing: Bullish.
-> Internal: Bullish.
Analysis and bias remains the same as analysis dated 23 April 2025
Price has now printed a bearish CHoCH according to my analysis yesterday.
Price is now trading within an established internal range.
Intraday Expectation:
Price to trade down to either discount of internal 50% EQ, or H4 demand zone before targeting weak internal high priced at 3,500.200.
Note:
The Federal Reserve’s sustained dovish stance, coupled with ongoing geopolitical uncertainties, is likely to prolong heightened volatility in the gold market. Given this elevated risk environment, traders should exercise caution and recalibrate risk management strategies to navigate potential price fluctuations effectively.
Additionally, gold pricing remains sensitive to broader macroeconomic developments, including policy decisions under President Trump. Shifts in geopolitical strategy and economic directives could further amplify uncertainty, contributing to market repricing dynamics.
H4 Chart:
M15 Analysis:
-> Swing: Bullish.
-> Internal: Bullish.
Following previous high, and printing of bearish CHoCH, price has pulled back to an M15 supply zone, where we are currently seeing a reaction. Therefore, I shall now confirm internal high.
Price is now trading within an established internal range.
The remainder of my analysis shall remain the same as analysis dated 13 June 2025, apart from target price.
As per my analysis dated 22 May 2025 whereby I mentioned price can be seen to be reacting at discount of 50% EQ on H4 timeframe, therefore, it is a viable alternative that price could potentially print a bullish iBOS on M15 timeframe despite internal structure being bearish.
Price has printed a bullish iBOS followed by a bearish CHoCH, which indicates, but does not confirm, bearish pullback phase initiation. I will however continue to monitor, with respect to depth of pullback.
Intraday Expectation:
Price to continue bearish, react at either M15 supply zone, or discount of 50% internal EQ before targeting weak internal high priced at 3,451.375.
Note:
Gold remains highly volatile amid the Federal Reserve's continued dovish stance, persistent and escalating geopolitical uncertainties. Traders should implement robust risk management strategies and remain vigilant, as price swings may become more pronounced in this elevated volatility environment.
Additionally, President Trump’s recent tariff announcements are expected to further amplify market turbulence, potentially triggering sharp price fluctuations and whipsaws.
M15 Chart:
GOLD Intraday Chart Update For 24 June 2025Hello Traders, As you can see that GOLD fell sharply this morning due to Israel- Iran Cease fire scenario
Further more FED Chair POWELL Testifies Starts from Today and end on Tomorrow make sure to manage you trading accordingly
Right now GOLD is in Strong Bearish Trend only clear Breakout of 3368 level for the day below this market remains Bearish
All eyes on 3300 Psychological Digit for now if market breaks 3300 Successfully then it will move towards 3250 soon
Disclaimer: Forex is Risky

Gold, Will USA-Iran-Israel conflict affect it? The USA-Iran-Israel conflict can significantly impact gold prices. Gold is a safe-haven asset, so demand often rises during geopolitical tensions, pushing prices up
3406 gonna be first target for me, if it breaks this lvl with huge volume and FVG on 1h+ then most likely we will see ATH in near future
bearish scenario(lest likely) - price breaks down 3340 and close with nice volume and fvg on 1h+ which will open move all the way down to MO
