Gold Potential Bullish Breakout OpportunityGold seems to exhibit signs of overall potential Bullish momentum if the price action forms a prominent Higher High with multiple confluences through key Fibonacci and Support levels which presents us with a potential long opportunity.
Trade Plan:
Entry : 3.403
Stop Loss : 3328
TP 1 : 3478
Goldprice

“Gold Eyes 4‑Hour Demand at $3,322” 11 June 2025Gold (XAU/USD) has consolidated near $3,332 after an SMC-style structure sweep above $3,338, which likely captured institutional liquidity before a clean CHoCH and pullback toward a key demand zone at $3,322–$3,328. This demand zone held firmly—on a bullish 4‑hour candle—indicating underlying strength.
Key technical confluences:
CHoCH above $3,322 confirms bullish structure.
Price above 200‑SMA and mid-Bollinger Band on 4H.
RSI (~55‑60) and MACD showing resumed bullish momentum.
✅ 4H Entry Strategy Breakdown
Bullish Retest
Wait for price to revisit $3,322–$3,328 with bullish candle formation → enter long.
SL just below $3,312; targets at $3,345 and then $3,355.
Breakout Option
If momentum pushes price above $3,353 resistance, follow the breakout with target zones extending to $3,365–$3,380.
Supply Rejection
Alternatively, watch for reversal patterns near $3,345–$3,353. A confirmed rejection opens a short trade down to $3,322.
Scalp Play
For quicker profits, scalp the bounce from the demand zone with tight stops and targets within the 4‑hour upper range.
Risk note: US CPI and trade headlines may inject volatility. Waiting for candle confirmation is critical to validate setups.

XAUUSD - Risk Management - How much % do you risk daily?⭐It’s not about how much you know. It’s about how much you risk.⭐
The lesson you only learn after blowing up your account.
You’ve read hundreds of articles, watched countless hours of YouTube.
Joined 5 groups.Subscribed to 10 channels.
Maybe you even tried a prop firm challenge and failed it in two days.
Paid for mentorship.
Kinda know structure. See price action.
And yet… your account still shrinks faster than your patience.
Because at the end of the day:
It’s not about what you know. It’s about how much you risk.
⚠️ The trade was right. Your lot size wasn’t.
You had a good setup.
Price reached your zone. There was confluence.
Everything looked clean — until your lot size showed up to ruin everything.
Example: You entered with 0.50 lots on a $200 account, using a 40-pip stop loss.
Let’s break it down:
• $0.50 per pip × 40 pips = $200 loss
• You lost 100% of your account on a single trade
The strategy didn’t fail.
The size did.
💡 Why “risking 1%” works on paper — but not on XAUUSD
Every trading book, coach, and Twitter guru screams:
“Just risk 1-3% per trade.”
Cool. Sounds disciplined.
But in Gold, most traders use tight stop losses — 20, 30, maybe 50 pips.
To stay within 1% risk with such a small SL, your lot has to be bigger.
And that’s where accounts explode.
Gold doesn’t move like EURUSD.
It spikes, wicks, manipulates, and throws fakeouts for fun.
Experienced traders know that sometimes a 150–180 pip SL isn’t weak — it’s smart.
It’s not about “being wrong.” It’s about giving the setup room to breathe.
📌 What actually works
Instead of risking 1-3%, many experienced traders manage risk more conservatively:
• 0.25%–0.35% per trade is more sustainable
• 0.50% is rarely reserved for highly valid, high-confluence setups only
This allows for:
• More breathing room
• Emotional control
• Less panic during drawdown
• And more trades that survive manipulation
🧠 Your position size is your psychology, exposed.
Most traders don’t lose because they picked the wrong zone.
They lose because they sized their trade like they were trying to get rich overnight.
You want to measure discipline?
Forget strategy.
Look at how much someone risks per trade.
A 0.10 lot on a $500 account means control.
A 1.00 lot on the same account means desperation or showoff.
🧮 A quick example to make it real
You have a $1,000 account.
You risk 0.20% — that’s $2/pip.
Your stop loss is 50 pips.
That means you can trade 0.10 lot safely.
Now you’re giving the trade room to work — and if it fails, you’re still in the game.
That’s the difference between blowing up and showing up.
📉 Bonus risk reminder: Daily exposure ≠ per-trade risk
If you’re taking 2–3 trades per day, don’t risk 0.30% on each one. That’s not low risk — that’s stacking exposure. ✅ What you should do: Decide your daily risk limit (let’s say 0.30%), then split it across your planned entries. 2 trades? → 0.15% each 3 trades? → 0.10% each
🎯 Final thoughts
Your setup doesn’t need to be perfect.
You do.
→ Risk according to volatility, not emotion
→ Respect your stop loss, and scale your lot size to match
→ Don’t try to force profits out of every candle
The best traders aren’t always right —
they just size smart enough to be wrong and still come back.
If this lesson helped you today and brought you more clarity:
Drop a 🚀 and follow us✅ for more published ideas.

GOLD PAY ATTENTION TO BULISHXAUUSD (Gold) Technical Signal ⚠️ | Price action is forming a classic bull flag pattern, showing consolidation after a strong upward move. The flag is starting to 'blush' — early signs of momentum building for a potential breakout. If price breaks above the upper trendline with volume confirmation, we could see a continuation toward higher resistance levels. Traders, keep a close eye – gold may be preparing for its next leg up. #XAUUSD #GoldSignal #BullFlag #TechnicalAnalysis #ForexSignals #GoldBreakout #PriceAction"

Gold continues to fluctuate, CPI data becomes the key
Technically, the daily chart continues to fluctuate sideways, the moving average is glued together, and the RSI indicator runs near the middle axis. The moving average of the four-hour chart is also glued together, the price is adjusted near the middle track of the Bollinger Band, and the RSI indicator also runs near the middle axis. The gold price once broke through the 3349 mark yesterday, and then fell back and closed near 3320.
Focus on the 3320 position during the Asian session. From a technical perspective, the gold price continues to fluctuate in a range. Under the premise of the lack of news stimulating negative impact, from a technical perspective, the gold price continues to maintain low buying.
From the daily level, gold has been fluctuating at a high level since the high of 3500. The current highs of 3500, 3435, and 3403 are gradually moving down, and the lows of 3120, 3245, and 3293 are gradually moving up. The range of fluctuations is gradually narrowing. The short-term market may continue to fluctuate. If it breaks through, it will need to wait for major news stimulation to break through the direction!
💰Strategy Package
Then today's lock-up range is 3293-3350. It is recommended to sell high and buy low. Before the effective breakthrough of the range, short-term or ultra-short-term scalping is the main means.
Key points:
First support level: 3320, second support level: 3306, third support level: 3292
First resistance: 3346, second resistance: 3358, third resistance: 3376
Buy: 3303-3305, stop loss: 3292, target: 3320-3330;
Sell: 3350-3353, stop loss: 3362, target: 3330-3320;
⭐️ Note: Labaron hopes that traders can properly manage their funds
- Choose the number of lots that matches your funds

GOLD PRICE ACTION ANALYSIS – June 11, 2025 GOLD PRICE ACTION ANALYSIS – June 11, 2025 🟡
Technical Breakdown & Bearish Scenario Ahead ⚠️📉
🔍 Overview:
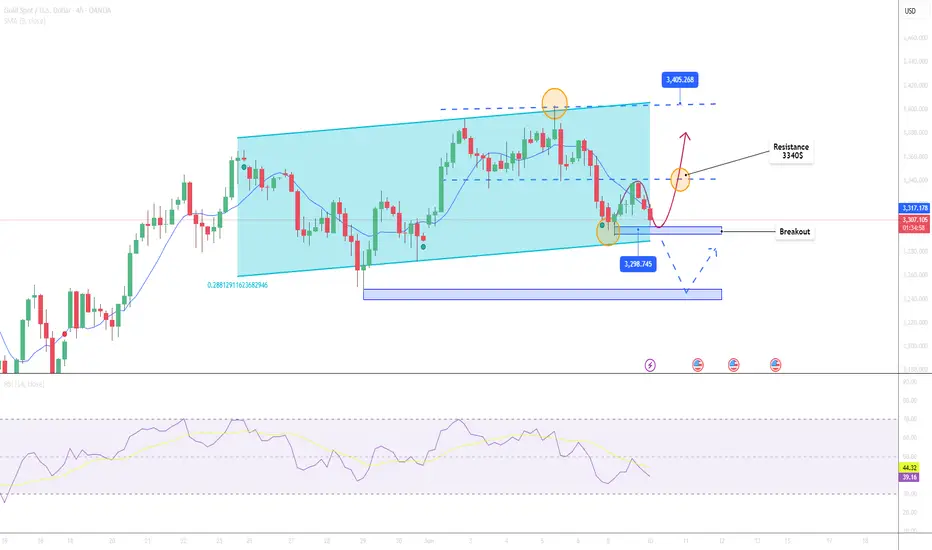
The chart presents a clear range-bound structure with strong horizontal resistance around the $3,400–$3,420 zone and support around the $3,120–$3,160 level. Price is currently trading near the upper range of the consolidation.
📊 Key Technical Levels:
🔴 Resistance Zone: $3,400 – $3,420
➤ Price has been rejected here multiple times (highlighted by red arrows and orange circles), showing strong supply pressure.
🟣 Intermediate Support: $3,260.618
➤ This level acted as a minor support and could be tested again if the current pullback deepens.
🟤 Major Support Zone: $3,120 – $3,160
➤ A key demand area where price previously bounced significantly.
📉 Bearish Setup:
A potential lower high is forming just below the resistance zone.
The projected path suggests a minor pullback to form a bearish retest, followed by a potential breakdown below $3,260.
If the $3,260 support is broken decisively, further downside toward the $3,120–$3,160 support is likely (blue arrow projection).
🔄 Bullish Scenario (Invalidation):
A breakout and strong close above $3,420 could invalidate the bearish structure.
In that case, price might attempt to target higher resistance levels beyond $3,440.
📌 Conclusion:
Gold remains in a range with a bearish bias unless the $3,420 resistance is breached.
🔽 Watch for confirmation below $3,260 for bearish continuation.
✅ For bulls, wait for a strong breakout above resistance with volume.

How is the market situation during the China-US talks?Information summary:
On Tuesday, as the China-US trade negotiations entered the second day, the US dollar index fluctuated around the 99 mark.
The gold price once approached the 3,300 US dollar mark in the Asian market, and then continued to rise, reaching the highest of the 3,350 US dollar mark. After the opening of the US stock market, all the gains during the day were given up, and it has been maintained below 3,350 for consolidation.
From the current known negotiation information, the two sides basically agree on the general direction and principles, but it means that more specific content and details have not yet been fully negotiated, and more dialogue is needed to resolve.
Market analysis:
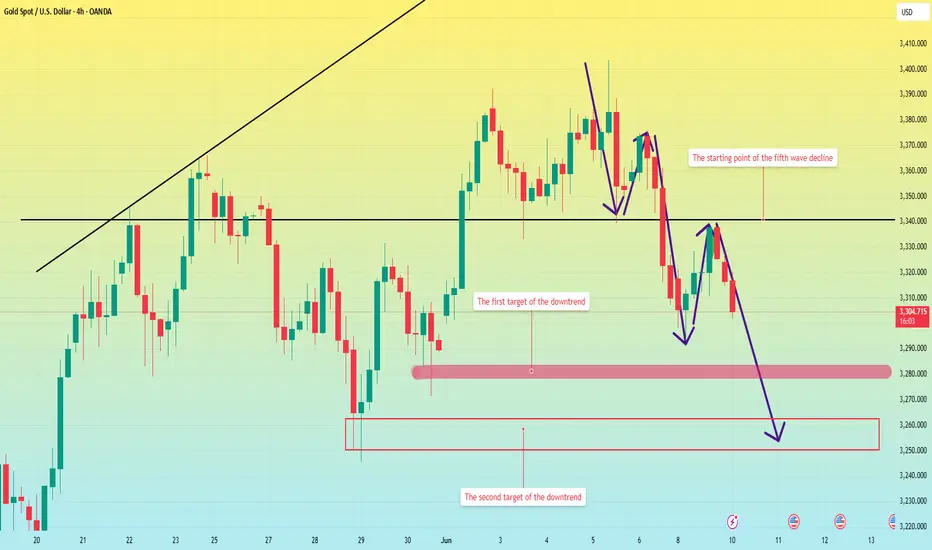
From the current gold market, as long as the 3,350 mark cannot be strongly broken through next, the price will fall again. The consolidation range will remain at 3,300-3,350. As long as the price fails to break through strongly, there will still be a fifth wave of downward trend.
Therefore, gold is still maintaining short selling operations at high points.
Operation strategy:
Short at 3345-3450, stop loss at 3360, the first target is this week's low of 3300, the second target is 3285, and the third target is 3250.

Analysis of gold prices on June 11
📌Gold news
🎈Economic data and policy expectations
U.S. employment data; initial jobless claims increased for two consecutive weeks, and the market focus shifted to the non-farm payroll report released this week. The data performance will affect the Fed's policy path.
Trump pressures interest rate cuts: Trump recently called on the Fed to cut interest rates by "one percentage point" again, and hinted that he would consider replacing the Fed chairman, exacerbating market expectations for loose monetary policy.
🎈Long-term support factors
Despite short-term fluctuations, global economic and geopolitical uncertainties (such as repeated trade frictions and debt risks) still provide long-term safe-haven demand for gold, especially in the context of the divergence of monetary policies between European and American central banks, the allocation value of gold is highlighted.
📊Technical analysis
Before the European session, the gold price showed a continuous positive trend. I gave a hint in my analysis that I was not in a hurry to guess the top, and followed the trend to rise to around 3340 and wait for the turning point to appear. The opening trend of the European session tended to fluctuate until it rose to around 3348 in the evening and then turned from rising to falling, but the decline was not strong. It rose again at the position of the European session. Now the gold price is trading around 3350. From the market point of view, this wave of rise was supported by the trend line at 3300. Whether it was geopolitical conflicts or various news about Sino-US trade negotiations that stimulated buying to drive gold prices up, the second rise in the US session has exceeded 3340.
The next key suppression level is around 3360, which is 618 from 3403 to 3300, which can be treated as a turning point. The initial support below focuses on the high point of yesterday's Asian session at 3338.
💰Strategy Package
Waiting for gold: short at 3355-3360, stop loss at 3365, target at 3340-3328!
⭐️ Note: Labaron hopes that traders can properly manage their funds
- Choose the number of lots that matches your funds

Gold fluctuates widely, strategy remains unchanged
📌Gold news
The US and Chinese delegations will continue talks in London for the second consecutive day. President Trump expressed optimism, saying the talks "should go well". US officials said the talks could lead to Washington lifting certain technology export restrictions in exchange for Beijing relaxing controls on rare earth exports - a material that is critical to industries such as energy, defense and advanced technology. The results of these negotiations may provide a new direction for precious metals
📊Comment analysis
The European session continued to retrace and gave a low of 3293, then slowly strengthened. The current high reached 3349, so today's strategy does not need to be changed for the time being. If the current market is given to 3335-3345 again, short orders can still be entered. The current trend is still weak, and the US market is likely to follow the old path of a second decline, so the current idea of shorting on the pullback remains unchanged for the time being!
💰Strategy package
Gold: Short on rebound 3335-3345, stop loss 3350, target 3300-3280!
⭐️ Note: Labaron hopes that traders can properly manage their funds
- Choose the lot size that matches your funds
-

Is there more than $100 room for gold to fall?
💡Message Strategy
Gold is under the dual pressure of risk aversion cooling and dollar strengthening in the short term. As the high-level negotiations between Asian powers and the United States entered the second day in London, the market was optimistic about reaching an agreement in the field of export controls, which improved the overall risk sentiment and safe-haven assets such as gold were under obvious selling pressure.
At the same time, the US non-farm payrolls report last week far exceeded expectations, further suppressing expectations of a rapid rate cut this year, pushing up the US dollar index, and putting pressure on gold at the $3,340 mark.
Recently, the gold price has failed to effectively break through the 200-hour moving average, reflecting the lack of bullish momentum, and the short-term trend is likely to be consolidated or further adjusted.
📊Technical aspects
From a technical perspective, gold prices fell again after failing to test the 200-hour moving average and are currently fluctuating below $3,340. Hourly chart indicators (MACD, RSI) show that bearish momentum continues to increase. If the price falls below the previous trading day's low of $3,290, it will further open up space to fall back to the May 29 low of $3,245 or even $3,200.
The first support is in the 3340 area. After breaking through, it may accelerate the decline to test 3290; if this position is lost, it may re-test the 3200 integer mark.
💰 Strategy Package
Short Position:3340-3355,3355-3365

We are waiting for the H4 liquidity backtest to place SELL GOLDYesterday there was a BUY point and a missed SELL. Currently gold is in wave 5. We are waiting for the H4 liquidity backtest to place a SELL order.
World gold prices rose after the People's Bank of China announced on June 7 that it had added gold to its reserves for the seventh consecutive month in May. China's gold reserves were valued at $241.99 billion at the end of last month, down from $243.59 billion at the end of April. Gold prices hit an all-time high (over $3,500/ounce) in April, which boosted the value of China's holdings of the precious metal.
Investors are now waiting for the US Consumer Price Index (CPI), data due on June 13, to assess the country's economic health and predict the trajectory of the US Federal Reserve's interest rate cuts.
Let's wait for SELL
Best regards, StarrOne !!!

Gold at risk if US–China talks fail📊 Market Overview:
• Spot gold is trading around $3,309–$3,311/oz (according to TradingEconomics, Kitco…), slightly down by 0.5% as markets await the outcome of US–China trade talks in London.
• The US dollar has eased following some positive signals from the talks, but overall market caution remains high ahead of the June 11 CPI release and the upcoming Federal Reserve decision.
📉 Technical Analysis:
• Key resistance: $3,340 (June consolidation ceiling); further upside at $3,353–$3,370 if a breakout occurs.
• Nearest support: $3,298 (monthly pivot); if breached, price may move toward $3,270 → $3,243.
• EMA09/EMA20/EMA50: Price is trading below the short- to mid-term EMAs, indicating a consolidating or slightly bearish trend.
• Candlestick/momentum: Sideways structure within $3,298–$3,332; weak momentum. RSI and Stochastic are below mid-levels, signaling market caution.
📌 Outlook:
• Gold may continue to consolidate or edge lower in the short term if the US–China negotiations fail to deliver a significant breakthrough and no strong bullish data emerges.
• Conversely, any signs of renewed tension, failed trade talks, or unexpectedly high inflation figures could reignite bullish momentum and push prices back toward the $3,332–$3,370 range.
________________________________________
💡 Trade Strategy Suggestion:
➡️ SELL XAU/USD
Entry: $3,330–$3,335
• 🎯 TP: ~$3,310
• ❌ SL: $3,345
➡️ BUY XAU/USD
Entry: $3,298–$3,305
• 🎯 TP: ~$3,320
• ❌ SL: $3,288
The short-term tug-of-war for gold is starting
Gold prices continued their decline last Friday and stabilized and rebounded. Yesterday, gold prices fell back to the 3,300 mark, then slowly rose to the 3,338 mark, and fell back after encountering resistance, which is in line with the technical consolidation rhythm.
- China-US trade negotiations: The US has released signals that it is willing to relax export restrictions, and the market is waiting for the results of the negotiations, which may affect risk sentiment.
- US May CPI data: Inflation changes will provide key guidance for the Fed's policies.
- The current trend is weak, but the downside is limited. Buy on dips and avoid large-scale shorting.
- Today, it is recommended to wait and see, and wait for the negotiation results to become clear before entering the market to reduce volatility risks.
🔥Sell gold area: 3330-3348 SL 3352
TP1: $3320
TP2: $3310
🔥Buy gold area: $3295-$3305 SL $3290
TP1: $3320
TP2: $3330

Gold rises and then falls, short at 3330📰 Impact of news:
1. Geopolitical situation
2. Impact of the US dollar trend on gold
📈 Market analysis:
Gold rebounded again after falling to 3301, but the upper 3330-3340 line still has strong suppression on gold. Judging from the current trend, because the gold price has risen in the short term and returned to the 3325-3327 line, the short-term resistance is still 3330-3335 and it is expected to fall under pressure. Look for the 3315-3310 position. If it falls below this support, look down to the 3300-3290 line.
🏅 Trading strategies:
SELL 3330-3340
TP 3315-3310-3300
If you agree with this view, or have a better idea, please leave a message in the comment area. I look forward to hearing different voices.
OANDA:XAUUSD FX:XAUUSD FOREXCOM:XAUUSD FXOPEN:XAUUSD TVC:GOLD

Gold Price Analysis June 10Gold price reacted at the Trenline and EMA 34 yesterday and bounced back but still closed below the breakout zone of 3335.
The downtrend can still continue as long as 3335 remains strong today.
H4 shows the provincial port area at 3295 and 3275 in the opposite direction of the provincial port at 3339 and 3365.
H1 is still forming a clear downtrend. 3309 is the immediate resistance zone. is the price zone that can scalp breakout if it closes above this zone. break 3309 Gold will head to 3327 in this zone, if you want to SELL, you have to wait for confirmation from the selling candle. When the buyers push the price strongly through 3327, you have to wait for the US session resistance around 3338 yesterday. Resistance and support during the day are noted around 3275 and 3365

Gold is falling. Where is the low point?Market summary:
Yesterday, thanks to the weakness of the US dollar, the US dollar once fell below the 99.0 mark. Spot gold rebounded from the low of 3293 hit earlier in the session, recovering all the losses during the day, and the highest point was near 3338.
It fell from the high point in the early Asian session on Tuesday, and has been consolidating in the 3300-3310 range so far. In my early analysis, I pointed out that there is a high probability that the fifth wave of the wave trend will fall at the beginning of this week, and as I predicted, it is completing the fifth wave of the downward trend.
Trend analysis:
From the four-hour chart, the fourth wave of rebound has been completed, so today is the fifth wave of the downward trend. Next, we look at the two target ranges.
The first target is around 3280, and the second is 3260-3350. And today, it is highly unlikely to stabilize above 3310, so don't choose to short at the rebound high point, the chance is very slim.
Operation strategy:
Short around 3310, stop loss at 3320, profit range 3380-3350.
Gold Trading Strategy June 9The D1 candle cluster on Friday broke the sideway structure near the AHT peak and confirmed the downtrend for Gold price by breaking through 50% of the main bullish candle on June 2.
After touching the Gap zone around 3395. Gold price pushed up quite high in Tokyo trading session today and headed towards the first resistance levels around 3319. This area can wait for reaction and SELL to return because this is the area where the Sellers accumulated quite strongly at the beginning of the session.
The European session will pay more attention to the 3334 area with a breakout point also quite important on Friday. If from 3334 the gold price falls, it will form a strong fall according to the downtrend structure and head towards 3275 soon.
SELL is following the trend and can sustain profits far away, while BUY points are considered to find a corrective reaction wave, so narrow expectations.
Support: 3295, 3275
Resistance: 3319, 3334, 3345, 3359
Wish you a successful trading day

The golden direction after non-agricultural
💡Strategy Review
Gold fell sharply from a high on Friday. We insisted on high shorts. Although gold seemed to rebound strongly, it quickly fell back under pressure at 3375. Gold continued to short at 3370 and fell before the non-farm payrolls. Gold was bearish on the US non-farm payrolls. Gold continued to short at 3365 and finally fell sharply. Gold continued its two consecutive wins at high altitudes on Friday.
Although gold has not reached our second target, it has fallen perfectly to our first target, and there is also room for profit of $70.
So what will be the trend of gold in the future?
At present, the short trend of gold is still strong. If it continues to fall below 3290 after opening, there will be a lot of room for further decline.
📊Technical aspects
The gold 1-hour moving average has formed a dead cross downward, so gold still has downward momentum. After the gold 1-hour high box oscillation, gold finally fell below the box, indicating that the gold short position is better.
Then the bottom of the gold box has now formed resistance, and the short-term 3340 line of gold has formed resistance to gold. If gold is under pressure at 3340 at the beginning of next week, then gold can continue to be short.
💰 Strategy Package
Short Position:3330-3340

$XAU (GOLD) 15M AnalysisPrice rallied strongly into a bearish FVG (Fair Value Gap) around 3,335 after reclaiming demand...However, this rally lacked conviction and broke structure to the downside, forming a lower high and a weak low retest.
Ideal short setup:
Price returns into the FVG, rejects around 3,333–3,335, then shows signs of displacement downward.
First target: Break below 3,325.
Invalidation: Clean break and close above 3,336.
Bias: Short from FVG zone.
Target: 3,294 area of liquidity.
This is a classic liquidity sweep + FVG rejection setup.
Reclaim of the trendline after sweep.
Price to revisit the FVG zone around 3,335.
Final rejection and breakdown toward 3,294.

XAUUSD SNIPER PLAN – TUESDAY, JUNE 10, 2025👋 Good evening traders!
After a choppy NY that faked both directions, Monday closed with gold stuck around 3325. But don’t be fooled — the real plays are coming Tuesday as we align with clean structure, trap logic, and real macro catalysts. Focus only on what matters.
Let’s prep with clarity and intent. 🎯
🌍 TUESDAY MACRO PREVIEW (JUNE 10)
📊 12:00pm – NFIB Small Business Index
🗣️ 10:00pm – President Trump speaks (market-moving risk)
🛢️ 10:30pm – API Weekly Oil Data (impacts USD sentiment)
No CPI or FOMC yet — but volatility is brewing. Trump + late-day oil stats = prime conditions for NY tricks or late-session moves.
🧠 TECHNICAL STRUCTURE
🔹 Last impulse: 3292 → 3338
🔹 Price now: 3325
🔹 Asia swept 3293 — partial gap fill
🔹 NY faked above 3338 → rejected → no follow-through
🔹 HTF still bullish but in pullback mode
📏 Fibonacci (3292–3338)
– 50% = 3315
– 61.8% = 3310
– 78.6% = 3303
📊 EMAs: 5/21 kissing → possible expansion
📉 RSI: Mid-range → clear room to move
🔐 STRUCTURE ZONES – CLEAN & ACTIVE
Price Zone Type Logic
3345–3354 SELL ZONE 1 HTF FVG + inducement trap
3362–3368 SELL ZONE 2 OB + liquidity clear above final highs
3329–3332 FLIP ZONE NY trap → could flip support or reject
3307–3310 BUY ZONE 1 61.8% + CHoCH potential + OB
3292–3296 BUY ZONE 2 Asia low + FVG + discount sweep
🎯 PLAN OF ATTACK
✅ Bullish Plan
– Hold above 3315–3320
– Break 3338 → retrace into 3310/3307 = sniper long
🎯 TP: 3354 → 3368
❌ Bearish Plan
– Fail under 3332 → tap 3345–3354 for reaction
– Rejection = sell into 3310–3296
🎯 TP: 3310 → 3292
⚠️ 3329–3332 = reaction zone only
Do not sell blindly — wait for confirmation.
👀 EYES ON:
– 3338 = intraday BOS point
– 3307 = sniper trigger if CHoCH
– Trump speech = high spike risk
– NY tends to reverse early Asia setups
🚀 FINAL WORD
We’re not here to chase noise — we’re here to execute with structure.
You’ve got two clean sells, two sniper buys, and real macro risk on the table.
No guesswork. Just precision.
💬 What’s your plan for Tuesday?
Do you see the 3362 trap playing out?
Are you waiting for the 3307 sniper?
👇 Drop your scenario in the comments — let’s compare setups and grow together.
📲 Follow @GoldFxMinds for daily sniper clarity
🎯 Let’s dominate CPI week. Together.
💬 Drop a 🚀 if you’re locked in for NY
🔥 Let’s make Tuesday count — clean, confident, and calculated.

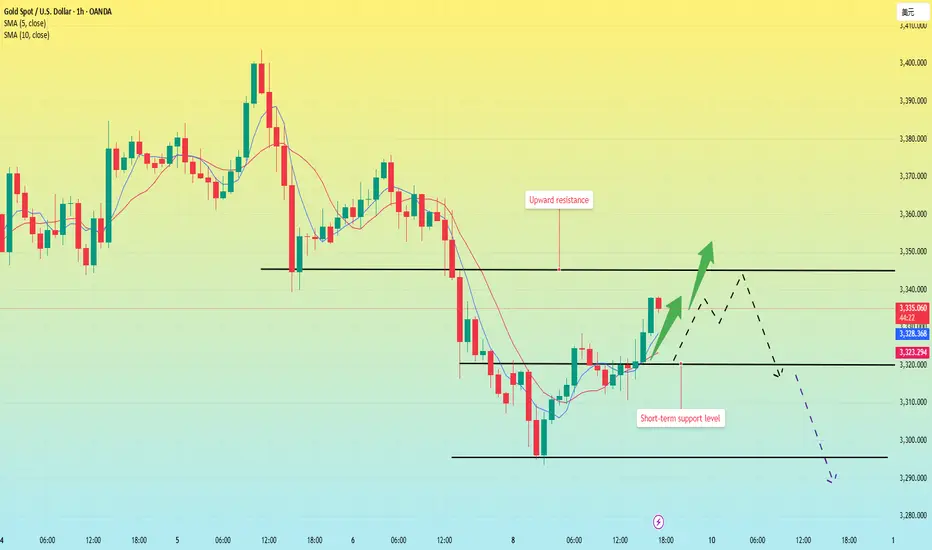
Gold price rebounds, short-term strength?After the opening of the U.S. stock market today, the price of gold rose rapidly, breaking through the first resistance level of 3325, and currently reaching the intraday high of 3337.
However, from the hourly chart, the current price has not reached the upward trend point I predicted, so the price is likely to rise slightly again in the future.
From the 4-hour chart, gold rose again after falling back in the U.S. market, and the price broke through the 3325 position upward, which means that the short-term is strong; in the morning analysis, I predicted that gold would fall back and rush high, and the fall back can be short-term long, and the volatile market can be operated in the short term according to this strategy.
At present, the 4-hour MA5-day and 10-day moving averages have a trend of forming a golden cross upward, and after the fall in the morning, the moving averages are currently showing an upward turning trend.
Therefore, after the price breaks through 3325, the probability of continuing upward is still relatively large, and the pressure position is 3345; this position is the point after the fall back from the high point in May, and it is also an important pressure position after the current price falls back and rebounds.
The price is currently heading towards a retest of 3340-3345 levels. If the dollar continues to fall and gold manages to consolidate above 3345, the bullish trend is likely to continue. However, a false breakout of 3340-3345 area could trigger a further decline following the breakdown of the bullish structure.
Evening gold trend analysis and operation layout📰 Impact of news:
1. The streets of Los Angeles are full of "gunpowder smell"! Immigration protests escalate, and Trump sends troops to suppress them
2. Geopolitical situation
3. Federal Reserve political expectations
📈 Market analysis:
Gold rebounded as expected and touched the 3330 line. In the short term we need to pay attention to the 3335 line. On the one hand, it is the top and bottom, and on the other hand, the annual average line is also the pressure point of the upper track of the downward channel. Once it is suppressed below 3335, it will continue to fluctuate downward. If it unexpectedly breaks through 3335 or even 3340, then 3293 is likely to become the short-term bottom.
At present, the rise has slowed down after rising to 3330, and the technical side shows a top divergence signal, so in the short term, we still maintain the idea of shorting at a high level of fluctuation.
🏅 Trading strategies:
SELL 3335-3345-3355
TP 3310-3300
If you agree with this view, or have a better idea, please leave a message in the comment area. I look forward to hearing different voices.
TVC:GOLD FXOPEN:XAUUSD FOREXCOM:XAUUSD FX:XAUUSD OANDA:XAUUSD

Gold May See Short-Term Correction As US-China Talks Loom💡 Suggested Trading Strategies
SELL XAU/USD at: $3,320 – $3,326
🎯 TP: $3,300
❌ SL: $3,330
BUY XAU/USD at: $3,296 – $3,300
🎯 TP: $3,320
❌ SL: $3,290
📊 Market Summary
Gold prices have been volatile recently due to high-level trade negotiations between the US and China. Investors are cautious as a potential breakthrough could ease tensions and reduce safe-haven demand for gold.
📌 Outlook
Gold may decline slightly toward the $3,296–$3,300 range if no breakthrough is achieved in US-China talks. However, a positive outcome could trigger a rebound toward the $3,326–$3,340 zone.
