Gold long and short repeated operation
📌 Negative driving factors
Gold prices fell below $3,320/ounce on Thursday as the US-UK trade agreement improved risk appetite. Gold fell nearly 4% in two days as the US-UK agreement boosted risk appetite and demand for the US dollar.
📊Comment analysis
Gold fell directly at the opening of the Asian session today, and did not provide a good position for short selling. However, it rebounded and rose later, regaining its footing at 3,330. The short-term price fluctuated between long and short.
💰Strategy Package
🔥Sell Gold Zone: 3351-3353 SL 3358
TP1: $3340
TP2: $3330
TP3: $3320
🔥Buy Gold Zone: $3232 - $3234 SL $3227
TP1: $3245
TP2: $3260
TP3: $3270
⭐️ Note: Labaron hopes that traders can properly manage their funds
- Choose the number of lots that matches your funds
- Profit is 4-7% of the capital account
- Stop loss is 1-3% of the capital account
Goldprice

Gold is in shock again, will the short position continue?🗞News side:
1. Tariffs push up inflation and slow down the economy, and the Federal Reserve may be in trouble
2. The situation between India and Pakistan escalates again
📈Technical aspects:
Gold experienced a big plunge yesterday, and today it bottomed out near 3275 again and then started to rebound. The current gold price is caught in a wide range of fluctuations, with long and short positions frequently alternating to impact the market, making it difficult to form a unilateral trend. At present, the gold price once rebounded to around 3330. If the gold price breaks through the 3336 line, short-term trading in the European market may touch the upper level near 3350, or even the 3365 line. Today's market cannot chase the rise and sell the fall. Overall, it is still a wide range of fluctuations. It should be a violent roller coaster before the subsequent surge. The European session relies on the low point of 3310 to step back as a defense, focusing on the upper 3350-3360, and further close the key resistance of 3370. The short-term focus below is the support of 3280-3290.
If you agree with this view, or have a better idea, please leave a message in the comment area. I look forward to hearing different voices.
OANDA:XAUUSD FX:XAUUSD FXOPEN:XAUUSD FOREXCOM:XAUUSD TVC:GOLD

GOLD → sideways fluctuations. Will it break the resistance levelNews summary:
US President Trump announced a trade agreement with the UK, which raised hopes of reaching such an agreement with other countries, eased market tensions, suppressed gold's safe-haven buying, and the rise in the US dollar, US stocks and US bond yields also suppressed gold prices. US Treasury Secretary Bensont and Trade Representative Greer will talk with China's top economic officials in Switzerland in the near future.
Quaid reminds everyone that market concerns have not completely dissipated, and it is necessary to pay attention to the support of bargain hunting. The European Commission said earlier that if negotiations with Washington fail to cancel a series of tariffs imposed by US President Trump, the EU is considering taking countermeasures against US imports worth up to 95 billion euros. Close attention needs to be paid to news related to the international trade situation and changes in market sentiment during this trading day.
Support level analysis:
3310-3300 US dollars/ounce: 3300 US dollars is a psychological barrier and technical support for the confirmation of the previous price retracement. If it falls below 3300, it may fall to the 3280 US dollar area.
Resistance level analysis:
3360-3375 USD/ounce: Gold is currently above the convergence and oscillation range. 3360-3375 USD is the high pressure level of the previous day's box consolidation. If it breaks through this position strongly, the upward space will open up.
Technical analysis:
Gold is in a high-level oscillation and convergence range. The 4-hour MACD indicator shows that the short-selling momentum is weakening, but the hourly chart shows that the price is still constrained by the downward trend line. If gold prices stabilize at $3,300, it may trigger a rebound to $3,350-3,360; if it falls below $3,280, it may accelerate the downward trend. if it falls below 3280 USD, it may accelerate the downward trend.
Operation strategy:
Bull strategy: Long at 3315-3325 USD, stop loss at 3305 USD, target position at 3350-3360 USD.
Short strategy: short at $3365-3375, stop loss at $3380, target position at $3330-3300.

GOLD→Beware of market reversal? News is coming soon.At the end of the Asian session, the US dollar index was around 100.05. Gold rebounded after the plunge, and the current gold price is around $3,320/ounce.
Investors will see a large number of speeches by Fed officials, among which Williams' remarks are the most watched and are expected to trigger a big market trend.
Today's major news:
New York Fed President Williams will deliver a keynote speech at the 2025 Reykjavik Economic Conference. Later, Williams will speak at the Hoover Monetary Policy Conference.
I think if Williams makes hawkish remarks, it may push the dollar stronger, thereby suppressing gold prices.
Williams also serves as vice chairman of the Federal Open Market Committee and has permanent voting rights like the Fed governors.
In terms of monetary policy, Weems has the most say after Chairman Powell. Williams also served as chairman of the San Francisco Fed for nearly 7 years.
There are also several events taking place today: Fed Governor Kugler will speak on maximizing employment; North Richmond Fed President Barkin will participate in a fireside chat; Chicago Fed President Goolsbee will deliver a welcome and opening speech at a Fed event.
Gold price trend forecast:
I think its price may fall further to $3,200-3,100/ounce in the next few weeks.
I hope my analysis can help you, and I wish you good luck.

Gold prices face substantial short-term suppression
📌 Bearish drivers
Gold prices (XAU/USD) rebounded from a multi-day low in early Asian trading, and are now at the psychological level of $3,300. Ongoing geopolitical uncertainties, including the Russia-Ukraine conflict, heightened tensions in the Middle East, and renewed frictions on the India-Pakistan border continue to support gold prices. Even so, improved risk sentiment appears to have limited gold's upside due to renewed optimism around the US-UK trade agreement and the launch of US-China tariff negotiations over the weekend.
📊Commentary and analysis
As tariff trade negotiations become more active, gold prices are facing huge selling pressure. Gold prices may return to the 3233 price range and continue to rise.
💰Strategy Package
🔥Sell Gold Zone: 3351-3353 SL 3358
TP1: $3340
TP2: $3330
TP3: $3320
🔥Buy Gold Zone: $3232 - $3234 SL $3227
TP1: $3245
TP2: $3260
TP3: $3270
⭐️ Note: Labaron hopes that traders can properly manage their funds
- Choose the number of lots that matches your funds
- Profit is 4-7% of the fund account
- Stop loss is 1-3% of the fund account

XAU/USD 09 May 2025 Intraday AnalysisH4 Analysis:
-> Swing: Bullish.
-> Internal: Bullish.
Analysis and bias remains the same as analysis dated 23 April 2025
Price has now printed a bearish CHoCH according to my analysis yesterday.
Price is now trading within an established internal range.
Intraday Expectation:
Price to trade down to either discount of internal 50% EQ, or H4 demand zone before targeting weak internal high priced at 3,500.200.
Note:
With the Federal Reserve's dovish stance and persisting geopolitical uncertainties, heightened volatility in Gold is expected to continue. Traders should proceed with caution and adjust risk management strategies in this high-volatility environment.
Price could also be driven by President Trump's policies, geopolitical moves and economic decisions which are sparking uncertainty.
H4 Chart:
M15 Analysis:
-> Swing: Bullish.
-> Internal: Bullish.
Analysis and bias remains remains the same as analysis dated 07 May 2025.
As mentioned in yesterday's analysis that I would continue to monitor price and depth of bearish pullback following previous bullish iBOS.
Price did not pull back with any significance, therefore, I will apply discretion and not mark the previous iBOS. I have however marked this in red.
Price continued bullish and subsequently printed a bearish iBOS to indicate, but not confirm bearish pullback phase initiation.
Price is now trading within an established internal range, however, I will continue to monitor depth of pullback.
Intraday Expectation:
Price to trade down to either discount of internal 50% EQ, or M15 supply zones before targeting weak internal high priced at 3,435.055
Note:
With the Federal Reserve maintaining a dovish stance and ongoing geopolitical tensions, volatility in Gold prices is expected to remain elevated. Traders should exercise caution, adjust risk management strategies, and stay prepared for potential price whipsaws in this high-volatility environment.
Trump's tariff announcement will most likely cause considerably increased volatility and whipsaws.
M15 Chart:

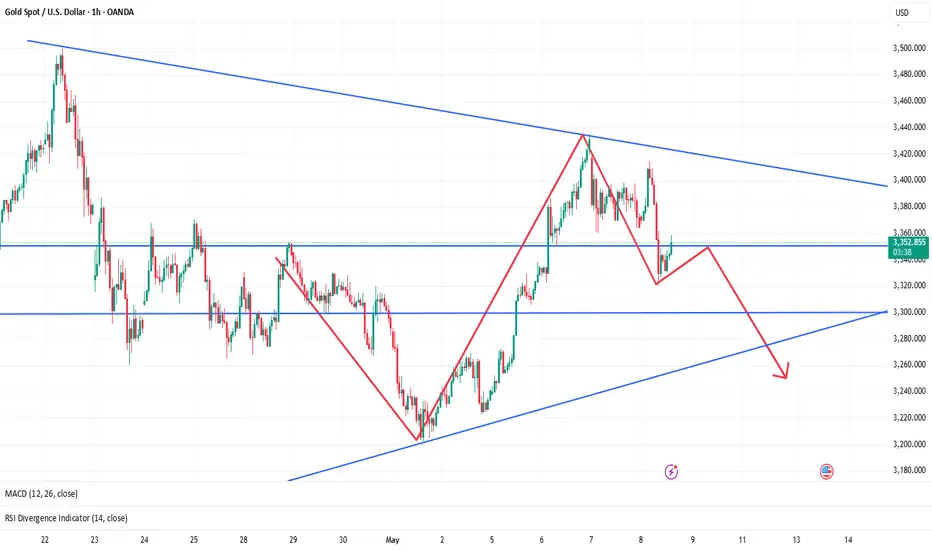
Gold price fell after a surge? Continue the downward trend?Analysis of gold market trend:
Gold price surged in the morning of Asian session, but then fell to around $3,315.
Market situation analysis shows that gold price continued the trend of yesterday in Asian time, rising rapidly in the morning, and then began to decline. It fell to $3,275 in the morning, and then rose to today's high of $3,330.
From the perspective of the gold hourly line, it began to rise after a brief decline in the morning of Asian session, effectively breaking through the resistance level of 3,315 and rising to a high of $3,330 for a short time. Then a downward trend appeared. This high-level fluctuation shows that the market is in a big wash and is brewing a new trend.
I think the downward space may be around $3,300.
Operation strategy:
Short around $3,320, stop loss at $3,330, and take profit at $3,300.

Gold Rebounds Amid Geopolitical TensionsOANDA:XAUUSD Gold (XAU/USD) bounced back to $3,330 amid escalating global tensions, including renewed conflicts on the Russia-Ukraine front and flare-ups along the India-Pakistan border. Safe-haven demand supported the rebound, but the upside may be limited as markets watch US-China trade talks and digest the limited US-UK trade deal. Technically, gold remains in a corrective phase below the $3,365 resistance zone. A clean break above this level could trigger a retest of the $3,413 supply zone. Otherwise, bears may drag it back toward $3,289 and $3,239 support. Traders watch closely for clarity from today’s FOMC speakers.
Resistance : $3,330 , $3,364 , $3,413
Support : $3,289 , $3,239

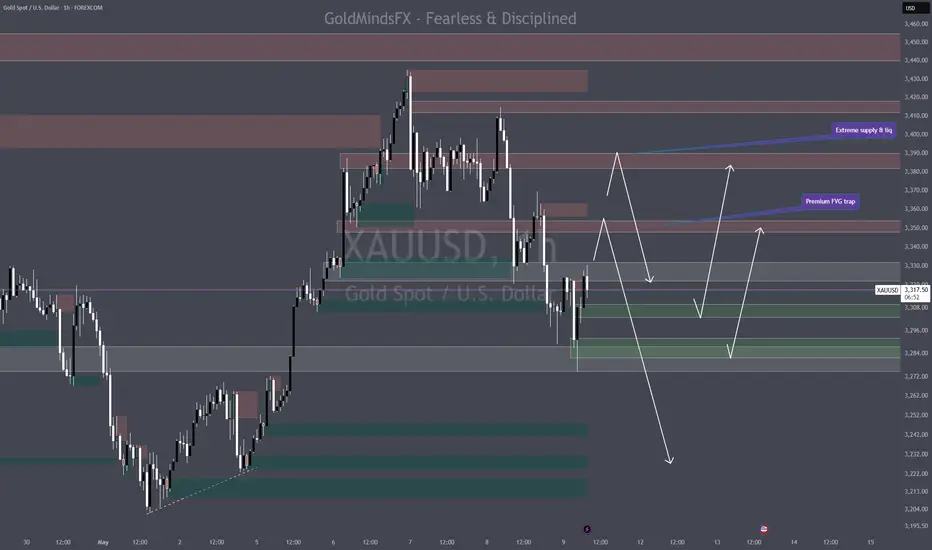
Gold Daily Sniper Plan - XAUUSD May 9🔹 XAUUSD – Daily Sniper Plan | May 9, 2025
🎯 Precision Mode: Activated. No recycled zones. Only real-time flow.
🧠 Macro Context:
• Market digested FOMC + Powell ✅
• Price dipped into 3284 sniper zone (✅ Reaction Confirmed)
• Asia printed fresh CHoCH from discount → Now retesting
• Bias: HTF bullish — LTF shift confirmed after deep mitigation
• Today = Thursday → Keep eyes on volume traps before NY
🔍 Structure Summary:
• D1–H4: Bullish trend intact, reaction from strong OB near 3284
• H1–M15: Internal BOS + CHoCH + FVGs filled, clean transition
• Major HL defended. New short-term HH printed → demand forming below.
🔻 SELL SETUPS (only from premium)
1. Sell Setup 1 – Premium FVG Trap
📍 Zone: 3348–3354
🎯 Confluence: M15 imbalance + weak high + LTF CHoCH area
🛑 SL: 3362
TP1: 3335
TP2: 3318
TP3: 3304
2. Sell Setup 2 – Extreme Supply + Liquidity
📍 Zone: 3382–3390
🎯 Confluence: Unmitigated M30 OB + Equal highs + HTF inefficiency
🛑 SL: 3401
TP1: 3360
TP2: 3335
TP3: 3310
🟢 BUY SETUPS (only after confirmation)
1. Buy Setup 1 – CHoCH Retest + OB
📍 Zone: 3303-3310
🎯 Confluence: M15 OB + previous CHoCH + demand reaction
🛑 SL: 3292
TP1: 3324
TP2: 3340
TP3: 3354
2. Buy Setup 2 – Deep Discount Sniper Zone
📍 Zone: 3284–3292
🎯 Confluence: H4 OB + FVG + 61.8% FIB retracement
🛑 SL: 3268
TP1: 3310
TP2: 3333
TP3: 3350
Bias Today: HTF bullish | LTF flipped bullish after Asian CHoCH
Scalps and reentries only from refined zones. No countertrend unless clear CHoCH/weak high is grabbed.
💬 Note:
Don’t buy or sell from the middle of nowhere. Wait for price to deliver to the zones. If price flies without you? That’s not your train. You’re waiting at your sniper station.
👇 Like the plan?
Drop a 🚀 Follow, comment, and share with your trading crew — let’s build the sharpest Gold team on TradingView
📌 Important Notice!!!
The above analysis is for educational purposes only and does not constitute financial advice. Always compare with your plan and wait for confirmation before taking action.
How to operate gold in the short term today
📌 Negative drivers
The trade peace talks have really entered a substantive period. Japan, the most active country, did not become the first country to sign the agreement. Instead, it was the United Kingdom and the United States, setting an example for everyone.
This also means that Europe, Japan, India, etc. will also enter the substantive stage, which will become a battlefield for Sino-US trade.
Gold, the surge since April, all came from the global trade war initiated by the United States, and the retracement node also fell because the trade war eased.
From the conclusion of the British and American talks this morning, more and more countries will sign, which will affect the rising rhythm of gold.
Divergence of geopolitical risk aversion: Although the escalation of the India-Pakistan conflict has boosted risk aversion demand, the market's expectations of the controllability of the conflict have weakened the risk aversion premium of gold. The current conflict has not yet reached the level of a full-scale war, and there is a risk of "dying in the light" in risk aversion demand.
📊Comment analysis
Short-term casual 20 US dollars +, follow the trend is very important, and follow the watershed.
The Asian session broke the low point of yesterday morning, and the tariffs also loosened for the first time. Don't go long.
💰Strategy Package
Gold price has continuously fallen below the moving average and has been falling all the way. How can we go long in such a market? Continue to stick to the high-altitude thinking. Now the 3320 line has become a pressure point. Below it, we insist on going short.
⭐️ Note: Labaron hopes that traders can properly manage their funds
- Choose the number of lots that matches your funds
- Profit is 4-7% of the fund account
- Stop loss is 1-3% of the fund account
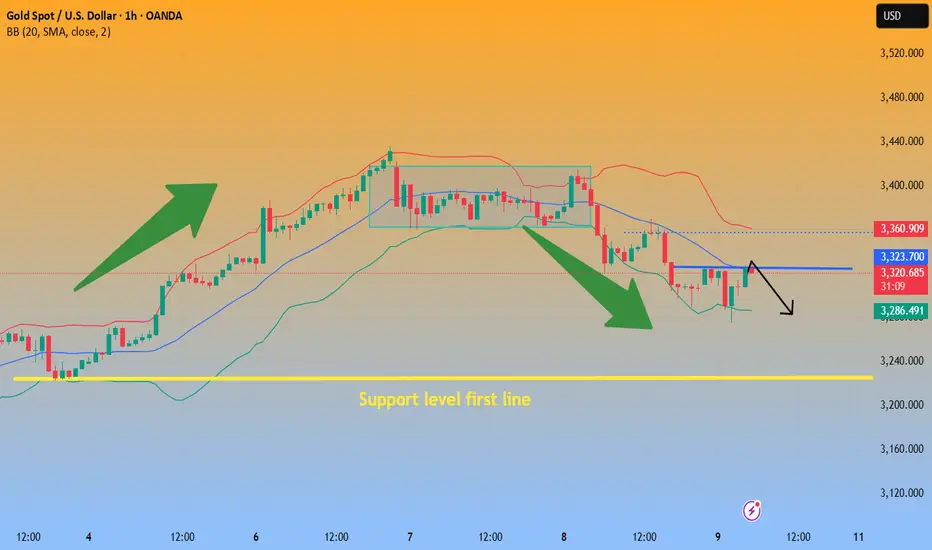
Gold Price Analysis May 9The recent market with big fluctuations with yesterday's D1 candle down 100 price shows that the Sellers have regained their position.
Today's strategy is to watch SELL more than to watch BUY.
The Gold zone is reacting at the 3316 resistance zone and is heading towards 3322 at the end of the Asian session. Today's trading strategy pays attention to the 3322 resistance zone. If the European session does not break, SELL to 3300. If it breaks, hold to 3286. When it breaks 3286, do not BUY anymore but wait until 3325 to be able to BUY.
In the opposite direction, if it breaks 3322, wait for a test and BUY to 3350 and then SELL around 3350 today.
Gold Price Analysis May 7Yesterday's D1 candle continued to be a FULL candle with a 100 price increase. At the beginning of the day, the market opened with a bearish price gap, showing that the market also wants to cool down and today.
Gold is sideways in the range and is running a corrective downtrend.
The support zone for BUY strategies is around 3371, this is the EMA 34 of the h1 frame and is partially supported by the trendline. The next notable area is 3352, which is the old candle wick area and also the support area of yesterday's European session.
The two SELL areas are around 3402 and the Gap opening area is 3423.

Gold prices pulled back. Will prices continue to fall?Latest news: Trump announced a trade deal with the UK, which boosted market risk appetite; coupled with a sharp rise in the US dollar and US bond yields, gold prices plummeted in the Asian morning trading session.
US President Trump and British Prime Minister Starmer announced a "breakthrough agreement" on trade, which made market traders predict that the United States would also reach such an agreement with other countries. This prediction has made market buyers lose motivation.
Quaid believes that if the United States and China reach an agreement, gold prices will face great resistance to rise, and gold prices should fall back to $3,200/ounce.
Market trading analysis:
The upward trend of gold paused and started a sharp decline.
As described by the RSI, buyers are losing momentum. This is not good for gold, and the price has now fallen below $3,300/ounce. Quaid believes that it will continue to fall and may fall to the cycle low of $3,202/ounce.
Short-term trading strategy:
Short at 3280, stop loss at 3290, and take profit at 3260.
Quaid believes that if the price of gold falls below the downward resistance level of 3275, you can continue to hold your position and choose the right time to trade.

The buy low and long strategy is coming!From the 4-hour analysis, the support below is around 3308-3300. If it does not break, the main bullish trend will remain unchanged. The upper side pays attention to the short-term suppression of 3360-66. The daily level stabilizes above this position and continues to maintain the low-multiple rhythm.
Gold operation strategy:
1. If gold falls back on the 3325-3320 line, go long, and if it falls back on the 3310-3300 line, it will cover long positions. The target is 3355-3360.

Gold Potential Bullish ContinuationGold price still seems to exhibit signs of potential Bullish momentum as the price action may form a credible Higher Low with multiple confluences through key Fibonacci and Support levels which presents us with a potential long opportunity.
Trade Plan:
Entry : 3389.8
Stop Loss : 3345
TP 0.9 - 1 : 3430 - 3434

Gold still needs to be shorted after a sharp drop!
💢 Driving factors
Market sentiment was dampened by reports that US President Trump signed a potential trade agreement with the UK, while investors are awaiting the outcome of the US-China trade talks this weekend. In terms of trade agreements, any cooling of the trade war and reduction of uncertainty are bearish for gold. If the US and the UK announce a trade agreement, it will be good for the overall global economy.
📊 Commentary and analysis
In terms of trend, although gold soared in the morning, it continued to fall to 3320 in the afternoon. At present, gold has rebounded moderately but is still under pressure after the sharp drop.
💰 Strategy package
For the US market, it is still a rebound short. Pay attention to the resistance of 3370-74 above. You can directly enter the short position after the rebound, and bet on the second decline of the US market!
⭐️ Note: Labaron hopes that traders can properly manage their funds
- Choose a lot size that matches your funds
- Profit is 4-7% of the capital account
- Stop loss is 1-3% of the capital account

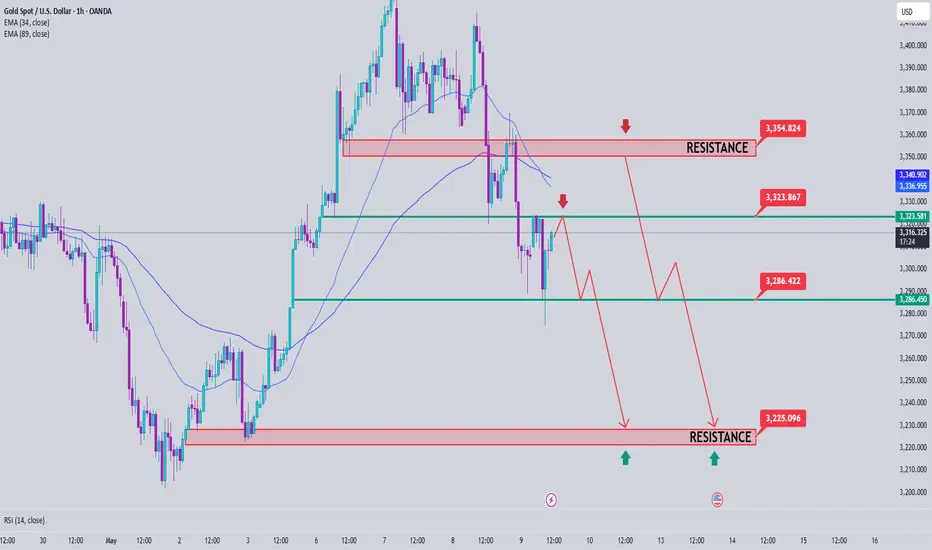
Pay attention to 3360 and go short if it does not break🗞News side:
1. China and the United States hold talks on trade issues
2. India-Pakistan conflict escalates again
3. Geopolitical risks
📈Technical aspects:
At present, gold has fallen below the trend line support. In the short term, we should focus on the battle for 3360. This point is not only the previous support-to-resistance level, but also the key signal for judging the trend reversal. If it cannot hold on to this position, the short trend will continue; if it recovers effectively, it may return to above 3400. Before losing the defensive line (the last starting and falling point) 3360-3362, the bears will still have the upper hand. It just so happens that the 4H lifeline is also in the 3360-3362 area. If the suppression is successful, the price will enter the 3362-3284 area from the lifeline to the lower track.
The rebound layout of the US market operation is short-selling, with the target at 3340-3330, and further support at 3310-3300.
If you agree with this view, or have a better idea, please leave a message in the comment area. I look forward to hearing different voices.
TVC:GOLD FOREXCOM:XAUUSD FXOPEN:XAUUSD FX:XAUUSD OANDA:XAUUSD
After gold falls sharply, how should you trade in the short termAfter gold fell below 3400 today, it ushered in a big decline, falling directly below the key position of 3350. Since gold breaks down, let’s take advantage of the trend and go short
Since the bullish volume of gold market has been released, the bullish trend of gold needs to be repaired in the short term before it can rise further.
Trading idea: short gold near 3347, stop loss 3360, target 3327

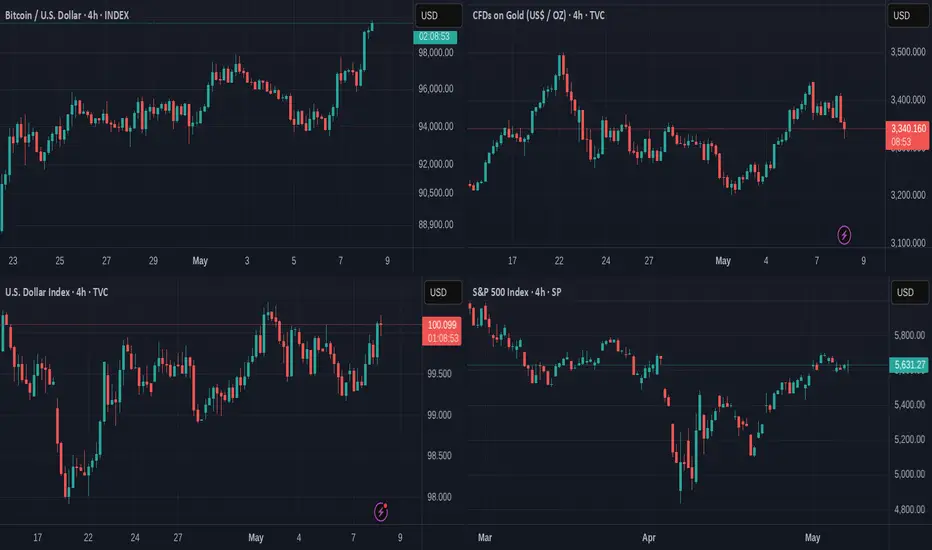
Bitcoin showing itself to be the STRONGEST ASSET right nowThsi is a VERY Bold statement but there is a saying that we need to understand
CHARTS NEVER LIE
This chart is the 4 hour charts of
Bitcoin - Gold
DXY $ - S&P500
There are a number of things to see here.
The First and strongest sign is simply that Bitcoin has risen over the last 36 hours alongside the $ Rising.
This in itself is a huge sign. 80% of the time, these 2 assets go in opposite directions. To me, this is showing a weakness in Faith in the $,
With Lower interest rates, less return on Holding. However, the USa will not want to see the $ drop much further and so I imagine it is being bought up to safeguard its price.
Next week, on the 13th, we have inflation figures published.
We need to watch that Closely.
The $ is currently Lower than it has been for a long time and while this can be seen as a Negative, it has also made American goods cheaper to buy to Foreign Markets, while it has increased the value of other Currencies.
Making the $ cheaper is potentially a Good idea.
At the same time, we see the Global traditional "Safe Haven" Selling off.
The Daily CFD on Gold chart above it has formed a double Top, that usualy creates a draw down.
It is also overbought on a daily after its recent pushes higher.
But more than anything, with interest rates remainiiiiiiiiiiiiiiiiiing static, this has released pressure of investers and so Risk appetite is returning.
Again, we need to watch what happens around the 13th when USA inflation figures are released.
And then the S&P500
Overall, it has been dropping since Feb
This Daily chart shows us It made a recovery but this may not be to go to ATH again but more part of the ABC correction.
There is a possibility it could be forming an inverse Head and Shoulders...so, again, we watch
So, over all, what we see is BITCOIN taking on all the markets and making the biggest gains
It has certainly been the least volatile with Dips and Troughs shallower than the $ and S&P500 which is Stunning if you have ridden Bitcoin for the last 10 years....
Bitcoin has Matured in to a REAL Asset Class..
For me, it is NOT Crypto anymore.
.IT IS BITCOIN
XAUUSD top-down analysisHello traders, this is a complete multiple timeframe analysis of this pair. We see could find significant trading opportunities as per analysis upon price action confirmation we may take this trade. Smash the like button if you find value in this analysis and drop a comment if you have any questions or let me know which pair to cover in my next analysis.

What’s America's Real Goal in a Possible India–Pakistan War?We are nearing the end of the petro-dollar era. The power balance of the new world order will be defined not by oil, but by the strategic resources essential for AI, electric vehicles, and cutting-edge technology.
Throughout the 20th century, the U.S. maintained its global dominance by controlling access to oil. From the Middle East to Latin America and Africa, wherever oil was found, the U.S. was there.
But today, the focus has shifted to rare earth elements, lithium, copper, and other strategic minerals.
Trump’s 2025 move to buy Greenland wasn’t a diplomatic joke—it was a signal. Behind-the-scenes deals in Ukraine for rare earth deposits tell the same story: whoever controls these "white gold" assets will lead the tech-driven world.
Now enters Pakistan, with mineral-rich lands spanning over 600,000 km², nearly three times the size of the UK. Experts estimate its underground reserves to be worth $8 trillion.
In Balochistan's Rekodik field alone, there are 12 million tons of copper and 20 million ounces of gold, with a copper purity of 0.53%, well above global standards. In the north, newly discovered lithium reserves could be a game-changer for the EV revolution.
This is no longer just about resources—this is about deciding the future balance of global power.

XAU/USD 08 May 2025 Intraday AnalysisH4 Analysis:
-> Swing: Bullish.
-> Internal: Bullish.
Analysis and bias remains the same as analysis dated 23 April 2025
Price has now printed a bearish CHoCH according to my analysis yesterday.
Price is now trading within an established internal range.
Intraday Expectation:
Price to trade down to either discount of internal 50% EQ, or H4 demand zone before targeting weak internal high priced at 3,500.200.
Note:
With the Federal Reserve's dovish stance and persisting geopolitical uncertainties, heightened volatility in Gold is expected to continue. Traders should proceed with caution and adjust risk management strategies in this high-volatility environment.
Price could also be driven by President Trump's policies, geopolitical moves and economic decisions which are sparking uncertainty.
H4 Chart:
M15 Analysis:
-> Swing: Bullish.
-> Internal: Bullish.
analysis and bias remains remains the same as yesterday's analysis dated 07 May 2025.
As mentioned in yesterday's analysis that I would continue to monitor price and depth of bearish pullback following previous bullish iBOS.
Price did not pull back with any significance, therefore, I will apply discretion and not mark the previous iBOS. I have however marked this in red.
Price continued bullish and subsequently printed a bearish iBOS to indicate, but not confirm bearish pullback phase initiation.
Price is now trading within an established internal range, however, I will continue to monitor depth of pullback.
Intraday Expectation:
Price to trade down to either discount of internal 50% EQ, or M15 supply zones before targeting weak internal high priced at 3,435.055
Note:
With the Federal Reserve maintaining a dovish stance and ongoing geopolitical tensions, volatility in Gold prices is expected to remain elevated. Traders should exercise caution, adjust risk management strategies, and stay prepared for potential price whipsaws in this high-volatility environment.
Trump's tariff announcement will most likely cause considerably increased volatility and whipsaws.
M15 Chart:

GigaAlgo Gold (XAU/USD) Market Snapshot – May 8GigaAlgo Gold (XAU/USD) Market Snapshot – May 8
Sentiment: Bullish on larger timeframes, but current momentum shows bearish regression on lower timeframes.
Price Action: Gold pulled back sharply after rejecting a resistance area near the premium zone.
Trend: The overall structure remains intact; however, the recent high could be a short-term top if no support bounce occurs.
Key Levels: Price is reacting at a key intraday station. A break lower could target deeper algorithmic destinations.
Smart Money Outlook: Volume gaps below align with the algo’s DEST zones, indicating where liquidity may get swept.
Outlook: Watch for signs of reversal near the support region or continuation if bearish pressure intensifies.
