Gold prices remain volatile, where is the profit range?
💢 Driving factors
Gold prices plunged nearly 2% yesterday, mainly due to the strengthening of the US dollar and the optimism brought about by the upcoming trade talks between the United States and China. The Federal Reserve kept interest rates unchanged on Wednesday, but pointed out that the risks of rising inflation and unemployment increased, which further clouded the economic outlook as the Fed struggled to assess the impact of Trump's tariff policy. When the US dollar strengthens, it means that gold is relatively expensive for buyers holding foreign currencies. But despite the decline in gold prices, it is still supported by global geopolitical risks and central bank buying.
📊 Commentary Analysis
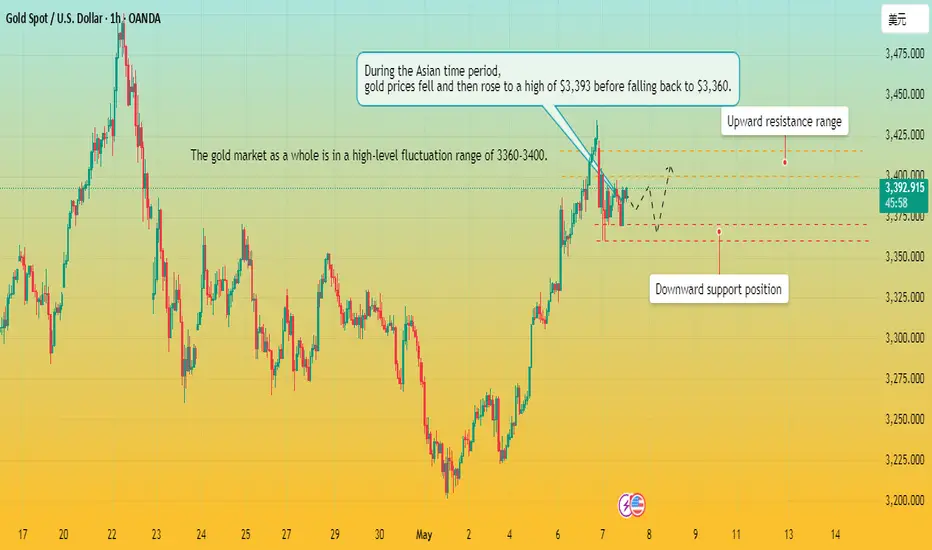
Gold basically fluctuated in the 3400-3360 range today, which is a typical fluctuation. But for high-level fluctuations, we must worry about the breakthrough after the platform is sorted out, and we must also worry about the stagflation retracement, which depends on the time cycle. Therefore, the current trend, people who like fluctuations feel very good, and those who look at one-sidedness feel uncomfortable. Today's early trading operations are still temporarily carried out in the 3400-3360 range, and new layouts will be made after the break!
💰Strategy Package
The Asian session is expected to remain volatile, and both long and short positions have opportunities. You only need to operate at the right time. Go long when the short-term retracement reaches 3370 support, and go short when the upper resistance reaches 3410.
⭐️ Note: Labaron hopes that traders can properly manage their funds
- Choose the number of lots that matches your funds
- Profit is 4-7% of the fund account
- Stop loss is 1-3% of the fund account
Goldprice

The Fed meeting is coming. Will gold fall?Today's news focus:
The US Federal Open Market Committee (FOMC) will announce the interest rate decision;
Fed Powell will hold a monetary policy press conference.
The market generally expects that this meeting will continue to maintain the previous data, because the impact of tariff policies on inflation and the economy still needs to be observed. The Fed's interest rate cut may be carried out in June. Since this interest rate decision does not update the economic forecast, the focus will be on the Fed's incidental comments on any signals of future interest rate cuts to support the economy. Since the decision to keep the interest rate unchanged has been fully digested by the market, Powell's tone at the press conference will be the key to changing the market's expectations for interest rate cuts this year.
Today's gold trend analysis:
At present, according to the hourly chart, gold is still under pressure at the range resistance above 3400; on the one hand, the current tariff storm has cooled down, and on the other hand, the interest rate cut has decreased; and the news data to be released will cause a series of fluctuations in gold in the short term. At the same time, the market is currently betting that the gold price will have a further trend correction, which may cause capital outflows from the market, which will further hit gold bulls.
Quide believes that there is still room for operation in the short term. The resistance level of short-term upward movement is around 3400, but since the game between major powers has not stopped, there will be no major negative factors; if the news data does not fluctuate much, the market may not have a big dive.
Operation strategy:
Short around 3400, stop loss at 3410, and take profit in the range of 3370-3360.
Quide will always pay attention to important news and can provide professional analysis and suggestions for everyone in a timely manner.
I hope to help everyone recover their losses in the gold trading market.

Gold fluctuates in a narrow range ahead of the Fed rate🗞News side:
1. The situation between India and Pakistan escalates
2. China is willing to engage with the US, and the situation has eased
📈Technical aspects:
The price of gold fell sharply after the market opened today, once falling to around 3360. Currently, gold is oscillating slightly between 3375-3390. The market has no clear trading direction for the time being. Gold is not expected to change much before the Federal Reserve interest rate is announced. Today, gold prices have continuously tested the lower support 3370-3360, and the upper short-term resistance is focused on the 3390-3400 line. We maintain shock treatment for short-term trading. The focus will be on today’s Fed interest rate issues and talks between China and the United States.
If you agree with this view, or have a better idea, please leave a message in the comment area. I look forward to hearing different voices.
TVC:GOLD FOREXCOM:XAUUSD FXOPEN:XAUUSD FX:XAUUSD OANDA:XAUUSD

Gold range shock , Both long and short have a chance!📌Fundamentals:
1. There are signs of escalation in the India-Pakistan conflict
2. The US-Houthi ceasefire agreement
3. The Fed's interest rate decision dominates this week's market
4. The international trade situation disturbs market sentiment
5. Market sentiment and capital flows
📊Technical aspects:
The market came out in the Asian session. It stalled again later. We are used to seeing fluctuations of hundreds of points. A fluctuation of more than ten or twenty points a day is the same as no fluctuation. At present, the market is temporarily maintained in the range of 3400-3360, and there is not much fluctuation. At present, let's see where the market breaks through. If it retreats to around 3360, follow up with long orders. If it rebounds to around 3400, follow up with short orders.

Gold fluctuates, long and short operations in the US market!
📊Comment analysis
At 14:00 on Wednesday, US time, Fed Chairman Powell will hold a monetary policy press conference.
The market generally expects that the FOMC will continue to remain on hold at this meeting, as the impact of tariff policies on inflation and the economy remains to be seen; the Fed may cut interest rates in June. Since this interest rate decision does not update economic forecasts, the focus will be on the Fed's accompanying comments on any signals of future interest rate cuts to support the economy. Since the decision to keep interest rates unchanged has been fully digested by the market, Powell's tone at the press conference will be the key to changing the market's expectations for interest rate cuts this year.
💰Strategy package
The US market is expected to remain volatile, and both long and short positions have opportunities. You only need to operate at a certain point. Go long on a short-term retracement to 3378 support, and go short when it reaches the upper resistance of 3408.
⭐️ Note: Labaron hopes that traders can properly manage their funds
- Choose a lot size that matches your funds
- Profit is 4-7% of the capital account
- Stop loss is 1-3% of the capital account

Gold is under pressure at 3400, with a short-term decline expectGold is under pressure around 3400. Today we will have the Fed's interest rate decision and Powell's speech. If gold is under pressure at 3400, it is expected to fall. Before the data, we need to be cautious.
In terms of trading ideas, we can short short-term, pay attention to the short near 3393-96, stop loss 3403, take profit 3360/3350

XAUUSD: Price Mitigated Earlier, We Got Left Behind! Hey Everyone
Happy Friday
So, yesterday, we were expecting gold prices to dip down to around 3172. But guess what? It didn’t quite go as planned! The price took a nosedive from 3208 and is currently sitting at 3260, almost 520 pips move.
It’s not always going to be a smooth ride, so let’s not get discouraged. We can focus on analysing this chart and keeping an eye on the price as it moves.
Once the trade is activated, there are two targets you can set. You can choose your own take-profit based on your analysis and trade management.
Good luck and trade safely! 😊
Thanks a bunch for your unwavering support! ❤️🚀
If you’re feeling generous, here are a few ways you can help us out:
- Like our ideas
- Comment on our ideas
- Share our ideas
Cheers,
Team Setupsfx_
❤️🚀

Gold bides its time. Bulls are suppressed at high levels?
Gold is waiting for the Fed's interest rate decision.
analysis in Asian time period:
Gold opened with a sharp drop due to international news, and continued to fluctuate at a high level in the 3360-3400 range predicted by Quaid. I predicted in the early Asian session that the price of gold would rise to around 3390 and then fall back to around 3370-3360. And its trend is just as Quaid predicted and analyzed, with a correction after the predicted high point.
Now it seems that gold has fallen into a high-level fluctuation range after a sharp drop in the early Asian session, which is in line with my expectations. Quaid believes that the trend direction of the European session is very important. The current upward suppression range is between 3400-3415, and the downward support level is between 3360-3370;
On the contrary, if the European session falls below the downward support range, it may continue to fall.
But Quaid believes that the overall upward trend of gold prices has not changed. Gold prices are just accumulating strength now, and will continue to rise after the adjustment.
Overall trend analysis:
Quaid recommends that the long strategy is still the main one. If the support range of 3360-3370 can resist the downward trend, then we can still carry out the long strategy after the price falls back.
Operation strategy:
Long strategy: Go long when the price falls back to 3365, stop loss 3350, take profit range 3400-3415.
Short strategy: Go short at 3395, stop loss 3405, take profit 3360.
XUA/USD) bullish trend analysis Read The ChaptianSMC Trading point update
Technical analysis chart for Gold Spot (XAUUSD) on the 4-hour timeframe. Here's a breakdown of the key ideas behind the analysis:
1. Trend and Structure:
The overall trend shows a bullish move followed by a correction and now a potential continuation upward.
A bullish breakout from a descending trendline suggests a shift in momentum from bearish to bullish.
2. Key Zones:
Order Block / Buying Zone (~3,280-3,310): A demand area where price is expected to find support and potentially bounce higher.
Support Level (~3,320-3,360): Price is currently above this level, suggesting buyers are in control.
Resistance Level (~3,440-3,495): Marked as a potential short-term ceiling; a breakout above this level may signal strong bullish continuation.
Target Point (~3,494): This is the projected take-profit level for a bullish move.
3. RSI Indicator:
RSI is around 63–64, close to overbought territory but not yet extreme. This suggests moderate bullish momentum without signs of immediate reversal.
4. Projected Move:
The chart outlines a possible retracement to the support or order block zone, followed by a bounce and a push toward the resistance level and target.
Mr SMC Trading point
Strategy Implication:
Buy on pullback to the support or order block zone.
Stop-loss could be placed below the order block (~3,280).
Take-profit around the target zone (~3,494).
pales support boost 🚀 analysis follow)

XAU/USD) Bullish reversal analysis Read The ChaptianSMC Trading point update
technical analysis of Gold Spot (XAU/USD) on the 4-hour timeframe, projecting a bullish outlook. Here's a breakdown of the main ideas conveyed:
1. Support Level & Double Bottom
A strong support level is marked around the 3,177 area, with the price bouncing from it twice (highlighted by two black dots), indicating a potential double bottom pattern, which is typically a bullish reversal signal.
2. EMA 200 Support
The 200 EMA (Exponential Moving Average) lies just below the current price (~3,177), acting as dynamic support. The fact that price is holding above it adds strength to the bullish argument.
3. Bullish Divergence on RSI
The RSI (Relative Strength Index) shows a bullish divergence, where the price made lower lows but RSI made higher lows—another potential reversal indicator.
4. Price Projection
If the bullish move plays out, the chart outlines two upward targets:
Target Point: ~3,501.67
Next Target Point: ~3,729.23
These are based on measured moves from previous impulse legs (shown by vertical blue projections).
5. Entry Setup
The chart suggests a break above the short-term consolidation could trigger the bullish run toward the first target, aligning with bullish price structure and support confirmation.
Mr SMC Trading point
---
Overall Idea: The chart expects a bullish reversal from support, confirmed by double bottom, EMA 200 support, and RSI divergence, targeting higher resistance zones.
Pales support boost 🚀 analysis follow)

XAU/USD 07 May 2025 Intraday AnalysisH4 Analysis:
-> Swing: Bullish.
-> Internal: Bullish.
Analysis and bias remains the same as analysis dated 23 April 2025
Price has now printed a bearish CHoCH according to my analysis yesterday.
Price is now trading within an established internal range.
Intraday Expectation:
Price to trade down to either discount of internal 50% EQ, or H4 demand zone before targeting weak internal high priced at 3,500.200.
Note:
With the Federal Reserve's dovish stance and persisting geopolitical uncertainties, heightened volatility in Gold is expected to continue. Traders should proceed with caution and adjust risk management strategies in this high-volatility environment.
Price could also be driven by President Trump's policies, geopolitical moves and economic decisions which are sparking uncertainty.
H4 Chart:
M15 Analysis:
-> Swing: Bullish.
-> Internal: Bullish.
As mentioned in yesterday's analysis that I would continue to monitor price and depth of bearish pullback following previous bullish iBOS.
Price did not pull back with any significance, therefore, I will apply discretion and not mark the previous iBOS. I have however marked this in red.
Price continued bullish and subsequently printed a bearish iBOS to indicate, but not confirm bearish pullback phase initiation.
Price is now trading within an established internal range, however, I will continue to monitor depth of pullback.
Intraday Expectation:
Price to trade down to either discount of internal 50% EQ, or M15 supply zones before targeting weak internal high priced at 3,435.055
Note:
With the Federal Reserve maintaining a dovish stance and ongoing geopolitical tensions, volatility in Gold prices is expected to remain elevated. Traders should exercise caution, adjust risk management strategies, and stay prepared for potential price whipsaws in this high-volatility environment.
Trump's tariff announcement will most likely cause considerably increased volatility and whipsaws.
M15 Chart:

XAU/USD Analysis: Chart Indicates Elevated VolatilityXAU/USD Analysis: Chart Indicates Elevated Volatility
The XAU/USD chart shows that the ATR (Average True Range) indicator has reached its highest level in several weeks, signalling increased market volatility.
In addition, trading activity is being fuelled by heightened geopolitical tensions, now including an escalation of the conflict between India and Pakistan.
The price action analysis of the precious metal also provides valuable insight, highlighting the ongoing battle between supply and demand.
Technical Analysis of the XAU/USD Chart
On 23 April, we noted a sharp shift in sentiment after the price of XAU/USD peaked around $3,500.
Gold price fluctuations today suggest continued bearish pressure above $3,400, leading to a downward reversal at peak B, which sits below the previous high at A.
This forms the basis for outlining a descending channel and suggests that bears may attempt to keep the price within its boundaries. On the other hand, the $3,333 level was decisively broken by a wave of buying (shown with a blue arrow), and a bullish “cup and handle” pattern is emerging in the background — it is possible that, as part of the May rally, bulls may try to surpass peak B.
Whatever the outcome, elevated volatility appears likely to persist — especially with the US Federal Reserve’s interest rate decision due today at 21:00 GMT+3, followed by Jerome Powell’s press conference at 21:30.
This article represents the opinion of the Companies operating under the FXOpen brand only. It is not to be construed as an offer, solicitation, or recommendation with respect to products and services provided by the Companies operating under the FXOpen brand, nor is it to be considered financial advice.

Are gold bulls regaining control of the market?
📌 Driving factors
The latest news from the Chinese Ministry of Foreign Affairs on Wednesday showed that Chinese Vice Premier He Lifeng will visit Switzerland from May 9 to 12. During this period, he will serve as the Chinese leader of Sino-US economic and trade and hold talks with the US leader, US Treasury Secretary Benson.
Beijing said that on the basis of fully considering global expectations, Chinese interests, and the calls of the US industry and consumers, China decided to agree to engage with the US. Any dialogue and negotiation must be carried out under the premise of mutual respect, equal consultation, and mutual benefit. If the United States attempts to continue to coerce and blackmail under the guise of talks, China "will never agree."
The market is paying attention to the policy decision announced by the Federal Reserve on Wednesday. It is expected that the Fed will keep interest rates unchanged at the meeting, but this meeting may be the last meeting with such a clear result.
Federal Reserve Chairman Powell is unlikely to provide clear guidance on how the Fed plans to respond to U.S. tariffs. Macquarie analysts led by Thierry Wizman wrote in an investor report, "If traders naively believe that the Fed will save the world and use obvious "dovish" signals to alleviate the recent increase in policy and political uncertainty, then they should think again."
In addition, investors also need to pay attention to the impact of news related to the geopolitical situation. This week, Israel and the Houthi armed forces "fought hard", which also provided safe-haven buying support for gold prices. There have also been some conflicts between India and Pakistan, which investors need to pay attention to.
📊Comment Analysis
Gold price awaits today's interest rate result, rebounded well above 3400 but then fell immediately, indicating that the market is not ready for the first rate cut, and if there is, gold price may face strong selling pressure today
💰Strategy Package
Long position:
Actively participate near 3365 points, profit target is around 3420 points
⭐️ Note: Labaron hopes that traders can properly manage their funds
- Choose the number of lots that matches your funds
- Profit is 4-7% of the fund account
- Stop loss is 1-3% of the fund account

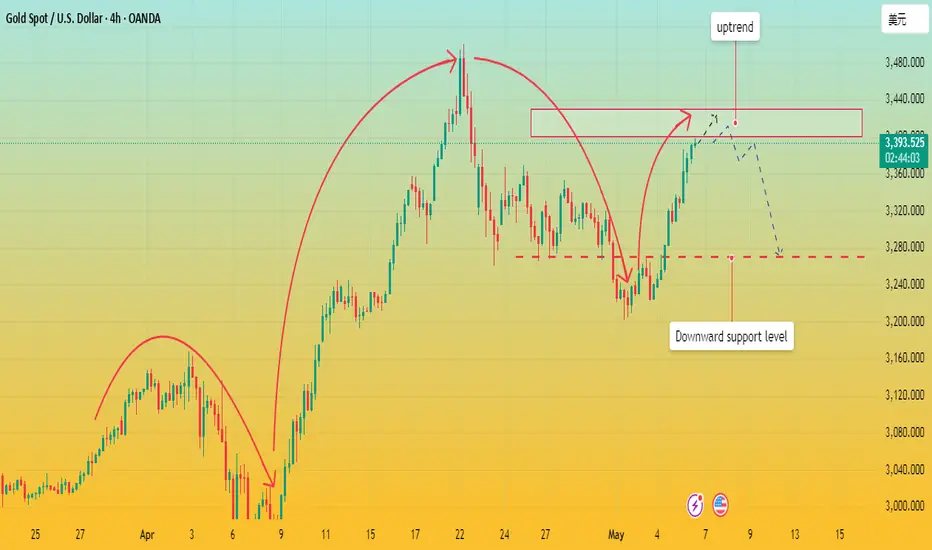
Gold price fell after a high? Trend reversal?Analysis of Asian morning session:
The recent high point of gold price reached 3437 US dollars, and it fell sharply after the Asian morning session opened. The gold market opened after the Asian holiday, and the bulls rose strongly; the Asian morning session was volatile, and the current lowest reached around 3360, a drop of 77 US dollars.
Then it adjusted back and reached a high of around 3404; this position can be used as an important resistance level at the opening time of the Asian session. Between the sharp rise in the morning of the past two days, and the upward continuity of the European and American sessions, coupled with the recent continuous rise and fall, the rapid fall in the Asian morning session.
Quaid believes that in this continuous upward pattern, once there is a sharp fall, it is also likely to be a signal of insufficient bullish power in the short term; then we need to consider whether the bears can reverse, and the current upper pressure position is at 3395 US dollars, and the lower support level is at 3360 US dollars, which is equivalent to the previous top and bottom conversion.
Operation strategy:
Short when the price returns to 3390, take profit at 3370-3360, stop loss at 3400.
Good luck to everyone.

Gold is rising strongly. When can the bull market stop?🗞News side:
1. Trump announces renegotiation of USMCA
2. Pay attention to the Fed interest rate
📈Technical aspects:
Looking at the daily chart, gold prices are breaking through important resistance levels and forming a strong upward trend. The price is currently trading around 3410, with strong suppression at 3420-3430 above the short-term. If the gold price encounters resistance and pressure, gold may once again experience a correction. Therefore, when the gold price touches the 325-3435 line, you can try to place a short position. In terms of operation, after two consecutive positive days on the technical front, the bulls will continue further. The current short-term support has moved up to the 3386 line. 3386 is the early resistance that turned into support after breaking through. This will be an important support level. At the same time, the 3270-3260 line support below is still strong. Continue to look at the 3430-3450 line. Therefore, in terms of operation, we mainly do long positions on callbacks and supplementary short positions on rebounds.
If you agree with this view, or have a better idea, please leave a message in the comment area. I look forward to hearing different voices.
OANDA:XAUUSD FX:XAUUSD FXOPEN:XAUUSD FOREXCOM:XAUUSD TVC:GOLD

The most important golden strategy📌Fundamentals:
Focus on the Federal Reserve's interest rate decision
📊Technological aspects:
From the golden hour chart, the Asian market is in line with a wave of continued gains and the subsequent adjustment to the 10 moving average of 3350 has stabilized. The European market has slowly moved higher and is approaching the Asian market high. This pattern is still very strong, and there is a high probability of a second rise tonight; The 10 EMA is above 3370 as the primary support and continues to be bullish. As each line closes, the moving support will slowly move up. As long as it does not effectively break, the short squeeze will continue. A breakthrough of 3410 will also happen at any time. If it breaks through, it will be easy to continue to storm above 3420. If it rushes higher and falls back in the evening and falls below the 10 EMA, then If it adjusts to the middle track for the first time, there will still be good support, just continue to be bullish; comprehensively speaking, today's short-term gold operation ideas suggest that the callback is mainly long, and the rebound is supplementary.
🎯 Practical Strategy:
Short strategy: short gold when it rebounds around 3425-3430, target around 3400-3380.
Long strategy: long gold when it pulls back around 3365-3370, target around 3400-3420.

WHAT DO YOU THINK ?Hello dears
Given the regular sinusoidal trend that gold is taking, it was expected to move to the specified numbers, but don't forget that we are at a price ceiling and a sharp upward movement at the end of the upward trend can be a trap...
In case of a drop, the specified ranges are good support.
*Trade safely with us*

Gold price breaks through 3400. Bulls take control?Gold price breaks through the 3400 resistance level I predicted. And there is a trend of continuous rise.
Next, Quaid will comprehensively analyze the current market situation for all traders.
Technical analysis:
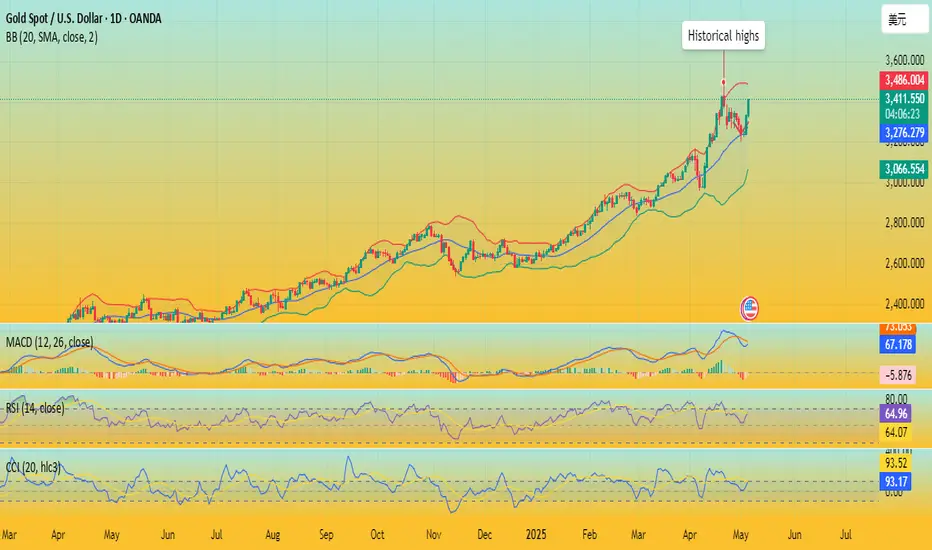
From the daily chart, the gold price has broken through the important resistance level and formed a strong upward trend. Currently trading above $3400, it has successfully broken through the key resistance range of $3385-3400. The Bollinger Band indicator shows that the middle track is at 3231.01, the upper track is at 3485.06, and the lower track is at 2976.97, indicating that the current price is near the upper track of the Bollinger Band, showing strong upward momentum.
The RSI indicator shows that the current value is 64.8, which is in the neutral to strong area, and has not yet reached the overbought level, and there is still room for growth.
Quaid believes that in the short term, if gold stabilizes above $3,400, it may hit $3,430-3,450. Once it breaks through, it will open up the possibility of a higher price.
Market sentiment observation:
The current market sentiment is clearly biased towards risk aversion, and global geopolitical tensions have become the main driving force for gold to rise. The continued tension of geopolitical conflicts and political uncertainty in Germany have prompted market participants to seek safe assets. At the same time, expectations for the Fed's future monetary policy shift are also increasing. Although the possibility of a rate cut in May is extremely low, the probability of a rate cut in the June meeting is close to 30%.
Liquidity indicators show that the trading activity in the gold market has increased and institutional funds continue to flow in, indicating that bullish sentiment in the market has the upper hand in the short term. Technical indicators have not shown obvious overbought signals, which means that the current rally still has room to continue. Compared with other asset classes, gold's relative strength is outstanding, especially in the context of the possible challenges to the status of the US dollar as a safe haven asset.
Outlook for the future
In the short term: Gold prices may continue to rise to test the $3,400-3,500 area. The Fed's decision will be a key trigger for gold prices in the near term. If the Fed shows a dovish attitude, gold prices are expected to further break through historical highs.
Medium term: Global geopolitical uncertainty is expected to continue to support gold prices. If geopolitical conflicts escalate further or the situation in the Middle East deteriorates, safe-haven demand may push gold prices to hit the $3,600 level. At the same time, market expectations of a shift in the Fed's monetary policy will be another key factor affecting gold prices.
Long term: From a macro perspective, the current combination of slowing global economic growth and geopolitical tensions will continue to provide support for gold.
Short-term entry can be made at key points.📊Technical aspects:
|Gold showed a clear upward trend today driven by risk aversion, mainly because Trump announced a 100% tariff on films produced overseas, a move that triggered global concerns about trade wars and exacerbated economic uncertainty. In order to avoid risks, investors have turned to traditional safe-haven assets such as gold, resulting in a surge in demand for gold and a subsequent rise in prices. Currently, from the perspective of technical indicators, the 4-hour moving average is in a bullish arrangement, the Bollinger band is in an enlarged form, and the gold price is running close to the upper Bollinger band. Gold is still bullish, but the RSI shows overbought. Don't chase highs and beware of gold's highs and falls. It is recommended to go long again after a pullback.
🎯Practical strategy:
Go long when gold falls back to around 3385-75, with a target of around 3400. If it does not break, you can go short near 3400 and see a fall back near 3384.

Gold - All eyes on Wednesday 08 May - FED🟡 Gold Traders: Nothing Matters Until Wednesday! ⏳💤
Hey traders! 👋
This week, all eyes are on Wednesday... and everything before that? Mostly noise.
Let me break it down for you. 👇
📊 Technical Outlook
Gold is chilling above a key resistance level right now.
Trendlines suggest we won’t see any major moves before Wednesday unless big news drops. 📰
🕐 Asian session is kicking things off above resistance.
If bulls show up there, we could break Trendline 1 (Image below) and head towards the $3300 🎯 target.
📉 RSI across multiple timeframes? Pretty neutral.
If Asia trades flat or slightly bearish, gold might range between $3210–$3250.
Break below $3201, and things could get shaky... but the European session might push us back above that support.
U.S. session on Monday? Likely a sideways snoozefest 😴 (unless surprise news hits).
🎯 Trade Setup (Mon–Wed)
I’m looking to play the range between:
$3261 (Trendline 2) 🔼 and $3169 (Trendline 4) 🔽
That’s a comfy $90 window I’m aiming to trade before Wednesday's fireworks. 🚀
🔮 After Wednesday – The FED Factor 💣
Here’s the real catalyst:
Wednesday, May 7 at 2:00 PM EST – FOMC Rate Decision
If the FED cuts rates (not likely, but possible under pressure), gold could tank hard. 💥
I’m talking a potential drop to $3150 or lower 🕳️📉
That’d be a -$90+ move easy.
FED has been holding the line 💪, resisting pressure (especially from Trump back in the day), but if the economy flashes red, that rate cut might come sooner than expected.
🧠 Final Thoughts
FED paused hikes, but left the door open for 3 rate cuts this year.
Until we get more clarity, no strong bullish signals on gold.
My bias stays: Bearish unless proven otherwise. 🐻💬
Stay sharp out there, and watch those sessions. Wednesday’s the real deal! 💼📉
And last but not least, look at this and let us know what you think about please:
Some would say its impossible but as we know, gold can do everything!
-------------------------------------------------------------------------
This is just my personal market idea and not financial advice! 📢 Trading gold and other financial instruments carries risks – only invest what you can afford to lose. Always do your own analysis, use solid risk management, and trade responsibly.
Good luck and safe trading! 🚀📊

Gold's upward momentum continues. Will gold continue to see an uFundamental analysis:
Tomorrow will see the decision of the Federal Open Market Committee, which may pose a risk to bulls as the Fed is likely to refute the market's aggressive dovish pricing expectations. From a more macro perspective, as the Fed implements loose policies, real yields may continue to fall and gold is still in an upward trend. But in the short term, more positive news on tariffs and a hawkish stance by the Fed may trigger a further decline in gold prices as the market readjusts to the new situation.
Technical analysis:
Gold prices broke through the shock range strongly in the early Asian session, jumping from $3,330 to $3,386, and then slowly fell to $3,350; it climbed again to $3,385 during the European session. The European session did not break through the early high, but there was no excessive retracement, and the European session as a whole maintained high shocks. Looking at the 4-hour chart, the current upward resistance is 3,395, and the support level is 3,350 below. If the upward movement today can strongly break through the resistance level of 3395, the price of gold may reach the high point of 3400-3430.
If the price of gold fails to break through the resistance level of 3395 and continues to fluctuate at a high level, it will prepare for a continuous rise and break through the high.
Operation strategy:
Long strategy: enter the market and do more, and the upward range looks at the high point of 3400-3430.
Short strategy: short at 3410, and the downward position looks at the support range of 3370-3350.
Long positions in the US market remain the main trend🗞News side:
1. The “demand shock” of the Trump administration’s tariffs on the global economy
2. The United States rejected Japan’s request for a comprehensive exemption from 10% reciprocal tariffs and country-specific tariffs in recent negotiations.
3. The conflict between Israel and the Houthis
📈Technical aspects:
The 4H golden moving average spreads upward, the MACD golden cross opens upward, and the 4H overall bullish trend is seen. Gold price encountered resistance at 3386 in the morning of the Asian session. This point can be used as a reference in suppressing the market outlook. If this resistance is effectively broken through, bulls are expected to continue to work towards the 3400 first-line mark above. The daily chart is positive, and the K-line combination is relatively strong. The US market is expected to break through 3386 and reach the space above 3400; the SMA10 moving average of 3370 continues to be bullish as the primary support, with strong resistance to 3400. Even if the price of gold in the US market rises and falls, the middle track of the Bollinger Bands still has good support. On the whole, we mainly focus on long positions in short-term trading. We can consider the 3370-3380 layout to go long, with the target looking towards 3400-3410 above.
If you agree with this view, or have a better idea, please leave a message in the comment area. I look forward to hearing different voices.
TVC:GOLD FOREXCOM:XAUUSD FXOPEN:XAUUSD FX:XAUUSD OANDA:XAUUSD

3420, gold prices can reach today
📌 Gold driving factors
Driven by the weakening of the US dollar and safe-haven demand, spot gold closed up $93.77 on Monday, up 2.9%, at $3333.32 per ounce.
On Monday local time, US President Trump signed an order on biomedical research, hoping to take the opportunity to promote the US pharmaceutical manufacturing industry. Trump also announced that tariffs on pharmaceutical products will be announced in the next two weeks.
Kitco Metals senior metals analyst Jim Wyckoff said: "We see continued inflows of safe-haven demand, keeping gold prices high. Gold prices will remain above $3,000 per ounce, at least in the short term."
Gold is often seen as a safe-haven tool in uncertainty and performs well in a low-interest rate environment. Gold prices have soared 26.3% this year and have set new historical highs many times.
📊Comment Analysis
Bulls regained their dominance, and the upward trend approached above 3400 before the market expected a rate cut
💰Strategy Set
🔥Sell Gold Area: 3418-3420 SL 3425
TP1: $3410
TP2: $3400
TP3: $3385
🔥Buy Gold Area: $3323 - $3321 SL $3316
TP1: $3330
TP2: $3340
TP3: $3358
⭐️ Note: Labaron hopes that traders can properly manage their funds
- Choose the number of lots that matches your funds
- Profit is 4-7% of the fund account
- Stop loss is 1-3% of the fund account
