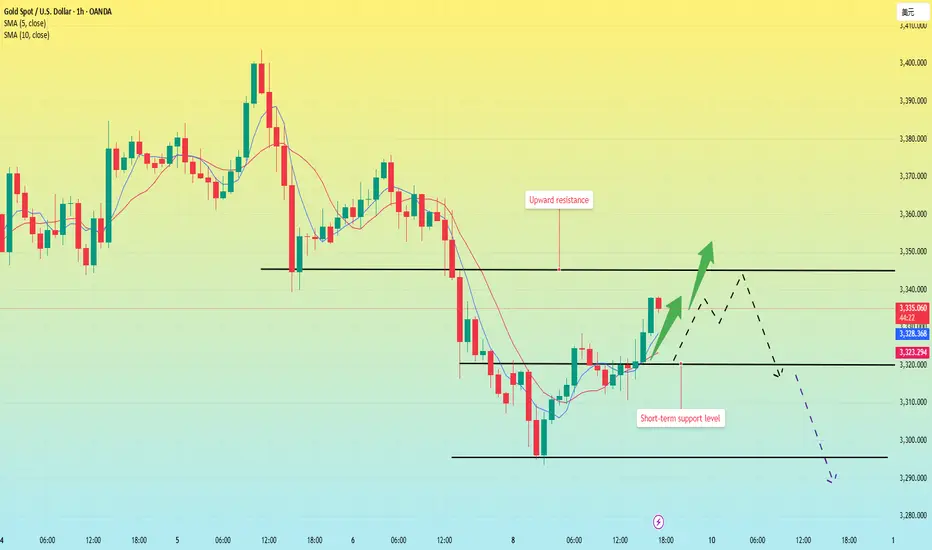
Gold price rebounds, short-term strength?After the opening of the U.S. stock market today, the price of gold rose rapidly, breaking through the first resistance level of 3325, and currently reaching the intraday high of 3337.
However, from the hourly chart, the current price has not reached the upward trend point I predicted, so the price is likely to rise slightly again in the future.
From the 4-hour chart, gold rose again after falling back in the U.S. market, and the price broke through the 3325 position upward, which means that the short-term is strong; in the morning analysis, I predicted that gold would fall back and rush high, and the fall back can be short-term long, and the volatile market can be operated in the short term according to this strategy.
At present, the 4-hour MA5-day and 10-day moving averages have a trend of forming a golden cross upward, and after the fall in the morning, the moving averages are currently showing an upward turning trend.
Therefore, after the price breaks through 3325, the probability of continuing upward is still relatively large, and the pressure position is 3345; this position is the point after the fall back from the high point in May, and it is also an important pressure position after the current price falls back and rebounds.
The price is currently heading towards a retest of 3340-3345 levels. If the dollar continues to fall and gold manages to consolidate above 3345, the bullish trend is likely to continue. However, a false breakout of 3340-3345 area could trigger a further decline following the breakdown of the bullish structure.
Goldprice
Evening gold trend analysis and operation layout📰 Impact of news:
1. The streets of Los Angeles are full of "gunpowder smell"! Immigration protests escalate, and Trump sends troops to suppress them
2. Geopolitical situation
3. Federal Reserve political expectations
📈 Market analysis:
Gold rebounded as expected and touched the 3330 line. In the short term we need to pay attention to the 3335 line. On the one hand, it is the top and bottom, and on the other hand, the annual average line is also the pressure point of the upper track of the downward channel. Once it is suppressed below 3335, it will continue to fluctuate downward. If it unexpectedly breaks through 3335 or even 3340, then 3293 is likely to become the short-term bottom.
At present, the rise has slowed down after rising to 3330, and the technical side shows a top divergence signal, so in the short term, we still maintain the idea of shorting at a high level of fluctuation.
🏅 Trading strategies:
SELL 3335-3345-3355
TP 3310-3300
If you agree with this view, or have a better idea, please leave a message in the comment area. I look forward to hearing different voices.
TVC:GOLD FXOPEN:XAUUSD FOREXCOM:XAUUSD FX:XAUUSD OANDA:XAUUSD

Gold May See Short-Term Correction As US-China Talks Loom💡 Suggested Trading Strategies
SELL XAU/USD at: $3,320 – $3,326
🎯 TP: $3,300
❌ SL: $3,330
BUY XAU/USD at: $3,296 – $3,300
🎯 TP: $3,320
❌ SL: $3,290
📊 Market Summary
Gold prices have been volatile recently due to high-level trade negotiations between the US and China. Investors are cautious as a potential breakthrough could ease tensions and reduce safe-haven demand for gold.
📌 Outlook
Gold may decline slightly toward the $3,296–$3,300 range if no breakthrough is achieved in US-China talks. However, a positive outcome could trigger a rebound toward the $3,326–$3,340 zone.

Gold hits 3335 in the US market and shorts
⭐️Gold information:
Looking back at last week's trend, after hitting a high on Monday, gold prices fluctuated in a range from Tuesday to Thursday, and closed with a sharp drop on Friday, forming an M-top pattern from a technical perspective.
This week, the market focus is on the high-level trade negotiations between China and the United States held in London. The market expects that the negotiations will proceed smoothly, and this optimism is bearish for gold. Based on the comprehensive technical and fundamental analysis, the gold price is still bearish today. It is recommended to pay attention to the short-selling opportunities in the rebound range of 3330-3340 US dollars.
⭐️Set gold price:
🔥Sell gold area: 3330-3340 SL 3345
TP1: $3320
TP2: $3310
TP3: $3295

Gold is falling, waiting for the trend to be completed?The Asian market continued to fall on Friday in the early trading on Monday, reaching a low of around 3293. It then bottomed out and rebounded, reaching a high of around 3325, and is currently maintaining a consolidation around 3320.
From the hourly chart, gold is completing the fifth wave in the wave trend; in the short term, gold is in a rebound trend, and has been maintaining this upward trend channel.
As long as it cannot fall below 3310 next, the gold rebound has not ended, and it may directly test the top around 3345. Because 3345 is exactly the bottom of the first wave, the rebound trend from 3293 is likely to be the fourth wave.
As long as the fourth wave rebound cannot strongly break through the bottom of the first wave at 3345, then the fifth wave will most likely show a downward trend.
Therefore, the current trading operation is basically simple;
Long strategy: long at 3315-3320, stop loss at 3305, and profit range at 3340-3350.
Short selling strategy: wait for the price to stabilize near 3345 and then enter the market to short sell.
Important tip: If the price falls from 3345, it is highly likely to go down directly to the low point of 3280-3250.

Gold weakness continues, bears continue to exert force📰 Impact of news:
1. The streets of Los Angeles are full of "gunpowder smell"! Immigration protests escalate, and Trump sends troops to suppress them
2. Geopolitical situation
3. Federal Reserve political expectations
📈 Market analysis:
At present, the hourly moving average of gold price is spreading downward. At the same time, the 4H chart has retreated from a high and lost the middle track, breaking through the rising trend line. The low point of the trend line coincides with the middle track. Today's operation uses the low point of 3330-3335 as the critical point of strength and weakness. If the market rebounds below this range, you can just go bearish. If it breaks through this dividing point, you need to be cautious. On the whole, the recommended short-term operation strategy for gold today is to mainly short on rebound. Focus on the resistance of 3330-3340 on the upper side in the short term, and focus on the support of 3290-3280 on the lower side in the short term. The market fluctuates greatly, and stop loss is strictly controlled!
🏅 Trading strategies:
SELL 3325-3335
TP 3300-3290-3280
If you agree with this view, or have a better idea, please leave a message in the comment area. I look forward to hearing different voices.
TVC:GOLD FXOPEN:XAUUSD FOREXCOM:XAUUSD FX:XAUUSD OANDA:XAUUSD

Gold support near 3280 remains strong!
⭐️Gold information:
Gold prices (XAU/USD) stabilized near $3,310 in early Asian trading on Monday, and gold prices struggled to gain momentum against the backdrop of renewed strength in the U.S. dollar (USD). As of press time, gold was around 3315 points. Although the strengthening U.S. dollar posed resistance to gold, lingering uncertainty surrounding President Trump's tariff strategy continued to provide some support for it.
On Friday, optimistic labor market data boosted the dollar and put pressure on dollar-denominated assets such as gold. The U.S. Bureau of Labor Statistics (BLS) reported that nonfarm payrolls increased by 139,000 in May, exceeding expectations of 130,000 and exceeding the revised 147,000 (originally 177,000) last month. The stronger-than-expected employment report dampened hopes for a near-term rate cut by the Federal Reserve and weighed on the appeal of gold prices.
⭐️Set gold price:
🔥Sell gold area: 3348-3350 SL 3355
TP1: $3340
TP2: $3330
TP3: $3320
🔥Buy gold area: $3281-$3279 SL $3274
TP1: $3292
TP2: $3300
TP3: $3315

XAUUSD - Trader's psychology - Hesitation⭐The Setup Was Perfect, and You...
You did everything right.
Marked the zone. Waited for price. Saw the reaction.
But you didn’t take the trade — or you hesitated, entered late, and missed the real move.
Sound familiar?
This article isn’t about strategy. It’s about what happens between your plan and your execution — and why even the most perfect setups won’t save you if you’re not mentally ready to pull the trigger.
🚨 Why Hesitation Happens
Most traders don’t miss trades because the setup wasn’t unclear.
They miss because of inner conflict.
❗ They doubt their read
❗ They chase confirmation
❗ They fear being wrong
❗ They overanalyze instead of executing
The irony? The more they learn, the worse it gets — because more information means more pressure to be right.
🔁 Here’s how it usually looks:
You watch price approach your zone.
It taps in — but instead of entering, you stare, waiting for a candlestick pattern or a feeling of “certainty.”
By the time you move, the market already made the move.
Now you’re chasing, or watching in frustration.
It’s not your setup that failed.
It’s your ability to act in the moment.
🧩 The Identity Problem
You don’t trade what you see.
YOU TRADE WHAT YOU BELIEVE ABOUT YOURSELF. (Read this again and again!)
A trader who doesn’t truly believe they deserve to win will sabotage themselves in the most subtle ways:
They’ll wait too long
Or enter too early
Or close too fast
Or move the SL to feel “safe”
Not because the chart said so — but because their inner narrative said:
“You’re probably wrong. You mess it up too much. Play it safe.”
If you act like a spectator, you’ll always miss like one.
The market doesn’t reward analysts. It rewards conviction.
🔁 The Real Pattern: Overthinking > Hesitating > Missing > Frustration > Revenge
It’s a loop. And it starts with not trusting your process.
Once you hesitate, everything spirals:
You miss the clean entry
You enter late and take a worse R:R
You get stopped out or close early
You enter another trade out of revenge
You lose again — and blame the setup
But the setup wasn’t the problem.
You weren’t ready.
🔨 Fixing the Execution Gap
How do you stop hesitating?
Not with journaling. Not with meditating. Not with fluff.
You stop by building clarity — fast.
✅ Before the session, take a few minutes.
Ask yourself:
What setup am I waiting for?
What would cancel it?
Say it out loud. That’s it.
✅ When price enters the zone, say:
“This is it. Let’s go.”
No overthinking. No pause. No doubt.
Imagine this: you’re watching Gold hit a reaction zone you’ve marked all morning.
Instead of watching five indicators, you’ve already made the decision.
Price touches → you execute. Done.
✅ After the trade, ask just one question:
Did I do what I said I’d do?
If yes, you won. Even if it lost.
🎯 Train the Moment
Want to build real confidence?
Start training the execution moment — not just the strategy.
Here’s how:
Visualize 2 types if entry before each trade.
“If price hits this zone and does X, I enter. If not, I don’t.”
🧠 Rehearse mentally.
Visualize the actual mouse click. Imagine price entering your zone and you acting decisively.
👁 Review only one thing each day:
Did I trust the zone and act — or did I hesitate again?
Execution is a skill. It gets sharper the more you drill it — before the trade is live.
💬 Final Thoughts
You already know the zones.
You already understand structure.
You just need more courage.
🎯 Learn to enter with intention.
🧠 Learn to trust the plan you built.
And start becoming the trader you keep pretending you already are.
If this lesson helped you today and brought you more clarity:
Drop a 🚀 and follow us✅ for more published ideas.
As predicted, gold continued to fall to the support zoneWorld gold price today
World gold price today increased slightly, with the spot gold price listed on Kitco around 3,317.85 USD/ounce, up 6.18 USD/ounce compared to early this morning. The last traded gold futures price was 3,338.2 USD/ounce, down 8.4 USD/ounce compared to early this morning.
World gold price experienced a volatile week when it continuously fluctuated within the range of 3,300 to 3,400 USD/ounce. But after all the fierce fluctuations, this precious metal returned to near the starting point at the end of the week, reflecting the indecision and waiting mentality of investors before the economic and geopolitical signals that have not yet been resolved.
Pay attention to the points I noted on the analysis.
Best regards, StarrOne !!!

I am waiting for SELL here with wave 5 catching strategy In the Kitco survey, Wall Street analysts were divided on the direction of gold prices this week. Fifty percent of experts expect prices to rise, 43 percent expect prices to fall, and 7 percent believe gold will move sideways. This reflects a generally cautious sentiment as there is no clear factor to promote a new trend.
Some experts still lean towards the uptrend as gold holds important support levels and remains a safe haven amid geopolitical uncertainty. Others predict a correction in gold prices due to positive signals from the White House about the possibility of reaching trade agreements and the recovery of US stocks.
In addition, there are also neutral opinions that gold is unlikely to continue to rise sharply without further momentum, especially when stock indexes are more attractive to investors.
James Stanley, senior strategist at Forex.com, remains optimistic, saying that gold is making a technical correction to continue the larger trend. He believes that the $3,300 and $3,280 zones will be important boundaries to watch.
What do you think about this strategy?
Best regards, StarrOne !!!

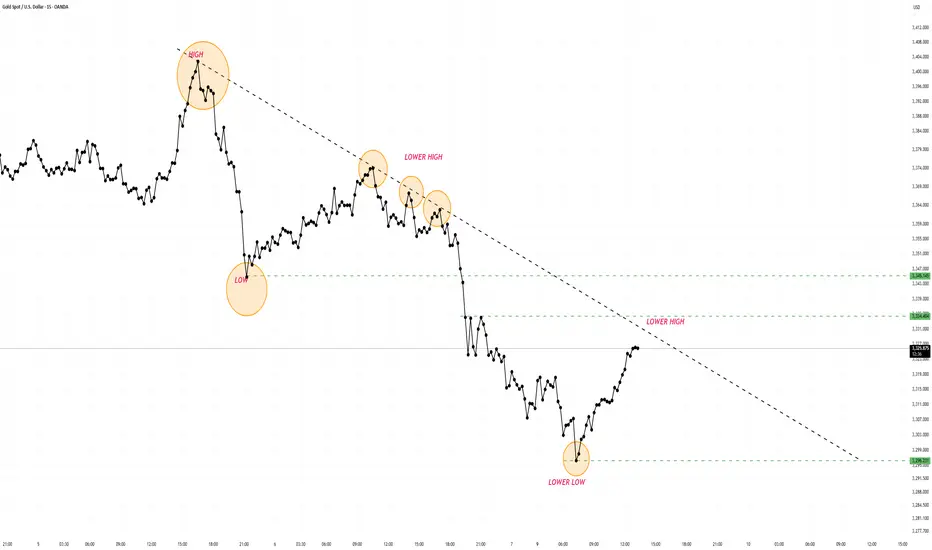
HIGHER HIGHS LOWER LOWSMarket structure is making lower highs and lower lows, indicating a short fall if hitting the trending line and also confirming breakout and retest. Keep a watch.
GOLD (XAU/USD) Daily Chart Analysis – Potential Bearish Impulse In this chart, I’ve mapped a potential Elliott Wave structure, currently unfolding within a corrective descending channel. Price action appears to have completed waves (1) through (4), with wave (5) in progress or imminent. If the structure holds, we may expect further downside pressure in the coming weeks.
Key insights:
Wave (4) has tested the upper boundary of the channel and failed to break out, suggesting a continuation of the bearish trend.
The projected path for wave (5) is marked, indicating potential downside targets.
Fair Value Gaps (FVG) along the chart align with prior liquidity zones and may serve as magnet levels for price retracement.
Support Zones: I’ve highlighted two key support levels between $2,700 – $2,600 and $2,450 – $2,350, where buyers may step in if price reaches those levels.
RSI currently shows weakening momentum near the midline, suggesting no immediate bullish divergence to reverse the trend.
While the overall long-term trend remains bullish, this chart suggests a short- to medium-term correction is unfolding, offering potential opportunities for swing shorts or re-entries at lower support zones.

The decline is not complete, beware of the low point.Last Friday, the US dollar index rose and recovered the 99 mark as the non-farm data exceeded expectations and weakened the Fed's hope of cutting interest rates this year. Spot gold continued to fall after the release of non-farm data, breaking through the 3345 and 3330 levels.
Market analysis:
First look at the 4-hour chart of gold:
It broke through the 3300 mark in the early Asian session on Monday and is currently maintained near 3310. However, from the current point of view, the decline of gold has not been completed. From the trend point of view, gold must at least test the position near 3280 and 3250 before there will be a relative chance of rebound. Once it falls below 3250, gold may not have a chance to rebound, and it will officially enter a bearish trend, and it will be greeted by a bearish trend at the daily level.
From the hourly chart, if it cannot stabilize above 3310, then gold is likely to fall, and see whether it will break through 3280 or 3250. On the contrary, if it stabilizes above 3310, it may hit the early high near 3320 again. However, as long as it cannot stabilize above 3325, gold will still fall. Now you should pay attention to where to short gold.
Operation strategy:
If the price cannot stabilize above 3310, you can short near 3310.
If it stabilizes above 3310, you can wait for short near 3320.
Can Gold Reach $3400 This Week?📊 Market Overview:
On June 4, 2025, gold prices (XAU/USD) hovered around $3,370/oz after rebounding from the $3,333 level. However, selling pressure emerged as prices approached the strong resistance zone near $3,392–$3,400. Ongoing uncertainties regarding U.S.–China trade policies and expectations of a Federal Reserve rate cut continue to support safe-haven demand for gold.
📉 Technical Analysis:
• Key Resistance: $3,392 – $3,400
• Nearest Support: $3,333 – $3,320
• EMA 09: Price is currently above the 09 EMA, indicating a short-term uptrend.
• Candlestick Patterns / Volume / Momentum: The RSI on the H1 timeframe is at 59, suggesting bullish momentum remains but is approaching overbought territory.
📌 Outlook:
Gold may experience a short-term pullback if it fails to break above the $3,400 resistance level and profit-taking intensifies.
💡 Suggested Trading Strategy:
SELL XAU/USD at: $3,392 – $3,400
o 🎯 TP: $3,372
o ❌ SL: $3,410
BUY XAU/USD at: $3,320 – $3,333
o 🎯 TP: $3,352
o ❌ SL: $3,310

H4 swing order analysis for traders, Trade Swing H4 GoldH4 swing order analysis for traders, pay attention to wave 5 to confirm Long-term Sell
James Stanley, senior strategist at Forex.com, said: "I remain bullish on gold and will look for new support for the broader trend to continue.
Gold has made a new short-term high, with the price rising above $3,350/oz. Therefore, I do not rule out the possibility of this uptrend continuing and will look for new support, especially at $3,300/oz and $3,280/oz," he said.
Rich Checkan, Chairman and CEO of Asset Strategies International, said: "The current momentum favors gold and silver. While there may be some profit-taking, I expect gold to continue to rise next week thanks to the weakness of the US dollar, political tensions in the Middle East and Ukraine, the impact of tariffs and the passage of a major bill in the US that will increase public debt, leading to consumer inflation. These factors will continue to drive demand for gold as a safe-haven asset."
Adrian Day, Chairman of Adrian Day Asset Management, shared: "There are signs that North American investors are increasing their purchases of gold, although not a strong wave, but I believe this trend is gradually changing. This is a positive signal for the gold market in the future."
Best Regards StarrOne !!!

How will gold perform in the future?Market news:
In the early Asian session on Monday (June 9), spot gold opened high and fell, currently trading around $3,305/ounce. The large-scale riots in Los Angeles, the United States, attracted some safe-haven buying to support the London gold price. The stronger-than-expected US employment report hit the Federal Reserve's hopes of cutting interest rates this year, and silver once surged to its highest level since 2012. Data from the US Department of Labor showed that employers added 139,000 jobs in May, less than 147,000 in April, but more than the 130,000 increase predicted by a survey of economists. After the data was released, the financial market bet that the Federal Reserve would not cut interest rates until September, and the probability of a rate cut in September dropped from 88% to 60%. There will be two rate cuts in 2025, reducing bets on a possible third rate cut.In the next week, the market will usher in major trade negotiations and heavyweight US CPI data, which investors need to pay close attention to. In addition, US federal law enforcement officers continued to search for illegal immigrants in many places in Los Angeles County on the 7th, and had serious conflicts with local community residents for the second consecutive day. Investors also need to pay attention to the impact of market sentiment.
Technical Review:
Technically, gold plunged sharply after midnight on Friday, and the weekly line closed with a long upper shadow line and a small positive. The 3400 mark encountered resistance and fell sharply and fell into another adjustment cycle. The daily line closed with a continuous negative structure, and the New York closing price once again lost the MA10-day moving average of 3330. The price returned to the middle track of the Bollinger band at 3310, and the RSI indicator's central axis 50 value flattened! The short-term four-hour chart MA10/7-day moving average opened downward, the RSI indicator's central axis 50 value ran below, and the Bollinger band opened downward and the price ran along the middle and lower tracks. At the beginning of the week, trading focused on the rebound strength after the oversold. The main idea was to sell at a high price on the rebound, and to buy at a low price as an auxiliary.
Today's analysis:
At the daily level, the price of gold has maintained a volatile pattern in recent times. The Bollinger band opening narrowed, indicating that the buying and selling forces were stalemate. MACD fast and slow lines are above the zero axis, the spacing is narrowing and there is a golden cross trend, the red kinetic energy column is beginning to appear, the buying power is slowly gathering, the RSI indicator is around 55, and the buying and selling game is fierce! From the hourly line, the Bollinger Bands open downward, and selling is temporarily dominant.MACD dead cross operation, the green kinetic energy column continues to increase, the 5-day moving average crosses the 10-day moving average, and the short-term downward trend is obvious. However, the current support near 3300 is strong, and it rebounded after multiple dips. In the future, we need to pay attention to the breakthrough of key positions to grasp the trading opportunity.
Operation ideas:
Short-term gold 3283-3286 buy, stop loss 3275, target 3310-3330;
Short-term gold 3330-3333 sell, stop loss 3342, target 3290-3270;
Key points:
First support level: 3293, second support level: 3271, third support level: 3253
First resistance level: 3330, second resistance level: 3356, third resistance level: 3378

XAU/USD(20250609) Today's AnalysisMarket news:
Fed Harker: Amid uncertainty, the Fed may still cut interest rates later this year. Musallem: There is a 50% chance that the trade war will lead to a sustained inflation outbreak. Tariffs may push up inflation within one or two quarters. The ECB cut three key interest rates by 25 basis points. Lagarde hinted that the rate cut cycle will end, and the market is no longer fully pricing in another 25 basis point rate cut this year.
Technical analysis:
Today's buying and selling boundaries:
3330
Support and resistance levels:
3398
3373
3356
3304
3288
3262
Trading strategy:
If the price breaks through 3330, consider buying in, with the first target price of 3356
If the price breaks through 3304, consider selling in, with the first target price of 3288

XAUUSD Bullish Move Next WeekHey traders
I can see XAUUSD in Bullish side in 1d time frame
wait for market
Always wait for confirmation/strong setup for open a trade.
Thank you and Good Luck!
Happy trading.

In the new week, is gold brewing a new market?Information summary:
This week, the market continued to be affected by Trump's tariff policy and the progress of negotiations. On Thursday, the phone call between the Chinese and US heads of state boosted market sentiment. In the early stage, the precious metals market ushered in a collective rise, and the prices of silver and gold performed strongly. Silver rose to a 13-year high on Thursday, breaking through $36 for the first time since February 2012.
After gold hit the $3,400 mark during trading on Thursday, the US dollar rose as friendly talks between China and the United States stimulated the rise of the US dollar; gold fell rapidly and gave up all the gains during the day. On Friday, the US stock market closed at its highest level since February due to the boost of non-agricultural data.
Gold continued its retreat trend again, closing at around 3,310 as of Friday.
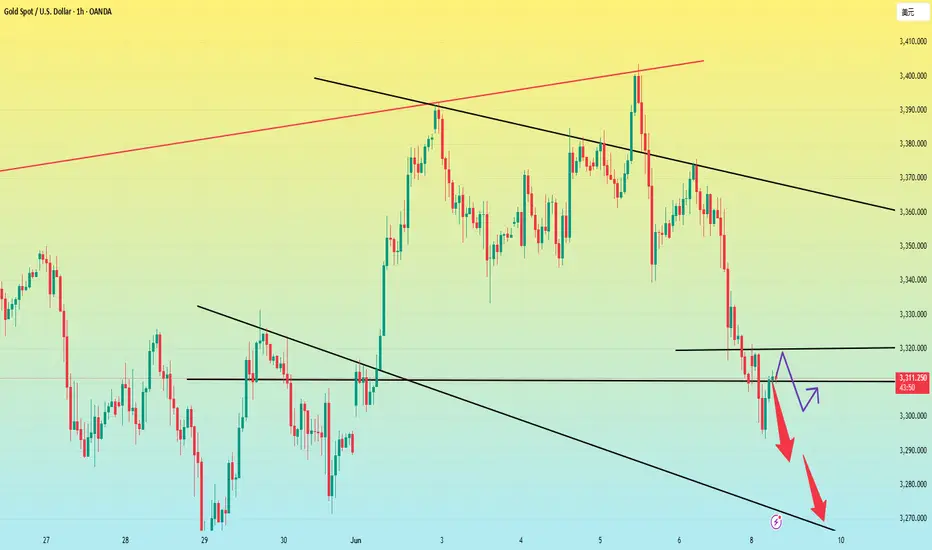
Market analysis:
From the trend of the US dollar, there is already an opportunity to bottom out, and the trend at the beginning of the week is critical.
Once the US dollar stands above 99.5 at the beginning of the week, it will continue to touch the 100.0--100.2 mark.
If it stabilizes above this position, gold will most likely fall below 3300 next week.
First, from the weekly chart:
The current moving average support below the weekly line is almost at 3250-3260. If it can hold here, gold may continue to maintain consolidation and wait for an opportunity to choose a new trend. However, if it falls below 3250, it can fall to the 3200 mark. If 3200 falls below again, it will be the low point of 3100.
It can also be seen from the daily chart that the important position of gold is at 3318-3280. If it stands above 3318, gold is in a bullish upward trend. If it falls below 3280, gold will enter a bearish trend. At present, gold has closed below 3318, so from the daily line, the next target is around 3280. If 3280 falls below again, then as the weekly analysis shows, it will test 3250-3260. However, judging from the daily chart, I think the market will not go down too easily.
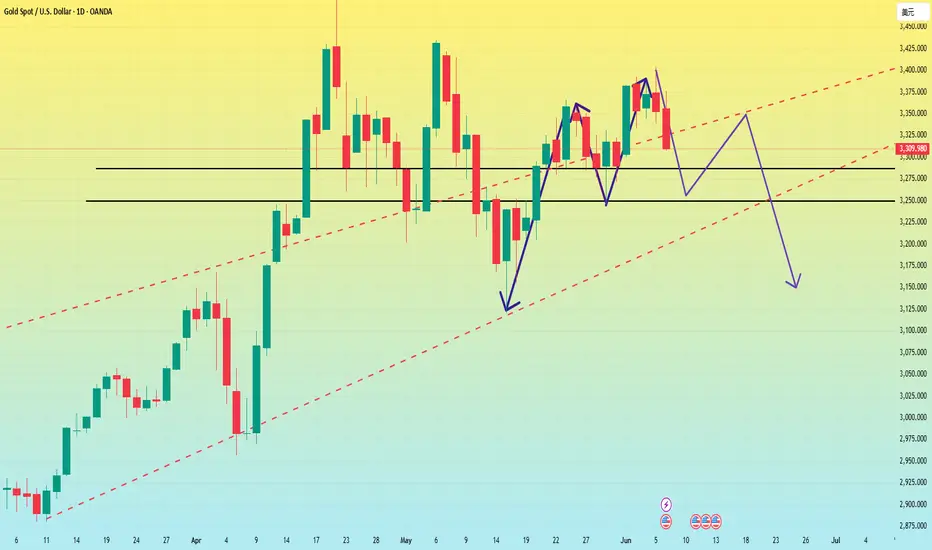
Therefore, I guess that gold may follow the head and shoulders top structure of the daily chart next week. It may fall to 3250-3260 at the beginning of the week to lure short sellers into the market, and then stretch and rebound to around 3350 to form a shoulder position. Finally, it will directly dive down to around 3150.
The Asian market is about to open, and I hope my analysis can help everyone make some profits in the market. A new week is about to begin, and I wish you all good luck.
Gold will still fall below 3,300 next week!
📣World Situation:
Gold prices fell for the second consecutive trading day on Friday, but are still expected to close with a gain of more than 1.30% as traders readjusted expectations for Fed policy easing after a stronger-than-expected US non-farm payrolls report. At the time of writing, XAU/USD was trading at $3,322, down 0.84% on a daily basis.
The US Bureau of Labor Statistics (BLS) reported that the labor market continued to show resilience, with the unemployment rate remaining stable from April. Meanwhile, Wall Street rebounded modestly from Thursday's losses despite increased political tensions between President Donald Trump and Tesla CEO Elon Musk after the House of Representatives approved a bill to raise the US debt ceiling.
Next Wednesday: ① Data: API crude oil inventory in the United States for the week ending June 6, US May unadjusted CPI annual rate, May seasonally adjusted CPI monthly rate, May seasonally adjusted core CPI monthly rate, May unadjusted core CPI annual rate, pay attention to real-time data changes.
Geopolitical risks and trade tensions have eased, and the call between Chinese and American leaders has released a signal of easing. Trump said that the trade negotiations have reached a "positive conclusion", weakening the attractiveness of gold as a safe-haven asset.
🔥 Technical side:
Based on the resistance and support levels of gold prices on the 4-hour chart, NOVA sorted out the important key areas as follows:
Resistance: $3347, $3400
Support: $3252, $3202

Analysis of gold price trend next week!Market news:
This week (June 2 to June 6), the spot gold market has become more volatile due to the interweaving of multiple factors. Spot gold prices fell more than 1% on Friday due to the impact of strong US employment data, but still recorded a 0.8% increase for the whole week, showing the game between safe-haven demand and the strengthening of the US dollar. The trade uncertainty caused by Trump's tariff policy, the continued increase in international gold holdings by global central banks, and the tense geopolitical situation provide support for London gold prices, while the solid US employment data pushed up US Treasury yields, weakened the Fed's expectations of rate cuts, and put pressure on international gold prices. The market continues to pay attention to geopolitical risks and trade uncertainties. Silver performed even better, hitting its highest level since 2012, and platinum and palladium also recorded weekly gains. The precious metals market as a whole was driven by speculative funds. The market's uncertainty about the Trump administration's steel and aluminum tariffs and fiscal policies has driven global central banks to increase their gold holdings. And the cautious attitude of Federal Reserve officials towards rate cuts is beneficial to long-term demand for gold. Next week, the US CPI data and the progress of trade negotiations will become the focus of the market. If inflationary pressure rises, it may further push up US bond yields and put pressure on gold prices; if the data is soft, it may rekindle expectations of interest rate cuts, which is good for gold. In addition, the progress of trade negotiations and geopolitical risks such as the conflict between Russia and Ukraine will continue to affect market sentiment.
Technical Review:
From the perspective of this week's market, the high-rise and fall-down trend continued, and the low point was refreshed. The signal that gold is heading towards an extremely weak pattern is getting stronger and stronger, and selling has the capital to pierce 3300. From a technical perspective, on the weekly chart, this week's high-rise and fall closed with an inverted head, and the MACD indicator showed signs of a dead cross downward at a high level. The current pattern is conducive to continued selling! On the daily chart, two consecutive negative lines on the daily chart caused the price to run below the short-term moving average, and led to a downward trend near the 10-day moving average of 3330. The 5-day moving average also followed closely at around 3355. In addition, the upward momentum of other periodic indicators weakened, and the MACD indicator showed a dead cross downward pattern, so the daily chart should tend to be short. However, one thing is worth noting, that is, after the gold price rebounded at 3307 on Friday, the middle track of the Bollinger Band has moved up, which means that the buying defense has been strengthened. Therefore, while the daily line is biased towards selling, we must also pay attention to the strength of the bulls' counterattack.
Next week's analysis:
Next week's operation suggestion is to maintain the idea of selling as the main idea, supplemented by buying at low prices. For the upper resistance, pay attention to the 3328-3330 area first, and then pay attention to the 3345-3350 area. The former is regarded as the key to selling and exploring the low point, or even breaking the middle track of the Bollinger Band at 3295, which is also the low point of this week. The latter is a strong defense for selling in the short-term shock trend! In other words, selling below 3330 can complete the touch of the low point or new low next week in the short term, while selling below 3350 is still expected to test the new low, but the time period will be extended. As for the support below, focus on 3280. It is expected that it will be close to or touched at the beginning of next week, but whether it can break directly needs to be judged according to the actual trend, so it is best to wait for it to touch or break once before taking more. The 1-hour moving average of gold has formed a dead cross downward, so gold still has downward momentum. After the 1-hour high box of gold oscillated, gold finally broke through the box downward, indicating that gold is better sold. Then the bottom of the gold box has now formed resistance, and the short-term 3333 line of gold has formed resistance to gold. If gold is under pressure at 3333 at the beginning of next week, then gold can continue to be sold.
Operation ideas:
Buy short-term gold at 3277-3280, stop loss at 3268, target at 3310-3330;
Sell short-term gold at 3330-3333, stop loss at 3342, target at 3300-3280;
Key points:
First support level: 3300, second support level: 3280, third support level: 3261
First resistance level: 3330, second resistance level: 3348, third resistance level: 3375

GOLDGOLD is getting ready to go the reaction level before giving us further upside.
Disclosure: We are part of Trade Nation's Influencer program and receive a monthly fee for using their TradingView charts in our analysis.

Gold May Undergo Short-Term Correction Near Resistance Levels📊 Market Overview:
As of June 6, 2025, gold prices have surged, trading around $3,373 per ounce, up $26.63 from the previous session . This increase is driven by weaker-than-expected U.S. job data, with initial jobless claims rising to 247,000, surpassing the forecast of 236,000 . This has heightened expectations that the Federal Reserve may consider cutting interest rates in the near future.
📉 Technical Analysis:
• Key Resistance Levels: $3,390 – $3,430
• Nearest Support Levels: $3,340 – $3,300
• EMA: Gold prices are currently above the 09 EMA, indicating a sustained upward trend.
• Candlestick Patterns / Volume / Momentum: The RSI on the 4-hour chart is at 58.27, suggesting that while bullish momentum persists, the market is approaching overbought territory .
📌 Outlook:
Gold may experience a short-term correction if U.S. employment data is strong, reducing expectations for Fed rate cuts. However, the long-term uptrend remains supported by safe-haven demand and central bank purchases.
💡 Suggested Trading Strategy:
SELL XAU/USD at: $3,430
o 🎯 TP: $3,400
o ❌ SL: $3,440
BUY XAU/USD at: $3,330
o 🎯 TP: $3,360
o ❌ SL: $3,220
