Gold Holds Above Key Support – Eyes Still on 3400 (READ CAPTION)By examining the gold chart on the 4-hour timeframe, we can see that the price successfully hit the $3367 target exactly as expected, and then corrected back to $3346. Currently, gold is trading around $3358, and if it can hold above $3350, we can expect further upside. Based on the previous analysis, the next bullish targets remain at $3367, $3380, $3391, and $3400. (Maximum support is always appreciated, my friends!)
Goldprice

US market fluctuates around 3400-3370, short first
📌 Driving events
Heightened tensions between China and the United States have also fueled the bullish momentum of gold prices. As the upcoming trade negotiations between Washington and Beijing are full of uncertainty, investors have sought safe-haven assets such as gold.
Adding to the market's nervousness, President Donald Trump signed an executive order to double the import tariffs on steel and aluminum from 25% to 50%, effective June 4. The move came a few days before Trump's much-anticipated call with Chinese President Xi Jinping, further fueling concerns about escalating trade frictions.
📊Commentary and analysis
Gold failed to fall back to 3353 during the day, and the lowest point was 3360, and it ushered in an increase, and the highest point was 3403. In the short term, 3403 was suppressed, or it may fall back, and then it fell into volatility again. The idea is to suppress short positions around 3403, stop loss at 3413, and stop profit at 3380-3372. Short-term trading, pay attention to risks.
June 5th US gold short-term trading: short near 3400, stop loss 3413, light position, take profit 3375
Short near 3372, stop loss 3360, take profit 3400
⭐️ Note: Labaron hopes that traders can properly manage their funds
- Choose the number of lots that matches your funds

XAU/USD(20250605) Today's AnalysisMarket news:
U.S. economic data-① ADP employment increased by 37,000 in May, far below the expected 110,000 and the previous value of 62,000. ② The U.S. ISM non-manufacturing index in May fell to 49.9, shrinking for the first time in nearly a year, and the expected increase was from 51.6 to 52.
Technical analysis:
Today's buying and selling boundaries:
3366
Support and resistance levels:
3407
3392
3382
3351
3341
3326
Trading strategy:
If the price breaks through 3382, consider buying in, and the first target price is 3392
If the price breaks through 3366, consider selling in, and the first target price is 3351

Can gold prices continue to rebound?Market news:
Spot gold rose slightly in early Asian trading on Thursday (June 5), currently trading around $3,382/oz. Supported by a weaker dollar and weaker U.S. data, investors are struggling to cope with growing economic and political uncertainty. Against the backdrop of rising risk aversion demand and weak economic data, gold prices rose slightly. At the same time, tensions between major powers, progress in EU-U.S. trade negotiations, and rising market expectations for a Fed rate cut have further ignited enthusiasm in the gold market, and the possibility of London gold prices rising above the 3,400 mark has increased.
The job market is sluggish, some industries are laying off employees, and wage growth is offset by the cost of living. Inflationary pressures continue, and companies plan to raise prices to pass on tariff costs. The Fed said the economic outlook is unclear and it will continue to monitor data to adjust its policies. As a safe-haven asset in times of political and economic uncertainty, gold tends to perform strongly in a low-interest rate environment.
Investors are closely watching the U.S. non-farm payrolls report to be released on Friday, June 6, for clues to the Fed's next move. In addition, we also need to pay attention to the ECB interest rate decision and the changes in the number of initial jobless claims in the United States on this trading day. The market expects the ECB to cut interest rates by 25 basis points. In the medium and long term, it tends to support the international gold price. In addition, continue to pay attention to the international trade situation and speeches by Fed officials.
Technical Review:
Gold successfully bottomed out yesterday, with the lowest point of the day at 3344, which is not much different from the point of 3345 that we disclosed in the morning. The market point is basically in place. The small non-agricultural positives in the evening helped the gold price to rise further. The high point of gold is gradually approaching the pressure level of 3392. In the short term, the gold price is expected to break through the pressure and continue the upward trend!
The technical side of gold maintains the bullish low-multiple thinking. The daily chart price extends the MA5/10/7-day moving average high point upward, and the RSI indicator is hooked upward above the middle axis. The short-term four-hour chart and hourly chart moving average open upward, the Bollinger band opens upward, and the price is running on the upper and middle track of the Bollinger band. The main idea is to buy at a low price and sell at a high price.
Today's analysis:
Recently, the market, tariff trade policies, and geopolitical tensions have been affecting the strength of the US dollar and gold. Although it seems that gold is fluctuating upward for the time being and has not gone out of the space for a unilateral surge, it can be seen from this week's slow rise that gold is still an absolute buying trend. Therefore, no matter how it adjusts, falls back, or fluctuates, it is an opportunity to buy into the warehouse.
How to plan for the future market? I believe everyone has a clear direction in mind. Buying is very strong, just go with the trend. The important thing is the point. The low point below is moving up, which means that if the gold price drops again, the low point will not fall below 3344. Yesterday, the gold Asian and European sessions were in a volatile adjustment trend. After the release of the US session data, the gold price rose from 3350 to the current price of 3385 and then fell back. In terms of short-term operations, since the high point of the Asian session broke, it is still recommended to buy at a low price and focus on bullish operations.
Operation ideas:
Short-term gold 3350-3360 buy, stop loss 3340, target 3380-3400;
Short-term gold 3397-3400 short, stop loss 3408, target 3360-3340;
Key points:
First support level: 3363, second support level: 3350, third support level: 3333
First resistance level: 3388, second resistance level: 3396, third resistance level: 341

Gold------Buy near 3360-3380, target 3390-3400Gold market analysis:
Recently, the daily gold trading has begun to be a game. Today's idea is to continue buying and looking for buying opportunities. At present, it is an obvious shock rise, not a direct one-sided one. Don't rush to enter the warehouse. Yesterday, the daily line closed positive, and the short-term 3392 was suppressed. The daily moving average began to diverge. There is not much time for high-level shocks. The shock is mainly because this week is a data week. The market has too many uncertainties about the future. For example, yesterday's ADP employment data is like this. There is a more heavy NFP later. I estimate that the shock market will continue before the non-agricultural data. Today, we focus on the opportunity of shock retracement and continue to buy.
The analysis chart shows that the hourly shock range is 3392-3342. Yesterday's daily closing raised the shock platform. Today, we focus on the support of two shock platforms. One is around 3363, which is an hourly shock, and the other is 3354. This position is the moving average and pattern support. These two supports in the Asian session are both buying opportunities. In addition, if it breaks 3392, it may stand on 3400 and start a new bullish pull.
Support 3363, 3354, strong support 3343, suppression 3385, strong pressure 3392, the market strength and weakness watershed 3363.
Fundamental analysis:
The US ADP employment data released this time showed a significant reduction in employment, supporting gold to suppress the US dollar, and also giving the US market a new expectation for non-agricultural.
Operation suggestion:
Gold------Buy near 3360-3380, target 3390-3400

Gold can make new ATH...(05JUNE2025)As Gold had 2 weeks rally in early April, now is consolidating below the 33360 resistance on weekly timeframe for 7 weeks. I believe this important resistance eventually get broken and we see new all time highs for Gold.

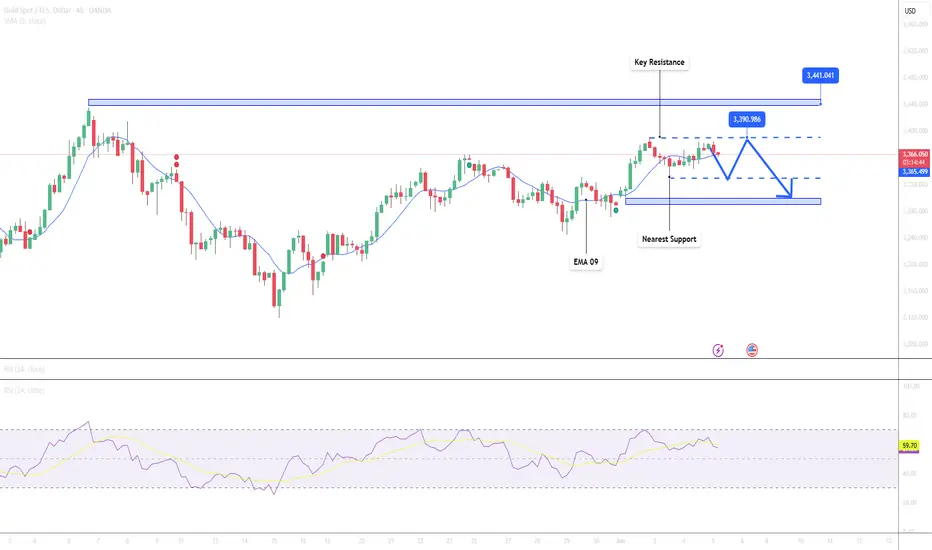
Gold Approaches Key Resistance – Minor Pullback Possible📊 Market Overview:
Gold prices continue their upward momentum and have now reached $3,367/oz, as markets await the upcoming U.S. Nonfarm Payrolls (NFP) report later this week. The U.S. dollar is slightly weaker and Treasury yields are stable, helping gold maintain its strength. However, mixed forecasts from major financial institutions are creating psychological pressure on investors.
📉 Technical Analysis:
• Key Resistance: $3,390 – $3,440
• Nearest Support: $3,330 – $3,300
• EMA: Price remains above both EMA 50 and EMA 9 → indicating a sustained uptrend.
• RSI (H4): Near 66 → not overbought yet, but limited room for further upside.
• Candle pattern: Recent H1 candles show long upper wicks → signaling profit-taking at higher levels.
📌 Outlook:
Gold may face a minor short-term correction if it fails to break above the $3,390 resistance area, especially as the upcoming U.S. jobs report could potentially strengthen the U.S. dollar.
💡 Suggested Trading Strategy:
SELL XAU/USD at: $3,375 – $3,390
🎯 TP: $3,355
❌ SL: $3,405
BUY XAU/USD at: $3,345 – $3,330
🎯 TP: $3,365
❌ SL: $3,315
XAU/USD) Breakout strong bullish trend Read The captionSMC Trading point update
Technical analysis chart of gold (XAUUSD) on the 4-hour timeframe. Here’s a breakdown of the key ideas presented in the chart:
---
Key Support/Resistance Zone
A yellow rectangular zone marks a significant support/resistance level.
This level was previously a resistance and has now been flipped into support ("new support level").
---
Trend Analysis
Uptrend line (lower diagonal line): Shows support and higher lows forming a bullish structure.
Downtrend lines (upper diagonals): Show past resistance levels being tested.
Strong downtrend line has now been broken, which is bullish.
---
Target Points
Three bullish targets are marked:
1. $3,436.70
2. $3,500.93
3. $3,647.33
These targets seem to be based on:
Breakout above the resistance zone.
Measured move projections from previous impulsive rallies.
---
Technical Indicators
200 EMA (Exponential Moving Average): Currently at $3,261.87, acting as dynamic support.
RSI (Relative Strength Index):
Current RSI is 54.80, indicating neutral momentum.
Previously touched overbought zone (~69), indicating strong recent bullish momentum.
---
Arrows
Green arrows mark strong bullish bounce points.
Red arrow marks a rejection from the downtrend line (previous resistance).
Mr SMC Trading point
---
Conclusion (Idea Summary)
Price has broken out of consolidation and downtrend resistance.
If the price holds above the yellow support zone and 200 EMA, a bullish continuation is likely.
Targets: $3,436 → $3,501 → $3,647.
Confirmation of breakout and momentum depends on volume and RSI behavior in coming candles.
---
pelas support boost 🚀 analysis follow)

Gold points to 3400, madness before data release.Market analysis:
Gold fell slightly to around 3361 in early trading on Wednesday. After falling to around 3346, it quickly rose to around 3372, then was blocked and fluctuated and fell. It fell to 3344 in the European session and then rebounded. It rose strongly to 3384 in the US session and fluctuated above 3370 in the late trading.
The daily line of gold showed a trend of alternating yin and yang. But the overall trend was upward. The 5-day moving average and the 10-day moving average formed a golden cross and extended upward, which provided moving average support for the gold price, allowing gold to maintain a strong and volatile trend. At present, the 5-day moving average is around 3352, and the 10-day moving average is around 3335. The first thing to pay attention to is the resistance of Tuesday's high of 3392. If the gold price can break through this resistance level, it is expected to continue the bullish trend.
In terms of points, first pay attention to the support near MA5/MAA10 below, and focus on the support of MA20 moving average. The downward exploration on Tuesday and Wednesday both defended the MA20 moving average position. Above this, it is treated as a strong shock. Secondly, pay attention to the support near 3335, which is the low point on Tuesday and the key to the short-term structure. Secondly, pay attention to the support near 3335, which is the low point on Tuesday and the key to the short-term structure. First pay attention to the resistance near 3395 above, and then pay attention to the resistance near 3415 and 3430, which are the previous high points.
Operation strategy:
Short near 3395, stop loss 3410, profit range 3380-3360
Long near 3360, stop loss 3350, profit range 3375-3380-3390-3400.

XAU/USD) Technical analysis Read The captionSMC trading point update
Technical analysis of Gold (XAUUSD) on the 1-hour timeframe. Here's a breakdown of the key ideas in the analysis:
---
Chart Elements:
Support Level (Yellow Zone at ~3,340–3,350):
This area has been highlighted as a key support zone where price has bounced previously.
Price is currently hovering just above this level.
Downtrend Line:
A descending trendline is drawn, indicating a short-term bearish trend.
A breakout above this line could trigger bullish momentum.
Two Scenarios Outlined:
Bullish Scenario:
If price breaks the downtrend and holds above support, it may rally towards the upper target point at 3,419.68.
Bearish Scenario:
If price breaks below the support, the next target point is marked lower around 3,300.62, a previous consolidation area and close to the 200 EMA (blue line).
200 EMA (~3,324.72):
Acts as dynamic support. If price moves below it, bearish sentiment may increase.
RSI (Relative Strength Index):
RSI is neutral (~50.54), not showing overbought or oversold signals, leaving room for movement in either direction.
---
Key Takeaways:
Neutral-Biased Setup: The price is consolidating between a clear support level and downtrend resistance.
Confirmation Needed: A breakout from either direction is necessary to confirm the next move.
Bullish Breakout: May lead to a retest of highs at 3,419.68.
Bearish Breakdown: Could push the price toward 3,300.62, aligned with past support and the 200 EMA.
Mr SMC Trading point
---
Trading Ideas (based on this analysis):
Long Entry: On breakout above the downtrend line + confirmation above 3,360.
Short Entry: On breakdown below 3,340 with strong volume.
Stop-Loss: Just outside the consolidation zone depending on trade direction.
Risk Management: Be cautious around economic news (calendar icons shown suggest upcoming events).
Please support boost this analysis )

Ascending triangle on gold: $3,280 or $3,560 next? Gold has climbed following softer-than-expected US economic data, which has strengthened speculation for at least two Federal Reserve rate cuts this year. ADP employment figures showed just 37K new jobs, well below the 111K forecast.
President Donald Trump, posting on Truth Social, called on “too slow” Fed Chair Jerome Powell to cut rates immediately.
The repeated tests of the $3,400 level suggest that selling pressure at this zone could be weakening. Lower interest rates tend to support gold prices, as the metal offers no yield. However, a daily close below the recent swing low of $3,280 would undermine the pattern.

XAUUSD BULLISH SETUP. GOLD GOES 'PREPARING FOR SUMMER'Gold spot prices have experienced significant volatility and notable technical developments over the past several months. Since the start of 2025, gold surged by over 25%, reaching an all-time high of $3,500 per troy ounce in April before retracing to hover near $3,300 by late May.
This rally was fueled by persistent geopolitical tensions, particularly in the Middle East, and a weaker US dollar, which made gold more attractive to international buyers.
Technically, gold entered a parabolic upswing earlier in the year, becoming extremely overbought before breaking below its parabolic trend, signaling a potential top and the start of a corrective phase.
The Relative Strength Index (RSI) has recently dropped below 52, its lowest since February, reflecting weakening bullish momentum. The Average Directional Index (ADX) near 15 also indicates a lack of strong trend direction.
Key support levels are identified at $3,196 (55-day SMA), $3,120 (May low), and $3,031 (100-day SMA), while resistance sits at $3,350.
We are looking forward to further Gold accumulation, ahead of scorching hot summer months.
--
Best wishes,
@PandorraResearch Team 😎

XAU/USD(20250604) Today's AnalysisMarket news:
Fed Logan: We should focus on achieving the 2% inflation target, rather than trying to make up for past inflation shortfalls; Bostic: We still think there may be a rate cut this year.
Technical analysis:
Today's buying and selling boundaries:
3359
Support and resistance levels
3417
3395
3381
3337
3322
3301
Trading strategy:
If the price breaks through 3359, consider buying, the first target price is 3381
If the price breaks through 3337, consider selling, the first target price is 3322

Gold should beware of unexpected employment data explosion!Market New s
On Wednesday (June 4) in the Asian market, spot gold fluctuated slightly and is currently trading around $3,346 per ounce. The international gold price fell 0.83% on Tuesday, after hitting a high of $3,392 since May 8. The price decline was mainly suppressed by the rebound of the US dollar exchange rate. At the same time, the tense international trade situation, the weakness of the US labor market and the cautious attitude of the Federal Reserve have cast a fog of uncertainty over the gold market.However, the market remains vigilant about the global situation. The continued expansion of the US fiscal deficit, the escalation of trade tensions between Asian powers and the United States, and the failure of the second round of peace talks between Ukraine and Russia have led to market risk aversion still supporting London gold prices. The Fed's wait-and-see attitude and cautious assessment of inflation expectations have further increased market uncertainty. Pay close attention to Friday's non-farm payrolls data and the Fed's policy guidance to determine the next wave of gold price movements. In addition, this trading day pays attention to the US ADP employment data in May and the US ISM non-manufacturing PMI data in May, as well as news related to the international trade situation. News related to the geopolitical situation also needs to be paid attention to.
Technical Review
Gold rose strongly overnight because Ukraine directly blew up 41 Russian fighter jets. Today, the expected rhythm was completed and the bottom rebounded. In the four-hour chart, the hourly chart price still maintains the upper track of the Bollinger Band channel, and the daily chart MA10-day moving average 3326 and the 5-day moving average 3340 are running above. In the wide range of market fluctuations, short-term participation is the main. Intraday callbacks are still mainly low-price buying. In terms of the moving average system, the short-term moving average diverges upward, providing certain support for the price, but the deviation rate from the long-term moving average has a trend of shrinking, so beware of price corrections. At the 4-hour level, the 5-day moving average crosses the 10-day moving average to run. If the hourly price can effectively break through the upper edge of the recent fluctuation range of 3400, it is expected to usher in a wave of rising prices in the short term; on the contrary, if it falls below the lower edge of 3300, it may further explore.
Today’s analysis
Gold rebounded in the Asian session and then rushed up directly, and the center of gravity of the rebound low point is also constantly moving up. At present, from the one-hour market, the short-term gold price has stabilized above the top and bottom conversion position of 3340, and it also remains above the upward trend line. Buying is strong. For the future trend, we still have a buying mindset!
Gold price rebounded to the lowest level of 3346 in the Asian session, and the buying energy is relatively strong, but I still suggest that you don’t chase orders. There is no good thing in the Asian session. Chasing the rise is easy to be trapped at a high point. We only need to pay attention to two points in the Asian session, which are the key position of 3330 and the short-term support level of 3346. If there is a rebound to 3350 during the session, start ambush buying!
Operation ideas:
Short-term gold 3350-3360 long, stop loss 3330, target 3370-3400;
Short-term gold 3370-3380 short, stop loss 3350, target 3340-3320;
Key points:
First support level: 3338, second support level: 3326, third support level: 3303
First resistance level: 3370, second resistance level: 3386, third resistance level: 3396

XAUUSD:Go long
Gold in yesterday bottom pick up, back to hit a low after pumping, and then stabilize and pull up, the daily line is a single negative back to step, corrected gold continues to be bullish, short - term back to step support to see 3355-3360
Trading Strategy:
BUY@3355-60
TP:3375-80
↓↓↓ More detailed strategies and trading will be notified here ↗↗↗
↓↓↓ Keep updated, come to "get" ↗↗↗

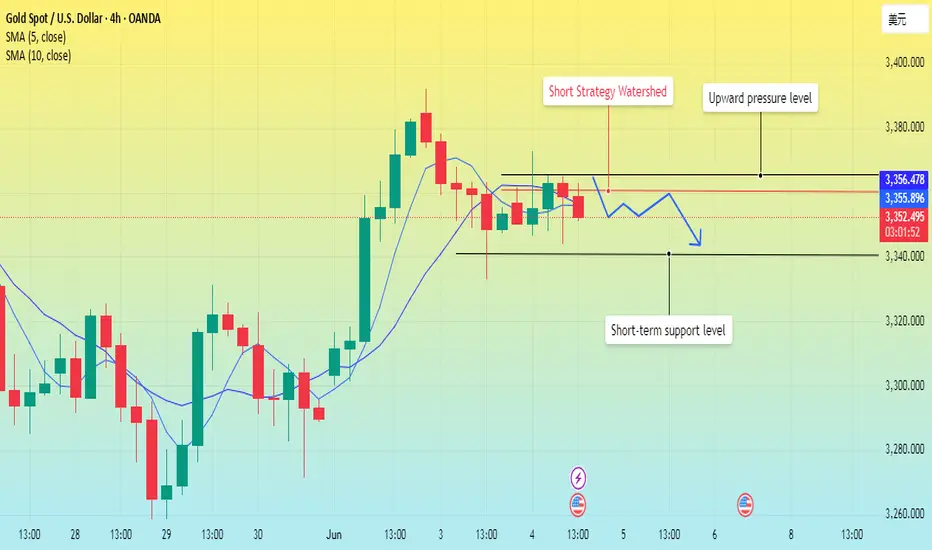
Gold fluctuates. It is expected to retreat.Gold continued its strong performance on Monday in the early trading yesterday and reached a high of around 3391 before starting to fall all the way. It was weak and downward in the European trading. The US trading quickly fell back to around 3335 and then rose again. However, it touched the 3372 line again in the morning and continued to fall, forming a large range of fluctuations.
Affected by the ADP data, although the positive impact is large, it is very likely to be just an illusion given to the market, not to achieve a strong effect. The key pressure position above is maintained at around 3360, which may play the role of a watershed between long and short positions, and the strong pressure above will also be maintained at 3365; the support position below is around 3340. Once this position is broken, the room for decline may be expanded in the later period.
Although the MA5-day and 10-day moving averages have the intention of forming a golden cross, they have not completely released the energy of the bulls, making the market more unpredictable for the bears. In the correction of the bulls' strong upward movement, there was no further effort. Perhaps this is one of the signs of bull exhaustion. The current channel position formed from 3391 also gives the bulls enough pressure. Only by breaking through this position again can a strong upward trend be achieved.
Operation strategy:
Short near 3360, stop loss 3370, profit range 3345-3330.
Gold fluctuates, with downward support at 3325
📌 Driving events
The number of ADP jobs in the United States in May was 37,000, expected to be 110,000, and the previous value was 62,000.
📊Comment analysis
Views on the trend of gold in the US market!
After a day of swinging, gold is still fluctuating between 3372 and 3340. After opening high and closing low on Monday, gold has been fluctuating for two days. The ADP data will be released tonight. Whether it can break the trend of the volatile market tonight depends on the release of the ADP data. If it is still the case, we can only wait for the big non-agricultural data on Friday. In the face of this volatile trend, Labaron still recommends maintaining the previous operation strategy.
The support below is 3330-25. If it breaks down, we will talk about it. If it still remains above this level, we will still operate with the oscillating trend. After all, in the face of the current trend of neither long nor short continuity, a single direction will only make you lose all your profits. For the current decline, we should first look at the support of 3330-25!
⭐️ Note: Labaron hopes that traders can properly manage their funds
- Choose the number of lots that matches your funds

AJA'S Gold view... Daily Timeframe Analysis.Gold has been on a correction spree now, with short term buys.
On the monthly timeframe, Gold is completely OVERSOLD.
From my analysis on the daily timeframe, the bear power is more, we'll keep selling to our poi, which is our order block at 3025-2975.
Gold needs to make a huge correction by coming down past the inducement point at 3122 before hitting the order block at that BOS.
Then we'll see if the bearish market will continue, or the bull will take power.
What do you think about this analysis?

Gold awaits data storm
The international gold market is playing out a wonderful duel between long and short forces. The following data will guide gold to continue to start a new direction, so what should we do?
💡Message Strategy
Employment data: complex signals of long and short interweaving
The latest US JOLTS employment data for April presents a strange picture of "ice and fire". On the one hand, the number of job vacancies unexpectedly increased by 191,000, far exceeding market expectations. This eye-catching data was called "surprisingly strong performance" by Joseph Capurso, an analyst at the Commonwealth Bank of Australia. But on the other hand, the number of layoffs surged by 196,000, the largest increase in nearly nine months, exposing the potential fragility of the labor market.
Trade Cloud: Continuing Fermentation of Geopolitical Risks
The current global trade situation is like a sword of Damocles hanging over the market. The White House has signaled that President Trump may hold key talks with the leaders of major Asian countries this week, and this news brings a glimmer of hope to the market.
Policy fog: The Fed's cautious dance
Market participants are focusing on the key data that will be released one after another. Before the release of the non-farm payrolls report on Friday, the ADP private employment data on Wednesday night will become an important indicator. Analysts generally believe that these data will provide more clues for judging the direction of the Fed's policy, which will in turn affect the investment logic of the gold market.
📊Technical aspects
Monday's pull-up seemed to be the start of a new round of bulls, but yesterday there was a sharp retracement again. If we look at it from a unilateral rise, the retracement has been too large, and it has obviously destroyed the rising pattern. If we count the rising point from the low point of 3260 last Thursday to the high point of 3390 in the morning yesterday, the increase has reached more than 140 US dollars, and it is still within the range of weekly and monthly levels. This is why it is not recommended to chase the rise directly.
At present, gold cannot form a continuous rise, so 3390 is likely to be the high point of this round of highs, and it will start to fall again, still with weekly level range fluctuations and high-level adjustments.
The US dollar stabilized and rebounded. It continued to rebound yesterday. After testing the support near 90 in the morning today, it rose again. In addition, under the expectation that the Federal Reserve will not cut interest rates in June, the US dollar is likely to continue to fall in June, which will create time for gold to adjust. Therefore, gold does not have the conditions for a breakthrough in the short term. Once the US dollar accelerates its rebound, gold still has the possibility of another sharp drop.
💰 Strategy Package
Short Position:3365-3370,3375-3380

| Gold | And Gold Alone : Buy The Best | Accept No Substitute | | Gold | And Gold Alone : Buy The Best | Accept No Substitution |
Gold
Accept No Substitute.
Never fall into the "Catch-Up Game Trap."
Silver is presently such a Trap.
Gold will continue to Outperform Silver
Don't let a Dealer convince you otherwise
Buy Strength, Sell Weakness
Buy The Best, Winner takes all
Gold / > United States Dollar
Gold / > US Dollar Index
Gold / > Swiss Franc
Gold / > Great British Pound
Gold / > Euro
Gold / > Japanese Yen
Gold / > Bitcoin
Gold / > Silver
Bitcoin / < Gold
Bitcoin Total Market Cap / < Gold
Silver / < Gold
Pro Tip : Rarely a good bet, if your Broker is paying carry for you to hold it.
It's in the Detail
🌟

XAU/USD 04 June 2025 Intraday AnalysisH4 Analysis:
-> Swing: Bullish.
-> Internal: Bullish.
Analysis and bias remains the same as analysis dated 23 April 2025
Price has now printed a bearish CHoCH according to my analysis yesterday.
Price is now trading within an established internal range.
Intraday Expectation:
Price to trade down to either discount of internal 50% EQ, or H4 demand zone before targeting weak internal high priced at 3,500.200.
Note:
The Federal Reserve’s sustained dovish stance, coupled with ongoing geopolitical uncertainties, is likely to prolong heightened volatility in the gold market. Given this elevated risk environment, traders should exercise caution and recalibrate risk management strategies to navigate potential price fluctuations effectively.
Additionally, gold pricing remains sensitive to broader macroeconomic developments, including policy decisions under President Trump. Shifts in geopolitical strategy and economic directives could further amplify uncertainty, contributing to market repricing dynamics.
H4 Chart:
M15 Analysis:
-> Swing: Bullish.
-> Internal: Bearish.
Analysis and bias remains the same as analysis dated 22 May 2025.
In my analysis from 12 May 2025, I noted that price had yet to target the weak internal high, including on the H4 timeframe. This aligns with the ongoing corrective bearish pullback across higher timeframes, so a bearish internal Break of Structure (iBOS) was a likely outcome.
As anticipated, price targeted strong internal low, confirming a bearish iBOS.
Price has remained within the internal range for an extended period and has yet to target the weak internal low. A contributing factor could be the bullish nature of the H4 timeframe's internal range, which has reacted from a discounted level at 50% of the internal equilibrium (EQ).
Intraday Expectation:
Technically price to continue bullish, react at either premium of internal 50% EQ or M15 demand zone before targeting weak internal low priced at 3,120.765.
Alternative scenario:
Price can be seen to be reacting at discount of 50% EQ on H4 timeframe, therefore, it is a viable alternative that price could potentially print a bullish iBOS on M15 timeframe.
Note:
Gold remains highly volatile amid the Federal Reserve's continued dovish stance and persistent geopolitical uncertainties. Traders should implement robust risk management strategies and remain vigilant, as price swings may become more pronounced in this elevated volatility environment.
Additionally, President Trump’s recent tariff announcements are expected to further amplify market turbulence, potentially triggering sharp price fluctuations and whipsaws.
M15 Chart:

Gold Continues to Rise as USD Weakens📊 Market Overview:
Gold prices are rebounding slightly after a pullback from a four-week high. The weakening USD, driven by concerns over US-China trade tensions and upcoming employment data, has bolstered safe-haven demand for gold.
📉 Technical Analysis:
• Key Resistance: $3,365 – $3,377
• Nearest Support: $3,320 – $3,290
• EMA 09: Price is above the 09 EMA, indicating a short-term uptrend.
• RSI: The RSI on the H4 timeframe is at 64.06, suggesting bullish momentum with room before reaching overbought territory
📌 Outlook:
Gold may continue its short-term rise if the USD remains weak and US employment data falls short of expectations.
💡 Suggested Trading Strategy:
SELL XAU/USD at: $3,377
o 🎯 TP: $3,357
o ❌ SL: $3,387
BUY XAU/USD at: $3,290
o 🎯 TP: $3,310
o ❌ SL: $3,280

Asian session main long and auxiliary short operation
📣Gold information
There are two main reasons for the rise in international gold prices: First, global trade frictions have intensified. Trump said that he would raise tariffs on steel and aluminum. The EU strongly opposed it and prepared to implement countermeasures. Brazil is also ready to counter, and the market is worried that the United States will resume the "big stick" of tariff policy; second, in terms of geopolitical conflicts, the market is worried that the conflict between Russia and Ukraine will escalate again. Overall, the medium- and long-term rise in gold has not changed, and there is still uncertainty as to whether it can successfully break through the resistance level in the short term.
📊Comment analysis
Today, we need to pay attention to the support effect of the moving average. The current 5-day moving average is near 3340, and the 10-day moving average is near 3325. These two positions constitute important support areas for the short-term correction of gold prices. In terms of upper resistance, pay attention to yesterday's high of 3392. If the gold price can break through this resistance level upward, it means that the upward momentum is strong, and it is expected to continue the strong trend and further open up the upward space.
In terms of points, pay attention to the support near yesterday's low of 3333 below, and the resistance near 3360 and 3370 above.
💰Strategy Package
🔥Sell Gold Zone: 3365-3370 SL 3375
TP1: $3355
TP2: $3340
TP3: $3325
🔥Buy Gold Zone: $3325-$3330 SL $3320
TP1: $3345
TP2: $3355
TP3: $3365
⭐️ Note: Labaron hopes that traders can properly manage their funds
- Choose the number of lots that matches your funds
