XAUUSD quick BUY tradeHi fellow traders, XAUUSD will be ready to make a move higher from the blue box after completing the correction. Target the 3334.67 level. Good luck and trade safe!
Goldprice

Gold fluctuates and is bearish, waiting for NF
📌 Policy factors
Gold prices (XAU/USD) continued to fall, falling to $3,310 in the current European session on Wednesday, as signs of improved global risk sentiment and easing trade tensions curbed demand for safe-haven assets. Market participants remained cautious ahead of the release of major US economic data, including ADP employment changes, core PCE price index and first quarter GDP preliminary values, all of which are scheduled to be released later today.
It is reported that President Trump suddenly signed an executive order to provide automakers with up to 15% tariff rebates to ease the impact of his auto tariff policy. Even more unexpectedly, US Commerce Secretary Lutnick revealed that a trade agreement had been reached secretly with a certain country. These major changes immediately triggered a strong market reaction.
📊Comment Analysis
Gold price maintains the accumulation range of 3265-3360, temporarily stable and waiting for large fluctuations
💰Strategy Package
🔥Sell gold area: 3368-3370 SL 3375
TP1: $3350
TP2: $3340
TP3: $3330
🔥Buy gold area: $3264-$3262 SL $3257
TP1: $3280
TP2: $3300
TP3: $3318
🔥Buy gold area: $3285-$3283 SL $3280 scalping
TP1: $3290
TP2: $3295
TP3: $3300
⭐️ Note: Labaron hopes that traders can properly manage their funds
- Choose the number of lots that matches your funds
- Profit is 4-7% of the capital account
- Stop loss is 1-3% of the capital account

XAU/USD 30 April 2025 Intraday AnalysisH4 Analysis:
-> Swing: Bullish.
-> Internal: Bullish.
Analysis and bias remains the same as analysis dated 23 April 2025
Price has now printed a bearish CHoCH according to my analysis yesterday.
Price is now trading within an established internal range.
Intraday Expectation:
Price to trade down to either discount of internal 50% EQ, or H4 demand zone before targeting weak internal high priced at 3,500.200.
Note:
With the Federal Reserve's dovish stance and persisting geopolitical uncertainties, heightened volatility in Gold is expected to continue. Traders should proceed with caution and adjust risk management strategies in this high-volatility environment.
Price could also be driven by President Trump's policies, geopolitical moves and economic decisions which are sparking uncertainty.
H4 Chart:
M15 Analysis:
-> Swing: Bullish.
-> Internal: Bearish.
Analysis and Bias remains the same as analysis dated 24 April 2025.
Price printed as per my note yesterday whereby I mentioned that we should be surprised if price printed a bearish iBOS as all HTF's require a pullback.
Price subsequently printed a bearish iBOS which confirms internal structure.
Intraday Expectation:
Price has traded up to just short of premium of internal 50% EQ where we are seeing a reaction. Price could potentially trade further into premium of 50%, or H4/M15 nested supply zone before targeting weak internal low priced at 3,260.190.
Note:
With the Federal Reserve maintaining a dovish stance and ongoing geopolitical tensions, volatility in Gold prices is expected to remain elevated. Traders should exercise caution, adjust risk management strategies, and stay prepared for potential price whipsaws in this high-volatility environment.
Trump's tariff announcement will most likely cause considerably increased volatility and whipsaws.
M15 Chart:

Gold Ideas - April 29th, after NEWS - Jolts Job Openings🔥 GoldMindsFX – Intraday Trade Plan (April 29 PM NY)
US JOLTS missed (7.19M vs 7.48M).
Mixed narrative with CB Consumer Confidence = high probability of NY whipsaws, liquidity games, and no clean trend.
PA still trapped in a Monday Range prison between 3280–3350. Boss fight still pending.
🟥 SELL ZONES
Sell Zone 1: 3317–3330
🔸 Previous NY reaction high + last upside liquidity sweep
🔸 Confluences: EQ retest, M15 FVG, weak internal BOS
📍 Entry only on LTF bearish rejection
🔻 SL: Above 3332
🎯 TP1: 3306
🎯 TP2: 3288
🎯 TP3: 3265
⚠️ Risk: If 3330 breaks impulsively, step aside
Sell Zone 2: 3350–3360
🔸 Major HTF rejection zone
🔸 Psychological sell trigger
📍 Entry after M15/M5 confirmation (CHoCH + engulfing preferred)
🔻 SL: Above 3363
🎯 TP1: 3317
🎯 TP2: 3288
🎯 TP3: 3260
✅ Confidence: Very high — but price may not reach it today
🟩 BUY ZONES
Buy Zone 1: 3280–3288
🔸 Protected Asia/NY lows
🔸 Previous demand sweep zone + micro bullish CHoCH
🔸 Strong bounce history
📍 Look for M5/MS flip + OB/FVG combo
🛡️ SL: Below 3275
🎯 TP1: 3306
🎯 TP2: 3317
🎯 TP3: 3330
⚠️ Risk: Rejection from 3306 must be watched for trap spike
Buy Zone 2: 3260–3265
🔸 Deep liquidity grab zone
🔸 Untapped OB + M15 imbalance
🔸 Full sweep of Asia and NY structural lows
📍 Enter on M1–M5 confirmation (mini CHoCH + FVG)
🛡️ SL: Below 3254
🎯 TP1: 3288
🎯 TP2: 3306
🎯 TP3: 3317
❄️ Patience required — only active if NY dumps hard
📌 Important Notice!!!
The above analysis is for educational purposes only and does not constitute financial advice. Always compare with your plan and wait for confirmation before taking action.
🖊️ If these insights help you refine your trading plans, give us a boost and follow GoldMindsFX on TradingView. Let's grow together! 🛡️

Gold maintains a volatile range, pay attention to subsequent breOn Tuesday, the gold price generally showed a downward trend. The highest price rose to 3348.45 on the day, and the lowest price fell to 3299.49, closing at 3316.95. On Tuesday, gold was under pressure during the early trading session, and then the price continued to fluctuate during the European and US trading sessions. Overall, the price is still running within the fluctuation range, but once the daily support is broken, it is expected to break the lower edge of the range.
From the multi-cycle analysis, first observe the monthly rhythm. The price rose for three months before and then a single-month correction occurred. Recently, it has risen for four months and then a single-month correction occurred. Therefore, according to the rhythm, April is generally bullish, but for May, we must pay attention to market risks. From the weekly level, the gold price is supported by the support level of the 3040 area. So from the perspective of the mid-line, we can continue to maintain a bullish view. From the daily level, the current price is supported by the 3004 area support. This position is the key watershed of the band trend. The market will further break down in the future, so it will be focused on in the future. At the same time, for the short-term four-hour price, it has been fluctuating up and down at the four-hour key position recently. Pay attention to the resistance of 3387 and 3370 on the top, and the 3260 area on the bottom. Before the data, the market as a whole tends to fluctuate temporarily. After breaking through the daily support, pay attention to the performance of breaking down the lower edge of the range.

(XAU/USD) 1H Chart: Long Setup Targeting 3,500 with Key Support Entry Point: Suggested near 3,301.51 USD (marked with the purple support zone).
Stop Loss Zone: Below 3,266.87 to 3,221.67 USD (marked in blue and purple). This is where you limit your loss if the trade goes wrong.
First Target (Target Point One): 3,376.65 USD.
Final Target (EA Target Point): 3,523.55 USD (~8.26% potential gain from entry).
Main Setup Idea:
The price is consolidating around the support zone.
There's a plan to buy (go long) at the purple zone (Entry Point) and aim for the two target points

Interpretation of technical ideas for short-term gold trading onGold opened this week in a volatile market. It opened high and fell on Monday. The US market rose above the high opening position. It fell in the Asian market on Tuesday. The European and American markets fluctuated and adjusted. The main reason is that the data this week is concentrated in the second half of the week. From the past market, this week's rebound did not touch 3370, so it cannot be treated as strong. It did not fall below the bottom support of 3260. The overall trend is convergent and volatile. Now the technical indicators are in a sticky posture, and the three lines of the Bollinger Bands are also closed. The Asian market mainly focuses on the continuation of volatility. The upper side focuses on the resistance of the hourly Bollinger Band upper rail 3330, and the lower support is at 3300.
Pay attention to the operation of the range at noon. If the gold price touches 3300 below, participate in long orders with a light position. With a small loss, look at the target of the upper rail pressure of the Bollinger Band at 3330; if there is a rebound before the European market that touches the upper rail of the Bollinger Band at 3330, you can try to arrange a short position to be bearish, and the target is whether 3300 can be broken. The small non-farm data will be released before the U.S. market opens, followed by the PCE data. At that time, I will re-position my position based on the data release and wait for the data release to help gold prices move out of the range of volatility.

Potential HSNot confirmed yet but I'm jumping in anyways. I bought some puts of GLD for May 23 strike 304. My SL triggers if the price breaks up the resistance shown and closes above in the daily timeframe. Might be some turbulence, bulls will try to push the price higher. too much noise in the political arena, but Gold is overbought and needs a healthy correction.

Shorting opportunities are coming near 3330 in the US market!
📌 Driving events
Because the easing of US-China trade tensions has weakened gold's safe-haven appeal, while investors are waiting for US economic data to assess the Fed's policy direction. Gold has been in a range recently as the market now waits for details of the first trade agreement, which is expected to be announced this week or next week.
📊Comment analysis
Gold reached a turning point last week, with Trump making some very positive comments, while stagflation risks continued to be excluded, and gold continued to fall. Stagflation pricing has driven gold prices higher, and as the market begins to exclude this risk, it is normal for a correction to occur, especially considering that "long gold" has become one of the most crowded trades.
💰Strategy Package
Short position:
Actively participate around 3330 points, profit target around 3300 points
⭐️ Note: Labaron hopes that traders can properly manage their funds
- Choose the number of lots that matches your funds
- Profit is 4-7% of the fund account
- Stop loss is 1-3% of the fund account
Gold -- >> 100,000Gold has established strong support around ₹95,000, indicating a potential bullish reversal. A sustained move above this level could propel prices toward the psychological milestone of ₹1,00,000 in the near term.

Gold's shock trend and interpretation of US market thinkingGold continues to fluctuate, we continue to look down in the European session, try long orders near 82;
2025-4-29 Tuesday Gold Asia-Europe long and short strategies
The market is always changing, the only constant is the existence of risks.
Keeping the principal is always the first principle.
◆Short order◆
Aggressive: short near 3356, stop loss 7 points, short at 62-68 after breaking,
Stop loss: stop loss 7 points each, or unified stop loss 77. Target: 3286-69-54-42, continue to reduce holdings after breaking
◆Long order◆
Aggressive: long at 82, stop loss 7 points, long at 75-70 after breaking,
Stop loss: stop loss 7 points each, or unified stop loss 62. Target: 98-06-12, continue to reduce holdings after breaking;
Steady: 66 long, stop loss 7 points, 58-52 long after breaking,
Stop loss: 7 points for each stop loss, or a unified stop loss of 42. Target: 98-06-12, continue to reduce holdings if the position breaks;
【Today's long orders must be promptly protected after profit, and the next position will be entered after the principal is protected】
Stop loss is determined according to your actual tolerance. Protect in time after profit, and enter the next position after protection】
★ Pattern analysis and attention:
Daily strategy ideas: Asia and Europe, our current price 06 long orders are also given to around 22 as expected. We are still bearish if the resistance is not broken, and try 82 long orders
【Reference: Russia-Ukraine peace talks, US-Japan tariff negotiations】
【Data: wholesale inventory rate, consumer confidence index, job vacancies】
☆ There is a delay in posting, and the final operation is based on real-time strategy and current price orders. Please continue to pay attention;
☆ Strategy orders are divided into warehouses, and the total position shall not exceed 20%;

Gold fluctuates, short-term low-multiple harvest
Gold began to fall after hitting 3500. The current low is temporarily at 3260. The daily cycle has been tested for three trading days and failed to break below. The form is a transition between Yin and Yang lines, which is a very obvious wide-ranging market. Be careful not to follow orders in this kind of trend. There is no continuity in the market and it just goes back and forth.
The 4H cycle is a horizontal box operation. In the short-term US market, it is recommended to operate low and long. Pay attention to 3300/3310 to go long. The key watershed above is 3370. The long position can confirm the end of the adjustment only when it stands at this position.
Hello traders, if you have better ideas and suggestions, welcome to leave a message below, I will be very happy

Gold is still volatile, buy at 3298-3305 in the US market
📊Comment analysis
Gold prices need economic news to break through the sideways price range of around 3300. Today, continue to wait and see around 3310, waiting for the right time to enter the market in time.
💰Strategy package
Long positions:
💲Actively participate in gold around 3298-3305 points, with a profit target around 3320 points
Short positions:
💲Actively participate in gold around 3320-3330 points, with a profit target around 3303 points
💢Precise sniping, follow the trading strategy = easy money

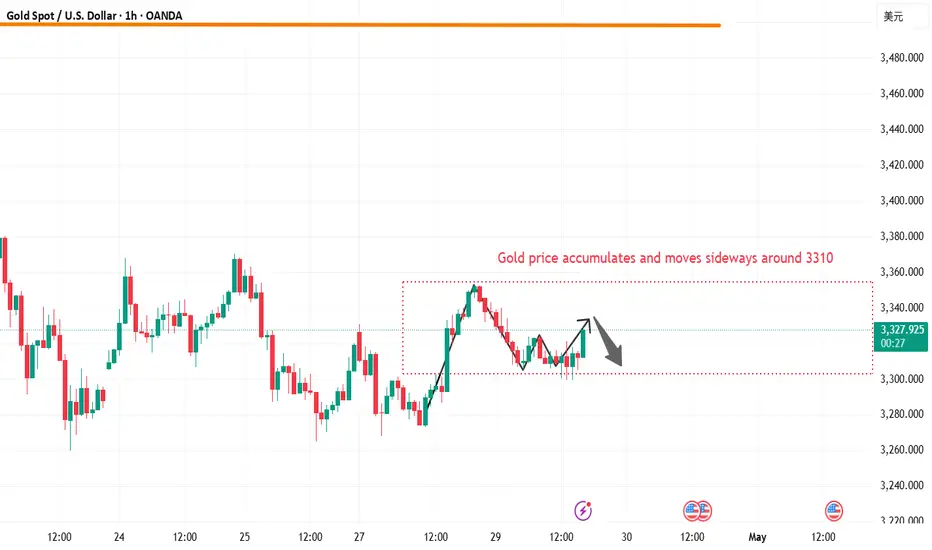
Gold moves sideways ahead of US GDP news. What's next?OANDA:XAUUSD Optimism about US trade talks with major partners boosted risk appetite and supported the dollar. The US Treasury released a report that talks with India made good progress, while President Trump softened his rhetoric on China, which also boosted the dollar. Meanwhile, traders are on the sidelines ahead of the release of US first quarter GDP data. If the data is weak, gold as a safe haven asset may rise sharply. Therefore, the gold market remains sensitive to trade news and macro data, especially in the context of market rebalancing at the end of April.
Currently, as part of the current momentum and correction, Quaid expects gold prices to rise from the 0.5-0.7 Fibonacci area. Gold prices may test 3325-3330 in the consolidation range and then resume the correction.
Resistance: 3325, 3350, 3370
Support: 3290, 3270
Traders please wait for the resolution of the tariff dispute and the economic data to be released tomorrow. However, during price consolidation, Quaid expects the price to bounce off the support levels. If the price continues to squeeze towards any boundary, giving priority to the support level, the possibility of breaking out of the consolidation bottom may increase.

Gold (XAUUSD) Take Profit📉 Gold (XAUUSD) Trade Update
A few hours ago, I shared a short setup on gold — it has successfully hit the target and closed with a solid profit.
Looking ahead, there's still room for further downside. In the medium term, gold could decline towards the $3020 level.
🔔 I post detailed trade ideas and daily market analysis like this every day on my TradingView profile.
👉 Follow me to get notified and read the full breakdowns.

Risk aversion eases, gold continues to fluctuateSpot gold prices (XAU/USD) fluctuated and fell, approaching the $3,300 mark, continuing the weak trend of the previous trading day.
From the daily chart, gold prices have fallen from their historical highs and are currently approaching the 38.2% Fibonacci retracement level (US$3,300-3,290). The key support level below is concentrated in the $3,265-3,260 range, which is also the previous consolidation range. If it falls below, it will open up the space for a 50% retracement level (US$3,225) or even $3,200.
In terms of technical indicators, the MACD indicator shows signs of a dead cross, and the green kinetic energy column expands moderately, indicating that short-term bears still have the initiative; the RSI indicator is still oscillating near the 50 axis, and has not yet shown extreme oversold, indicating that the downside space may be limited. Once the price rebounds, the initial resistance above is seen at $3,348-3,353.
After the breakthrough, it is expected to re-challenge the $3,400 mark, and even attack $3,425-3,427.
If the US PCE inflation and non-farm data weaken this week, it will further support the re-entry of gold bulls.

Gold is long, bottoming out during the day and rising
We can never predict what will happen at the crossroads of fate, but we can choose whether to give up or move forward with pain and run towards the end of our dreams. Even if there is no medal of victory, dignity and pride will accompany us all the way. Defeating opponents is only the winner of life; defeating yourself is the strong man of destiny!
After the gold gap opened high, it began to fall back quickly to around 3267. After a small rebound in the European session, it continued to retreat. The US session had a sideways correction before, and the US session started a large-scale pull-up, which continued to around 3353 and closed in the form of a small positive line with a long lower lead. After opening during the day, it continued to fall, and the current lowest reached around 3308. At present, the long and short positions are still fluctuating in a large range. The upper key pressure and the upper edge of the range are maintained at around 3370, while the lower edge and support of the large range below are maintained at around 3260. It is very likely that there will be multiple shocks and choices in this range again. At present, the multi-hour line is expected to form a sideways trend. After finishing, the daily line will fight at the short-term moving average position. The short-term moving average is also between the strength of long and short positions. Today's retracement needs further confirmation from the European session. If the European session continues to be weak, it is still necessary to pull back and short before the US session. The short-term support below is maintained near the integer level of 3300. If gold pulls back to 3310 during the day, it can be long first, with a target of 3330-50 and a loss of 3295. If the European session continues to break down, the US session will pull back below 3300 and short, with a target of 3270-60 and a loss of 3308. There will be large fluctuations in the short term, so be cautious about sweeping back and forth between long and short positions!
Today's operation: Gold will pull back to 3310 during the day and go long, with a target of 3330-50 and a loss of 3295.
Hello traders, if you have better ideas and suggestions, welcome to leave a message below, I will be very happy

Gold------Buy near 3302, target 3319-3350Gold market analysis:
Yesterday's gold fluctuations were actually in line with our expectations. The 3291 sell price we planned in the Asian session was hit. We followed the buy orders in the European and American sessions and made a lot of profit. The buy orders were very exaggerated and reached 3352. This is the market. We must respect the market. The fluctuation range is very large. The daily line and the pattern finally closed with a hammer candle pattern, and the lower shadow line is very long. Let's take a look at the 4H pattern, which shows that it has been a large fluctuation in the high range. The fluctuation range is 3370-3258. The structural fluctuation is very obvious. The direction will appear after the structure is broken. Today, let's take a look at its fluctuation direction. The Asian session directly plunged. We should not rush to take over. The market in the past two days is that it is easy to die if we take over the big support. If we want to take over, we also need to look at stabilization and 2 steps. We try to follow the direction of the hour level directly, rather than the direction of the daily line. The big market is 20 points in one hour.
Technical analysis:
The daily moving average begins to hover, and the weekly and monthly lines will show directions this week. The weekly tombstone top is still there. If the closing price is negative this week, then the gold below will continue to fall and continue to dive. There is no big news about the short-term tariff policy. Gold needs a technical retracement. In today's Asian session, we will focus on the support of 3302. Let's see if it stabilizes at this position. If it stabilizes, there will be fluctuations and rebounds. The pressure around 3352 is today.
Support 3302, strong at 3280, suppress 3333 and 3352, and the strength and weakness watershed of the market is 3310
Fundamental analysis:
This week is a data week. Big data will be released one by one starting from Wednesday. In addition, continue to pay attention to the situation of the US dollar and the changes in tariff policies.
Operational suggestions:
Gold------Buy near 3302, target 3319-3350

Interpretation of the short-term operation ideas of shopping4-hour trend will not hit the high point within this 4-hour period, so currently we can focus on the morning high point and yesterday's high point 3348-3353. Currently we can focus on the support near 3316.
First point: After the 4-hour high closed with a small positive column yesterday, a big negative column fell in the morning, indicating that the price will continue to bottom out in the short term. Therefore, we can arrange short orders below yesterday's high point 3353-3348 in the white session, so 3340-44 is the best shorting point.
Second point: Because the price rose to 3336 after yesterday's high of 3302 and only retreated to 3319, the support of 3316-17 still exists. The point we focus on in the Asian and European sessions is when 3316-17 will break.
Third point: In the event of an accident, the price directly pulls back and breaks the high point, then the next short position is 3370-72; I think this probability is small. Then if it breaks 3315-16, we need to find a low position to go long. Then 3300-3288 and 3273 in yesterday's Asian and European sessions are the long positions. We can use small stop losses to bet on long positions.
Strategy:
Short at 3340-44 during the Asian session, defend at 3353, target at 3330-3320, break at 3315 and target at 3300-3290
Short at 3370-72, defend at 3378, target at 3350
After breaking 3315, short at 3300-328-3276 with a small stop loss of 5-6 US dollars, target at 3305-3350-70

Gold fluctuates within a wide range, and may stop falling as it On Tuesday, gold trading relied on the 3310 support level to directly go long, and the near-point pressure area of 3360/80 was bullish. The long logic of gold as a "safe haven trump card" is beyond doubt. The small cycle adjustment is only the accumulation stage. Once it starts to explode, it will be unstoppable. Recently, when gold touched 3500 again, there was a market view of "suspected top". It is recommended that all investors maintain their composure-the short-term adjustment is insignificant compared to the entire rising cycle. This time, the price retreated from 3500 and corrected by about US$240, which is still within a reasonable range relative to the previous increase. It is emphasized again that it is not recommended for investors to be bearish on gold in the long term, or to subjectively determine that 3500 has become the top. Such psychology is prone to trading deviations and even breeds a dangerous mentality of short orders to bear losses, which is the root cause of long-term losses.
In the early trading of the day, a 3310 long strategy has been deployed, and it is suggested that 3315 can be entered into the long position during the trading session. The current position is in market fluctuations. The current uptrend will first focus on the recovery of the 3340/45 line, and the opening price pressure level should be paid special attention to, especially during the Asian and European sessions. If the Asian and European sessions maintain a shock correction pattern, the support level will continue to be relied on for game play; if the uptrend effectively breaks through 3340/45 and stabilizes, the handover period between the European and American sessions is expected to explode to the 3380 line, or even challenge a higher price range.

XAU/USD(20250429) Today's AnalysisTechnical analysis:
Today's buying and selling boundaries:
3321
Support and resistance levels:
3405
3374
3353
3289
3268
3237
Trading strategy:
If the price breaks through 3353, consider buying, the first target price is 3374
If the price breaks through 3321, consider selling, the first target price is 3289

Gold Ideas - XAUUSD Weekly Outlook | April 28, 2025🧠 Quick Outlook:
Gold remains locked in a corrective range after its aggressive rally to new all-time highs.
Price is currently consolidating between major liquidity zones, preparing for its next big move.
However, growing geopolitical risks — including rising Middle East tensions and potential currency interventions out of Japan — could trigger safe-haven flows, especially during Asia session volatility.
While the high timeframe structure remains bullish above the 3220–3235 pivot,
the immediate tactical focus is on the 3340–3365 zone, where key liquidity battles are unfolding.
🔥 Major Zones to Watch:
Resistance 3380–3395 Major supply and flip zone — strong liquidity cluster
Resistance 3350–3360 Minor local resistance — potential bull trap area
Support 3260–3280 Critical intraday support and liquidity pocket
Support 3220–3235 Last pivot standing to maintain bullish structure
⭐Tactical Focus This Week:
🎯 Will Gold reject or conquer the 3380–3395 stronghold?
🎯 Will 3350–3360 act as a stepping stone or a snare for early buyers?
🎯 Are buyers prepared to defend the 3260–3280 liquidity pocket with real force?
🎯 What happens if 3220 collapses?
Patience and sniper discipline will make the difference this week, as Gold approaches critical decision points and major news.
📌 Important Notice!!!
The above analysis is for educational purposes only and does not constitute financial advice. Always compare with your plan and wait for confirmation before taking action.
🖊️ If these insights help you refine your trading plans, give us a boost and follow GoldMindsFX on TradingView. Let's grow together! 🛡️

XAU/USD 29 April 2025 Intraday AnalysisH4 Analysis:
-> Swing: Bullish.
-> Internal: Bullish.
Analysis and bias remains the same as analysis dated 23 April 2025
Price has now printed a bearish CHoCH according to my analysis yesterday.
Price is now trading within an established internal range.
Intraday Expectation:
Price to trade down to either discount of internal 50% EQ, or H4 demand zone before targeting weak internal high priced at 3,500.200.
Note:
With the Federal Reserve's dovish stance and persisting geopolitical uncertainties, heightened volatility in Gold is expected to continue. Traders should proceed with caution and adjust risk management strategies in this high-volatility environment.
Price could also be driven by President Trump's policies, geopolitical moves and economic decisions which are sparking uncertainty.
H4 Chart:
M15 Analysis:
-> Swing: Bullish.
-> Internal: Bearish.
Analysis and Bias remains the same as analysis dated 24 April 2025.
Price printed as per my note yesterday whereby I mentioned that we should be surprised if price printed a bearish iBOS as all HTF's require a pullback.
Price subsequently printed a bearish iBOS which confirms internal structure.
Intraday Expectation:
Price has traded up to just short of premium of internal 50% EQ where we are seeing a reaction. Price could potentially trade further into premium of 50%, or H4/M15 nested supply zone before targeting weak internal low priced at 3,260.190.
Note:
With the Federal Reserve maintaining a dovish stance and ongoing geopolitical tensions, volatility in Gold prices is expected to remain elevated. Traders should exercise caution, adjust risk management strategies, and stay prepared for potential price whipsaws in this high-volatility environment.
Trump's tariff announcement will most likely cause considerably increased volatility and whipsaws.
M15 Chart:
