Monday market forecast, pay attention to the 3339 retracement📰 News information:
1. The Trump administration puts pressure on the Federal Reserve to cut interest rates
2. The continued impact of tariffs and the responses of various countries
📈 Technical Analysis:
This week's basic judgment and forecast on the gold market trend were consistent, but on Friday, the overall gold fluctuations were not large. The overall trend of the daily line fluctuated around 3345, and the 3345 line also became a short-term long-short watershed. Although prices are likely to rise more easily than fall in the short term, it should be noted that the three-month adjustment cycle is coming to an end while the fundamentals of the bull market have not changed. It is recommended that you focus on preventing risks from short position operations next week. At the same time, the overall strong shock pattern, the anti-pulling momentum has not reached the top suppression position, and the area around 3339 below is the previous intensive trading area, which constitutes a certain support in the short term. If the market fails to effectively break below next week, it will greatly boost the bullish momentum, and it is not ruled out that there will be a possibility of refreshing the high point near 3380 next week.
On the whole, the short-term focus next week is the 3345-3335 area below. If it falls back to this point, you can consider arranging long orders. The short-term target is 3355-3365, and the strong trend is expected to continue to touch 3375-3385.
🎯 Trading Points:
BUY 3345-3335
TP 3355-3365-3375-3385
In addition to investment, life also includes poetry, distant places, and Allen. Facing the market is actually facing yourself, correcting your shortcomings, confronting your mistakes, and strictly disciplining yourself. I hope my analysis can help you🌐.
TVC:GOLD PEPPERSTONE:XAUUSD FOREXCOM:XAUUSD FX:XAUUSD OANDA:XAUUSD FXOPEN:XAUUSD
Goldprice

GOLDGOLD needs some more upside, reaction zone is 3380-3395, will see how gold reacts at that level.
Disclosure: We are part of Trade Nation's Influencer program and receive a monthly fee for using their TradingView charts in our analysis.

Gold-Bullish Leg to ContinueGold is Bullish. a minor pullback may happen before it continues its leg up. Looking at uncertainty at global level, Gold might push to 3400.
Gold breaks trendline and returns to uptrend. BUY NOW!✏️ OANDA:XAUUSD A deep sweep to 3310 and bounce back to the trading range. Gold is reacting at the Trendline around the price zone of 3344. This is an important price zone that if broken will return to the uptrend and head towards 3373 soon. 3332 plays an important role in the current bullish wave structure, which is a suitable SL placement point for BUY signals.
📉 Key Levels
Support: 3332-3312
Resistance: 3344-3357-3373-3389
BUY trigger: Break and trading above Resistance 3344 (trendline, top uptrend wave 1)
BUY DCA trigger: Break Resistance 3353
Target 3373
Leave your comments on the idea. I am happy to read your views.

Gold Maintains Bullish Tone – Eyes on $3,350 Breakout📊 Market Overview
• Gold is trading around $3,339 – $3,340, after rebounding from the session low at $3,332.
• The USD is temporarily weakening, and safe-haven flows remain steady — key factors supporting gold.
• Markets are awaiting fresh U.S. economic data for clearer directional cues.
📉 Technical Analysis
• Key Resistance Levels:
– Near-term: $3,344 – $3,345
– Extended: $3,352 – $3,356 (weekly highs)
• Key Support Levels:
– Near-term: $3,332 – $3,335
– Extended: $3,320 – $3,325 (MA confluence + technical base)
• EMA: Price remains above EMA 09, confirming a short-term uptrend.
• Candle Pattern / Volume / Momentum: RSI is around 54–56; momentum remains positive but has cooled — suggesting potential consolidation.
📌 Outlook
Gold is maintaining a bullish technical structure — if it breaks above $3,345, a move toward $3,352 – $3,356 is likely. On the downside, a drop below $3,332 could trigger a retest of $3,325 – $3,320.
💡 Suggested Trading Strategy
🔺 BUY XAU/USD: $3,324 – $3,327
• 🎯 TP: 40/80/100 pips
• ❌ SL: $3,320
🔻 SELL XAU/USD :$3,352 – $3,355
• 🎯 TP: 40/80/100 pips
• ❌ SL: $3,359

How to operate the gold market opening next MondayAnalysis of gold market trends next week:
Analysis of gold news: Spot gold fluctuated and rose in a narrow range during the U.S. market on Friday (July 18), and is currently trading around $3,354.05 per ounce. On Thursday, spot gold staged a thrilling "deep V" market. Under the dual stimulation of the U.S. retail sales data in June exceeding expectations by 0.6% and the number of initial jobless claims falling to 221,000, the U.S. dollar index once soared to a monthly high of 98.95, instantly suppressing spot gold to an intraday low of $3,309.82 per ounce. But surprisingly, the gold price then rebounded strongly and finally closed at $3,338.86, down only 0.25%. This "fake fall" market reveals the deep contradictions in the current market-although economic data temporarily supports the strengthening of the U.S. dollar, investors' concerns about inflation caused by tariffs are forming a "hidden buying" of gold. The joint rise of the U.S. dollar and U.S. bond yields did suppress gold prices, but strong takeover orders emerged in each falling window. Behind this phenomenon, smart money is quietly making plans. When the 10-year U.S. Treasury yield climbed to a monthly high of 4.495%, gold refused to fall further. This divergence suggests that the market has serious differences on the direction of the Fed's policy.
Technical analysis of gold: After the opening yesterday, gold continued to fall slowly, and the negative impact of the unemployment data in the U.S. market further suppressed the bullish momentum. The lowest price in the U.S. market reached 3310, and the cumulative decline for the whole day exceeded 30 US dollars. But the key is that gold rebounded again at midnight, forming a wide range of fluctuations on Thursday, which was completely in line with expectations. The 3310 bottom-picking and long-term strategy given during the session successfully captured large profits in the band. This trend once again verified the core judgment of this week: gold is in a high-level fluctuation dominated by a bullish trend, and the practical value of this view continues to highlight. After clarifying the current dual attributes of "bullish trend + volatile trend", Friday's trading needs to focus on the effective profit space within the range. It is expected that the 3375-3310 large range will be difficult to break this week, and the small range can be locked at 3355-3320. Before the range is broken, high-selling and low-buying operations can be performed.
.
The technical side shows that the daily line and the 4-hour Bollinger Bands are closed synchronously. At this time, there is no need to worry about the direction, and effective trading can be achieved by keeping a close eye on the range boundary. It is worth noting that the 4-hour moving average system has obvious upward divergence characteristics. Continuing the rebound momentum at midnight on Thursday, gold still has room to rise today, and the upper target is 3360-3365. The small cycle support is clear: 3330 and 3320 are not broken, both are good opportunities for long positions. During the US trading session, it is necessary to pay attention to the breaking of the 3365 and 3375 resistance levels: if the pressure is not broken, there will be room for a decline, and short-term short positions can be tried. On the whole, Charlie suggests that the short-term operation strategy for gold next week should focus on buying on pullbacks and buying on dips, supplemented by rebounds and selling on highs. The short-term focus on the upper side is the 3375-3385 line of resistance, and the short-term focus on the lower side is the 3340-3330 line of support. FX:XAUUSD ACTIVTRADES:GOLD VANTAGE:XAUUSD TVC:GOLD ICMARKETS:XAUUSD CMCMARKETS:GOLD SAXO:XAUUSD

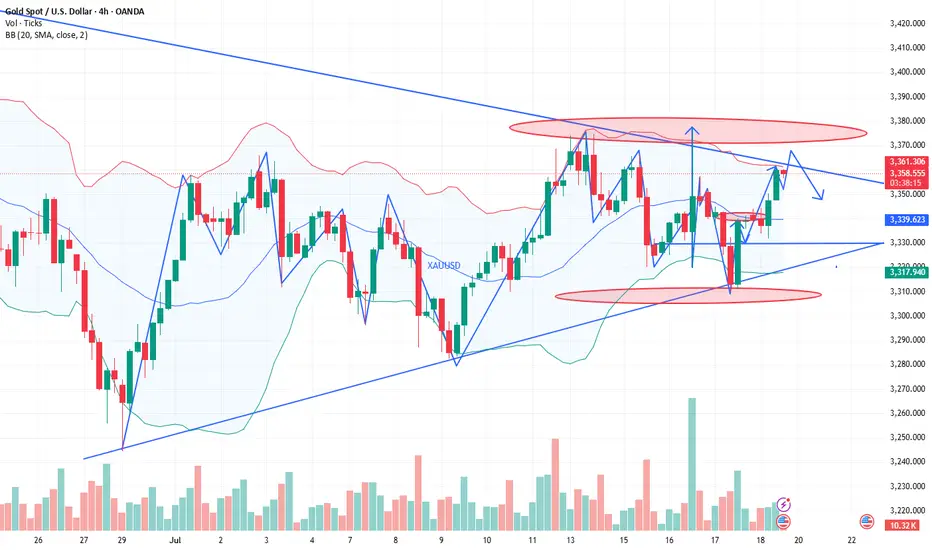
Long and short fluctuations, the market is waiting for a break📰 News information:
1. Powell responds to White House issues
2. Will other countries impose reciprocal sanctions on tariffs?
📈 Technical Analysis:
Although the MACD indicator of the gold hourly line formed a golden cross, the market reached a high of around 3361, and the RSI indicator was close to the overbought area, so we need to be cautious about corrections. From the 4H chart, the MACD second golden cross is on the zero axis. Currently, we are paying attention to the moving average SMA5 near 3343, and the SMA60 support line 3332. If the 4H upward trend falls back, we need to go long. At present, gold is still running above, and there is no good participation point in the short term, but on the whole, we should pay attention to the support of 3345-3332 below, and we can consider going long if it retreats and stabilizes. We continue to pay attention to the resistance pressure of 3375-3385 above, and we can try to go short if it does not break.
🎯 Trading Points:
SELL 3375-3385
TP 3365-3355
BUY 3345-3332
TP 3365-3375-3385
In addition to investment, life also includes poetry, distant places, and Allen. Facing the market is actually facing yourself, correcting your shortcomings, facing your mistakes, and exercising strict self-discipline. I share free trading strategies and analysis ideas every day for reference by brothers. I hope my analysis can help you.
FXOPEN:XAUUSD OANDA:XAUUSD FX:XAUUSD FOREXCOM:XAUUSD PEPPERSTONE:XAUUSD TVC:GOLD
The short-selling idea remains unchanged, defend 3355📰 News information:
1. Powell responds to White House issues
2. Will other countries impose reciprocal sanctions on tariffs?
📈 Technical Analysis:
Gold closed with a long lower shadow on the daily line yesterday and closed with a doji on the hourly line. In the short term, gold may continue to rise and is expected to touch the 3355 line. If gold cannot break through and stabilize above 3355, then gold may fall back. We can still consider shorting, and the target can be 3330. If the trend is as expected, it may form the embryonic form of a head and shoulders bottom. On the contrary, if the gold price breaks through 3355, stop loss on short positions and pay attention to the high resistance of 3375-3385.
🎯 Trading Points:
SELL 3340-3355
TP 3330-3320
In addition to investment, life also includes poetry, distant places, and Allen. Facing the market is actually facing yourself, correcting your shortcomings, facing your mistakes, and exercising strict self-discipline. I share free trading strategies and analysis ideas every day for reference by brothers. I hope my analysis can help you.
TVC:GOLD PEPPERSTONE:XAUUSD FOREXCOM:XAUUSD FX:XAUUSD OANDA:XAUUSD FXOPEN:XAUUSD

Gold trend analysis and latest exclusive operation suggestionsTechnical analysis of gold: After the opening yesterday, gold continued to fall slowly. The negative impact of unemployment data in the US market further suppressed the bullish momentum. The lowest price in the US market reached 3310, and the cumulative decline for the whole day exceeded 30 US dollars. But the key is that gold in the New York market rebounded again, forming a wide range of fluctuations on Thursday, which was completely in line with expectations. The 3310 bottom-picking and long-term strategy given during the session successfully captured large profits in the band. This trend once again verified the core judgment of this week: gold is in a high-level fluctuation dominated by the bullish trend, and the practical value of this view continues to highlight. After clarifying the current dual attributes of "bullish trend + oscillating trend", Friday's trading needs to focus on the effective profit space within the range. It is expected that the 3375-3310 large range will be difficult to break during the day this week, and the small range can be locked at 3355-3320. The high-selling and low-buying operations can be performed before the range is broken.
The technical side shows that the daily line and the 4-hour period Bollinger band are closed simultaneously. At this time, there is no need to worry about the direction, and effective trading can be achieved by keeping a close eye on the range boundary. It is worth noting that the 4-hour moving average system has obvious upward divergence characteristics. Continuing the rebound momentum of the New York market on Thursday, gold still has room to rise today, and the upper target is 3360-3365. The small cycle support is clear: 3330 and 3320 are not broken, both are good opportunities for long positions. During the US trading period, we need to pay attention to the breaking of the 3365 and 3375 resistance levels: if they are under pressure and not broken, there will be room for a fall, and you can try short-term shorting. Overall, Charlie recommends that the short-term operation strategy for gold today is mainly to step on the low and long, supplemented by the rebound high. The short-term focus on the upper side is the 3375-3385 resistance, and the short-term focus on the lower side is the 3345-3335 support. PEPPERSTONE:XAUUSD VELOCITY:GOLD EIGHTCAP:XAUUSD ACTIVTRADES:GOLD EIGHTCAP:XAUUSD CMCMARKETS:GOLD EIGHTCAP:XAUUSD
Gold rebound brings bearish opportunities
Before the fishermen go out to sea, they don't know where the fish are? But they still choose to go because they believe they will return with a full load. When you invest, you don't know whether you can make a profit, but you still need to try, and from the moment you decide to do it, you must insist on believing to gain something. The same is true for gold investment. You may still be losing money at the moment, but as long as you find me, all losses will be solved!
Views on the trend of gold!
In terms of gold, unfortunately, the bulls don't seem to last long, and they are also a bit unstable! Emphasize the most critical point, the continuous rise of the sun, the first wave of V-shaped rebound last night, and then the high-level oscillation, and there was no continuation of the rise of the sun last night. The bulls did not take off in one wave, but were held down again. But in the same way, don't think that the bulls are held down, and the bears will come. We still have to distinguish according to the range and strength. In many cases, the market maintains a oscillating range.
So how do you look at it today? Is there still hope for the bulls? From the perspective of correction, every big drop has poor continuity, and they all bottom out and rebound, just like gold fell to 3310 last night and violently rose to 3344, so there is a high probability that there will be continuation after the retracement today. On the one hand, even if it rebounds, it is also volatile, and the rebound and second decline is the continuation of the market. Therefore, currently pay attention to two points, the upward pressure 3355, and the downward strength and weakness dividing point 3325!
Gold: You can short at the rebound of 3350-55, defend 10 US dollars, and the target is 3330-25! If it breaks 3325, it will look down to the double bottom support of 3310. On the contrary, if it does not break, it can be shorted and look up to 3345-50!

Bottom-out rebound, 3338 short orders enteredYesterday, the gold market was affected by Trump's remarks about firing Federal Reserve Chairman Powell. After briefly falling below 3320, the price quickly rose by nearly 60 points, reaching a high of 3377. Trump later clarified that the news was false, triggering a gold sell-off, and the market rose and fell. As of Thursday's European session, gold prices fell back to around 3320. After a rapid rise and fall in the US market on Wednesday, the downward trend continued on Thursday, with the US market hitting a low of 3310 before rebounding. Judging from the 4-hour chart, the Bollinger Bands failed to open downward, indicating that the current market lacks continuity and the overall market remains in a volatile pattern. In a volatile market, it is recommended to pay attention to key support and resistance levels for high-selling and low-buying operations. The upper resistance range is currently at 3343-3351, and the important watershed support level below is at 3310.
OANDA:XAUUSD

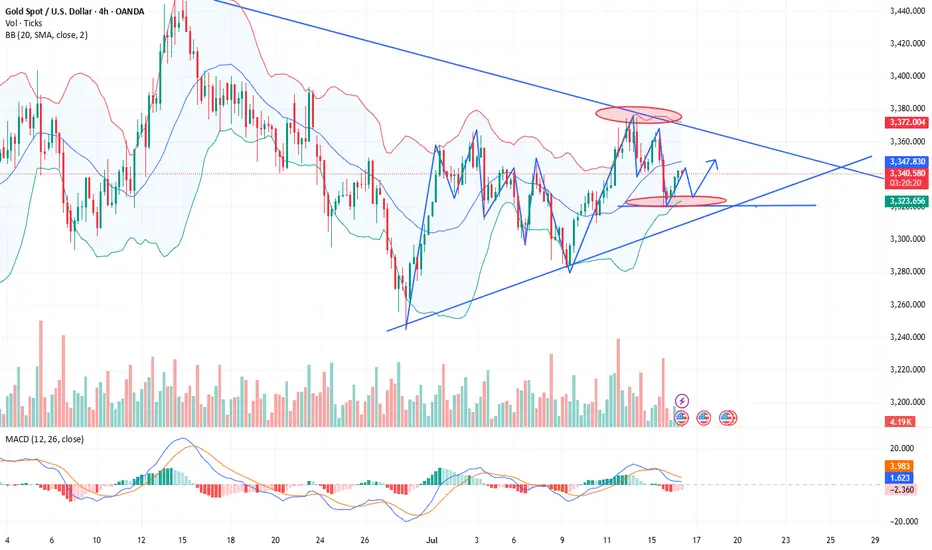
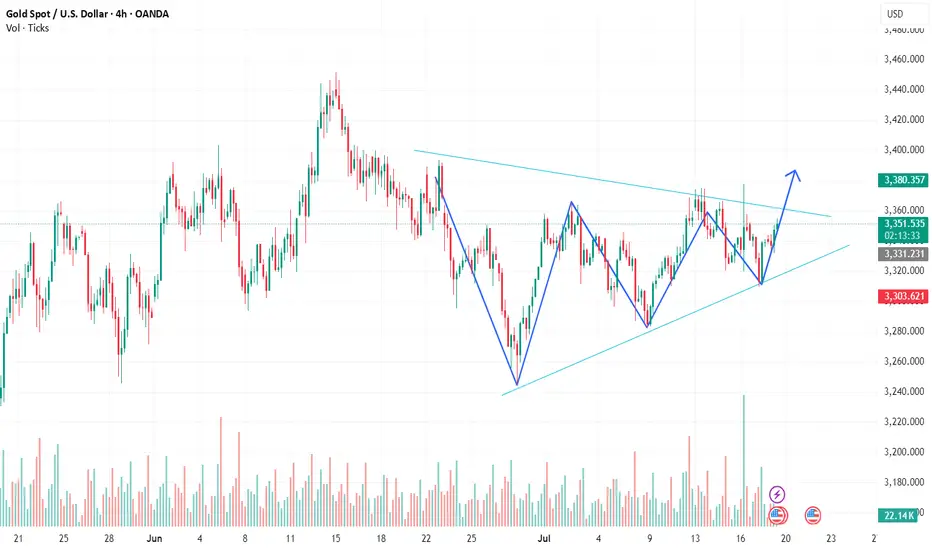
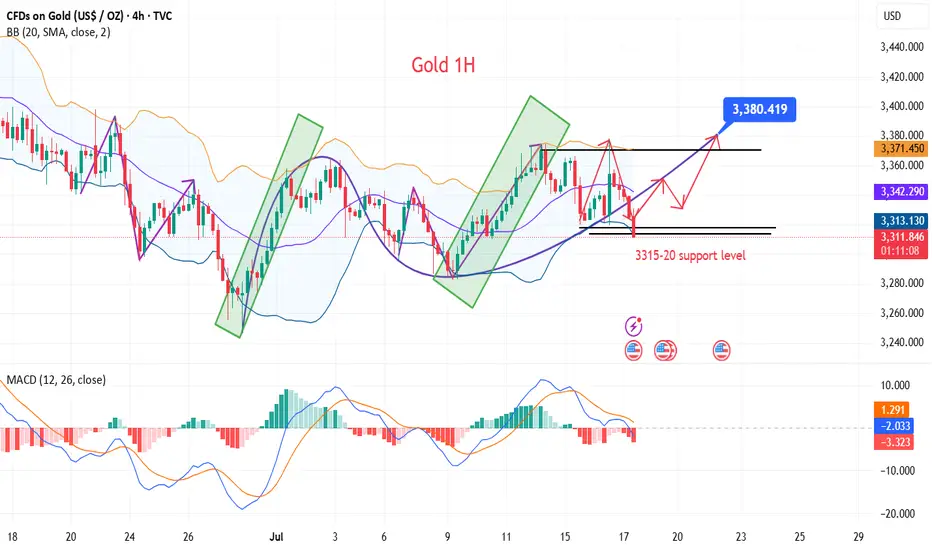
GOLD H1 Technical Analysis🧠 Chart Breakdown & Trade Idea: Symmetrical Triangle Formation
We’re observing a symmetrical triangle formation — a classic consolidation pattern that often precedes a strong breakout move. The price has been making higher lows and lower highs, gradually tightening within two converging trendlines.
This pattern indicates that buyers and sellers are in a temporary equilibrium, with volatility compressing. The market is clearly waiting for a catalyst to decide the next big move.
🔍 Key Observations:
1. Trendlines:
- The upper resistance trendline is sloping downward, connecting several lower highs.
- The lower support trendline is sloping upward, connecting multiple higher lows.
2. Volume Pattern:
- Volume has been tapering off during the consolidation phase — a typical behavior during triangle formation.
- A volume spike at the breakout point would confirm the direction and strength of the move.
3. Price Action:
- The price has bounced cleanly off the lower trendline and is now approaching the upper boundary.
- A strong V-shaped recovery from support indicates buyer dominance at lower levels.
- The market is now testing the triangle’s upper resistance again — a crucial inflection point.
🚀 What the Chart is Saying
The chart is signaling a potential bullish breakout. The consistent formation of higher lows shows increasing demand, and the price is now poised to test — and possibly break — the descending resistance.
If the breakout happens with above-average volume, it would validate the pattern and open the door for a sharp upward rally.
🎯 Trade Setup (When to Buy)
✅ Buy Entry:
- Wait for a confirmed breakout — a candle close above the upper trendline with strong volume.
- Ideally, price should break above the recent swing high to avoid a false breakout.
🛑 Stop Loss:
- Just below the most recent higher low or the triangle’s lower trendline.
🎯 Take Profit:
- Measure the widest part of the triangle and project it upward from the breakout point.
- This gives you a realistic and technical target area.
📌 Conclusion:
This symmetrical triangle is nearing its apex, and the current setup favors the bulls. A breakout above resistance, accompanied by volume, could offer a high-probability long trade. Patience is key — wait for confirmation before entering.
Gold Surges Late Session – Targeting $3,345+📊 Market Overview:
• Gold has just broken higher to $3,339, extending its bullish move after clearing the $3,335 resistance zone.
• Market sentiment remains supportive as the USD weakens and U.S. bond yields stabilize, while the Fed still shows no signs of cutting rates soon.
📉 Technical Analysis:
• Next resistance: $3,345 – $3,350
• Nearest support: $3,335 – $3,336
• EMA 09: Price remains above EMA 09 → confirms short-term uptrend
• Momentum: RSI stays bullish, and price continues to follow breakout momentum from the recent consolidation zone
📌 Outlook:
Gold is holding its bullish structure — if it stays above $3,335, a move toward $3,345–$3,350 is likely during the Asian session.
💡 Suggested Trading Strategy
🔺 BUY XAU/USD at: 3,336 – 3,338
🎯 TP: 3,350
❌ SL: 3,330

Gold---sell near 3355, target 3330-3320Gold market analysis:
The gold buying and selling game in the past two days is quite fierce. The daily line is washed back and forth, with a combination of one Yin and one Yang. The upper and lower shadows of the daily line are relatively long. Yesterday, the daily line closed with a standard hammer candle pattern. After breaking the strong support of 3320, the price did not continue to fall, but bottomed out at 3308 and began to rise strongly, which eventually led to the short-term selling dream being shattered again. The daily line and K showed alternating conversions. The short-term trend is vague, but the long-term trend is still buying. This wave of repairs has the participation of fundamentals and the repair of gold itself. In the big cycle, it is difficult to form a daily selling trend without breaking the position of 3281. In addition, the fundamentals all support gold. I think the possibility of a deep fall in gold in the near future is very small. We are just a follower. In the short term, we focus on the intraday trend to operate. Yesterday, the daily line had a tail, and the possibility of continuing to fall today is small. Let's look at the repair rebound in the Asian session first. The first suppression position for buying rebound is around 3357. This position is also a form suppression and an indicator suppression. The other suppressions are around 3366 and 3377. Note that gold is not unilateral. When encountering great pressure, we must also consider selling opportunities. Today, I think it will rebound first and then fall back.
Support 3327 and 3320, strong support 3308, pressure 3344.3357.3366.3377, and the strength and weakness dividing line of the market is 3340.
Fundamental analysis:
There are not many fundamentals this week. The data released yesterday still suppressed gold as a whole, but the gold tail market still bottomed out and rebounded.
Operation suggestions:
Gold---sell near 3355, target 3330-3320

Gold prices are on the rise again!Market news:
In the early Asian session on Friday (July 18), spot gold fluctuated in a narrow range and is currently trading around $3,336 per ounce. London gold prices staged a thrilling "deep V" market yesterday, hitting a daily low of $3,309 during the session and recovering to 3,339 at the end of the session. Strong US retail sales and employment data drove the dollar to rebound and US Treasury yields to rise, putting pressure on interest-free assets such as gold. Despite this, geopolitical tensions and rising tariff risks are still providing bottom support for the gold market. The international gold market is currently in a multi-game of Fed policies, US economic data, US dollar trends and tariff policies. The Fed's position of postponing interest rate cuts, strong retail and employment data, and the rise in the US dollar and US Treasury yields have suppressed gold prices in the short term. This trading day needs to pay attention to the preliminary value of the University of Michigan Consumer Confidence Index in July and US real estate market data, pay attention to the G20 Finance Ministers and Central Bank Governors Meeting hosted by South Africa, and pay attention to news related to the international trade situation.
Technical Review:
Gold closed with a small positive line with a long upper shadow yesterday. Although it ended the continuous negative trend, it still faced sideways resistance below 3374, and the overall market still needs to be treated as a shock consolidation. From a large cycle perspective, gold has entered a convergent triangle consolidation phase of nearly three months. Among them, the lower track support line gradually moved up to above 3310. The support strength of this position continues to increase as the consolidation time lengthens. If the price touches or approaches this point, you can decisively try to buy the bottom layout.For two consecutive trading days, gold has been consolidating in a larger range of 3377/3310, and finally closed at the starting point of the daily Bollinger band middle track at the end of the trading day. Gold returned to the middle axis of the range at 3340. The daily chart Bollinger band middle track, the RSI indicator middle axis flattened, the four-hour chart hourly chart Bollinger band middle track, and the RSI indicator neutral middle axis. On Friday, the layout of the day will still be based on a wide range of fluctuations. Look at the 3320/3360 range first. Alternating buying and selling cycles, large range of wide fluctuations!
Today's analysis:
In the past two days, gold has always risen in the US market due to news. Last night, Trump called on the Federal Reserve to cut interest rates, and gold rose again. However, judging from the recent market, the market stimulated by the news is still unsustainable. Since gold has rebounded now, gold will continue to sell at a high level in the early trading.
Excluding yesterday's market affected by Trump, the gold price operation pattern this week is close to perfect, and it has been steadily operating under the suppression of the downward trend line. Therefore, the market has given a clear direction. It is OK to sell when the Asian market rebounds to the pressure level. Gold is still in a fluctuating downward trend in 1 hour!
The downward trend resistance of gold has moved down to around 3350. Before gold effectively breaks through 3350, gold is under pressure at 3350 and continues to sell at high prices. Today, Friday, the probability of gold having a big market is relatively high, and if there is a big market on Friday, it is basically weak throughout the day. If it is strong, it is strong throughout the day. As long as gold continues to be weak in the European market, it is likely that gold will continue to fall today.
Operation ideas:
Buy short-term gold at 3317-3320, stop loss at 3308, target at 3340-3360;
Sell short-term gold at 3352-3355, stop loss at 3364, target at 3330-3310;
Key points:
First support level: 3323, second support level: 3310, third support level: 3290
First resistance level: 3348, second resistance level: 3360, third resistance level: 3377

Gold is in danger. Could it fall?Gold started to fall slowly after the Asian market opened on Thursday, and continued to fluctuate and fall in the European market. The impact of the initial data in the US market fell sharply to around 3310, then stabilized and rose. It reached a high of around 3341 and then maintained a high sideways fluctuation, and the daily line closed with a negative line.
The price trend of gold this week was erratic. On Wednesday, it rose and fell, closing with a positive line, indicating that there was strong resistance above; on Thursday, it fell and rebounded, closing with a negative line, indicating that there was some support below. The current moving average system is chaotic, which further confirms that the overall situation is in a wide range of fluctuations.
Connecting the highs and lows of this week can form a fluctuating downward channel, which still has an important guiding role in the market. The current channel resistance is at 3345. If the gold price can break through this resistance level, it is expected to open up further upward space; and the channel support is around 3320. Once it falls below, it may trigger a new round of decline.
Overall, the upward resistance levels of gold are 3345, 3350, and 3360; the downward support levels are around 3320 and 3310. Operation strategy:
Short around 3350, stop loss at 3360, profit range 3330-3310.
Long near 3315, stop loss 3305, profit range 3330-3350.
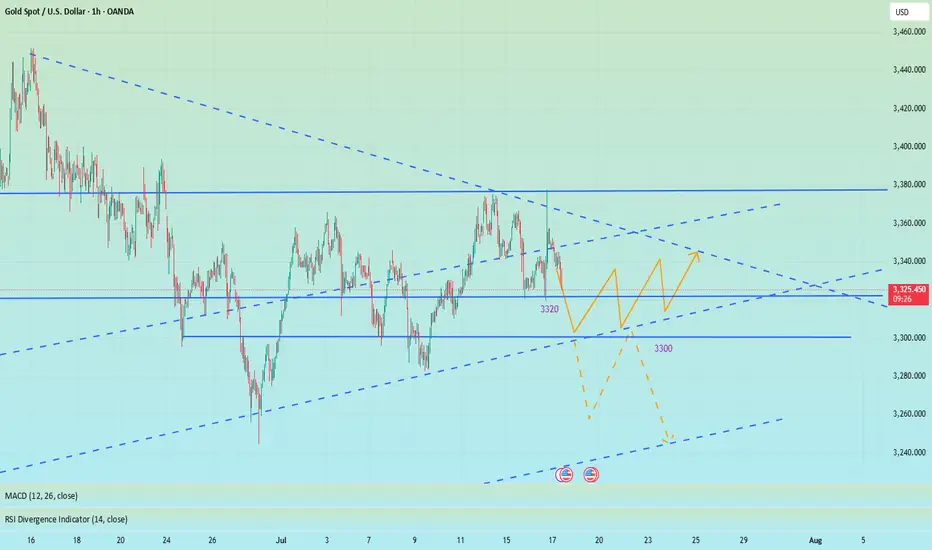
Treat it as a long-short wash-out shock, and go long on pullback📰 News information:
1. Initial jobless claims data
2. June retail data
3. Beware of Trump's remarks about firing Powell
📈 Technical Analysis:
Last night, the daily line closed at around 3347. The current short-term daily line range is 3355-3300. The short-term support below is still 3320. Once it falls below 3320, it will look to 3310-3300. Short-term trading is still volatile. If the intraday retracement reaches 3320-3310, consider going long, and the defense is 3300, with the target at 3340-3350. Under the current rhythm of long and short wash, don't chase the rise and sell the fall, look at it rationally, and brothers who trade independently must bring SL.
🎯 Trading Points:
BUY 3320-3310
TP 3340-3350
In addition to investment, life also includes poetry, distant places, and Allen. Facing the market is actually facing yourself, correcting your shortcomings, facing your mistakes, and exercising strict self-discipline. I share free trading strategies and analysis ideas every day for reference by brothers. I hope my analysis can help you.
FXOPEN:XAUUSD OANDA:XAUUSD FX:XAUUSD FOREXCOM:XAUUSD PEPPERSTONE:XAUUSD TVC:GOLD
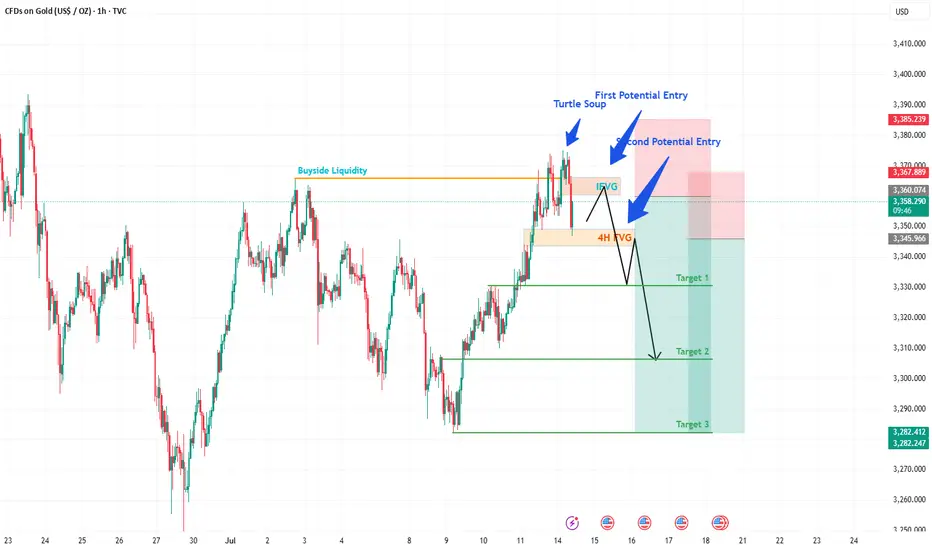
XAUUSD (GOLD) POTENTIAL SELL IDEAGold after hitting 3500 level, has kind of been ranging between 3200 and 3450 level. As we can say that Monday as start of the week has taken a Buyside Liquidity maybe making it high of the week which we will know as the market unfolds itself.
A FVG was formed on 1H before the Buyside was taken and after taking BSL, price sliced through FVG making it IFVG, we can expect Gold to give us a sell trade as it enters this IFVG which will be our first potential entry, placing SL slightly above Buyside Liquidity level.
If our first entry is successful, we can see a second entry when the price slices through the 4h FVG as marked, making it again an IFVG targeting the levels as highlighted on the chart.
FIRST POTENTIAL ENTRY:
Sell @ 3360-3365
Stop loss = 3385
Take Profit = 3335 (Target 1), 3310 (Target 2), 3390 (Target 3)
SECOND POTENTIAL ENTRY:
Sell @ 3340-3345
Stop loss = 3367
Take Profit = 3335 (Target 1), 3310 (Target 2), 3390 (Target 3)
Trump's five major factors! Will gold continue to rise?The past six months may have been dizzying, but a clear theme has emerged since U.S. President Donald Trump returned to the White House: It’s good news for the gold market.
Although gold prices broke through $3,500 an ounce nearly three months ago, setting a new record high, five key factors that have emerged since the start of Trump’s second term are likely to continue to support gold prices in the coming months. These factors may even prove that the precious metal is becoming a core asset class in investors’ portfolio strategies.
David Miller, co-founder and chief investment officer of Catalyst Funds, said that as the market enters the third quarter, gold remains a standout asset class that “provides both a hedge against the potential risks of geopolitical conflict and a break from the erosion of fiat currencies.”
The first key factor supporting gold is demand from central banks, which indicates that the market has weakened confidence in the U.S. dollar. Miller pointed out in emailed comments that central bank demand is surging, and the BRICS countries, especially China and India, are accelerating the accumulation of gold reserves “as part of a broader de-dollarization strategy.” According to a report released by the World Gold Council on Wednesday, the People’s Bank of China’s official gold holdings have climbed for eight consecutive months.
David Russell, head of global market strategy at TradeStation, said the global tariffs threatened and implemented by Trump have accelerated the "de-dollarization process." De-dollarization refers to efforts by some countries to reduce their reliance on the U.S. dollar as a reserve currency.
"Trade is becoming less dependent on the U.S. end market and less dependent on the dollar. This is more like the 19th century than the era after World War I and World War II," Russell said in emailed comments. "This trend back to the old model is creating structural demand for gold after decades of neglect. Fiat currencies are in decline," he added.
Russell also said the decline in the credit quality of developed country governments, such as the United States, is also a major concern for the market. "We have lost our AAA rating from the three major rating agencies because of growing deficits and looming pressure on unfunded liabilities such as Social Security," he said, referring in part to Moody's downgrading its top credit rating for the United States in May. "After decades of procrastination, we are running out of ways to go."
That said, trade policy is a third factor affecting gold. Russell said that "large budget deficits or increased tariffs" would reduce demand for U.S. Treasuries, supporting gold prices.
With both 2-year and 10-year Treasury yields falling so far this year and real rates under pressure from inflation, "the opportunity cost of holding gold is falling," noted Catalyst Funds' Miller. That's leading to a fourth potential support for gold -- a resurgent interest in gold exchange-traded funds and other alternatives.
In the first half of 2025, North America led the growth in global gold ETF inflows, according to the World Gold Council. Global physically-backed gold ETFs saw inflows of $38 billion in the first half of this year, marking the strongest half-year performance since the first half of 2020, according to the World Gold Council.
Finally, from a technical perspective, gold prices have held above $3,250 an ounce for much of June, Miller said. That shows signs of "a potential breakout as equity market volatility returns," he said. Gold for August delivery closed at $3,359.10 an ounce on Wednesday.
“Gold is not just a crisis hedge, it is becoming a core asset class in modern portfolio strategies.” Miller said that the current macroeconomic environment “justifies a meaningful allocation to gold and gold-related strategies.”
He said: “The combination of fragile stock market sentiment, uncertain policy direction and structural macro headwinds reinforces our view that gold is not just a crisis hedge, it is becoming a core asset class in modern portfolio strategies.” PEPPERSTONE:XAUUSD ACTIVTRADES:GOLD ICMARKETS:XAUUSD ACTIVTRADES:GOLD EIGHTCAP:XAUUSD VELOCITY:GOLD

Gold Continues Short Term Uptrend📊 Market Overview:
💬Gold is currently trading around $3,340 – $3,352/oz, down slightly (~0.25%) on the day but still consolidating near recent highs around $3,500.
🌍 Geopolitical tensions (trade wars, Middle East conflicts) and strong central bank gold purchases continue to support long-term demand.
📅Markets are awaiting key U.S. inflation data and Fed signals, which may trigger volatility in the short term.
📉 Technical Analysis:
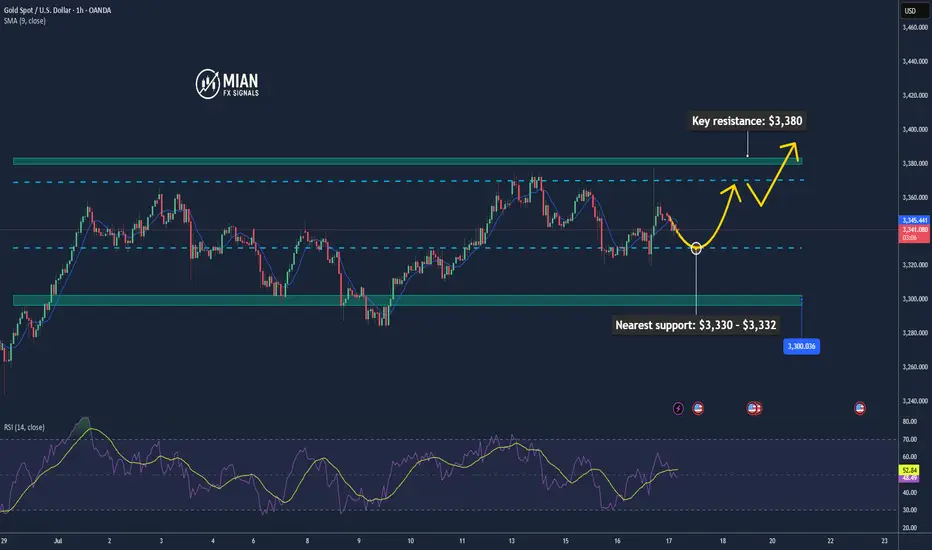
🔺Key resistance: $3,360 – $3,380, with the psychological zone at $3,400–$3,420.
🔻Nearest support: $3,330 – $3,332, followed by a firmer zone at $3,300–$3,326 (based on Fibonacci and moving averages).
• EMA/MA:
✅ Price is trading above the 50-day MA ($2,862), confirming a medium-term uptrend.
⚠️ While no specific EMA 09 data is noted, current price action suggests bullish momentum.
• Momentum / Candlestick / Volume:
📏RSI (14) is near 50–55, signaling positive momentum without being overbought.
🔄MACD is slightly negative but the overall structure remains bullish.
📌 Outlook:
Gold may continue to rise in the short term if it holds above the $3,330–$3,332 support zone, with potential to test resistance at $3,360–$3,380 and possibly revisit the $3,400 level.
A break below $3,330 could open the path toward deeper support around $3,300.
💡 Suggested Trading Strategy:
SELL XAU/USD: 3,367–3,370
🎯 TP: 40/80/200 pips
❌ SL: 3,374
BUY XAU/USD: 3,330–3,333
🎯 TP: 40/80/200 pips
❌ SL: 3,326
Gold pullback bulls are a winning streak strategy
💡Message Strategy
Gold prices experienced a roller coaster ride on Wednesday, mainly due to a Bloomberg report that Trump was considering firing Federal Reserve Chairman Powell (Trump wants to cut interest rates as soon as possible and the Fed is cautious). This quickly ignited the market's risk aversion sentiment, pushing gold prices up quickly by $50. However, after the rise, gold soon encountered resistance and gave up nearly $40 in gains, as Trump quickly denied the plan and the market's risk aversion sentiment cooled.
Gold prices fluctuated and fell on Thursday as Trump denied plans to fire Powell. Due to the rise in US CPI data released earlier, investors' expectations for the Fed's interest rate cuts cooled, which began to affect the market again. Looking ahead, investors still need to pay attention to the impact of Trump's tariff remarks and the Fed's monetary policy outlook on gold prices.
📊Technical aspects
After hitting a three-week high, gold prices fell back and continued to fluctuate in a wide range.
Gold is still in a bullish pattern. The support below focuses on Tuesday's low of $3,320, which is near the position where gold prices stabilized and rose in the Asian and European sessions on Wednesday, and near the position where gold prices fell and stabilized and rose in the US session on Wednesday. This is also the core position of our trading this week.
Gold's upper pressure focuses on the downward breakthrough of gold prices in the Asian and European sessions at $3,345, which is also the low point where gold prices quickly fell after rising on Wednesday. Secondly, focus on the intraday high of $3,375. The 5-day moving average slowed down after a slight golden cross, the MACD indicator slightly crossed upward, and the KDJ and RSI indicators formed a dead cross. The short-term technical aspect suggests that gold prices have a short-term upward trend.
💰Strategy Package
Long Position:3300-3315,SL:3280,Target: 3360-3370
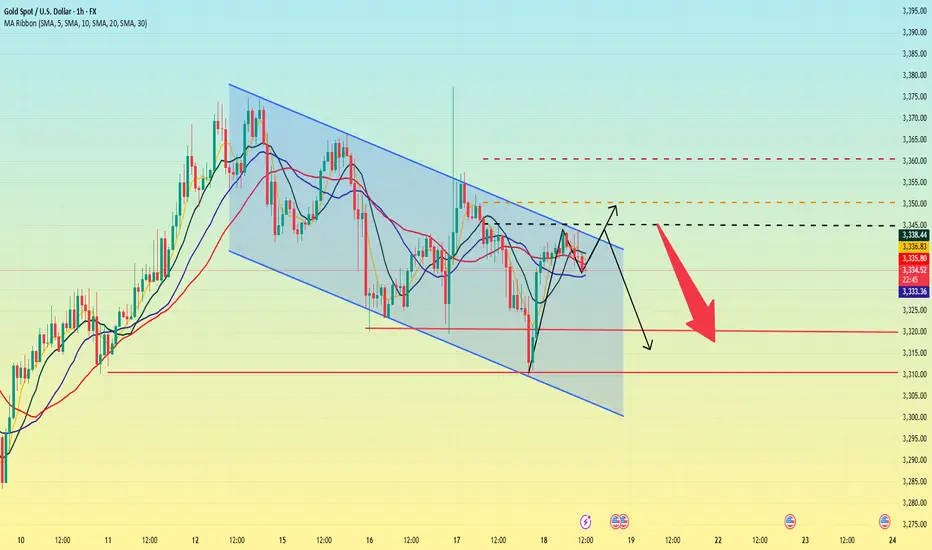
XAU/USD) bearish Trend Read The captionSMC trading point update
Technical analysis of XAU/USD (Gold Spot vs US Dollar) on the 1-hour timeframe. Here's a breakdown
---
Technical Breakdown:
1. Descending Channel:
Price is trading within a clearly defined downward-sloping channel (black trendlines).
This suggests a short-term bearish trend.
2. Resistance Zone (Yellow Box at 3,335–3,340):
Price recently rejected from this resistance area.
This zone aligns with both the 200 EMA and previous structure, strengthening its validity.
3. EMA Confluence:
The 200 EMA (3,336.798) is acting as dynamic resistance.
Price is currently below the EMA, confirming the bearish bias.
4. Support/Target Zone:
The projected target zone is around 3,313.266, labeled as a support level.
This level has acted as previous structure support, increasing its significance.
5. RSI Analysis:
RSI is at 37.18, close to the oversold region, but not yet fully exhausted.
Suggests there’s still room for a downside move before any potential bounce.
Mr SMC Trading point
---
Trade Idea Summary:
Bias: Bearish
Entry: Below the resistance zone (~3,335–3,340)
Target: 3,313 (support zone)
Invalidation: Break and hold above 3,340–3,345
Risk Note: Watch for potential consolidation or fakeouts before continuation.
Please support boost 🚀 this analysis)

Gold market price trend analysis and operation strategyGold trend analysis:
Gold reached a high of 3366 yesterday, a low of 3320, and closed at around 3325. From the daily chart, the performance of the daily cycle is high and closed negative, and it may not be able to go out of the big rise in the short term. Gold will fall into range fluctuations. The rise of gold in this cycle has not actually been completed. At least it needs to go to the high point of 3400, and then look at the adjustment space within the week, but don’t look too much at the strength of the rise. The general trend is bullish, and we must also beware of the adjustment space that may fall back at any time. Gold tried 3375 several times yesterday and failed to break through, and then fell back for adjustment, indicating that the pressure on 3375 is obvious, that is, gold needs to fall back and correct in the short term. At this time, we are cautious about chasing more and continue to buy more after falling back.
From the 4-hour chart, gold rose and fell yesterday, and the bearish trend did not continue. Gold entered a period of adjustment. From the current K-line, the downward momentum of gold is slowing down, and it tends to rebound in the short term. In the 4-hour chart, the lower track support of the Bollinger Band is near 3320, and the position of the middle track of the Bollinger Band is near 3345, which will form a short-term resistance. From the 1-hour chart, after yesterday's drop to 3320, it was strongly supported again and pulled up to above 3330. The support below is still strong. If the European session rises and breaks through 3350 today, the US session may go to the resistance of 3365-3375. Before breaking through 3350, the current market can only be regarded as a bottom adjustment and correction. Today, we will first focus on the rebound strength. If the upward momentum weakens, pay attention to the support of 3310-3300 below, and wait for the decline to be mainly low-multiple. In the short term, we will first focus on the breakthrough of the shock range. The intraday idea is to fall back to low-multiple. FX:XAUUSD ACTIVTRADES:GOLD OANDA:XAUUSD TVC:GOLD EIGHTCAP:XAUUSD ACTIVTRADES:GOLD