Gold fluctuated downward. Stuck in a stalemate.Information summary:
Global investors have experienced the longest night this year. There are reports that Trump has drafted a letter to fire Federal Reserve Chairman Powell. The incident triggered a strong reaction in the financial market. An hour later, Trump came out to clarify that "there is no plan to take any action" and denied drafting a letter to fire Powell.
Due to the impact of the incident, gold experienced a roller coaster market, soaring more than $50 at one time, hitting a three-week high of $3,377.17, and then narrowed its gains to 0.68%, and finally closed at $3,347.38. In today's Asian market, gold fell slightly and is currently hovering around $3,325.
Market analysis:
The current volatility pattern has not changed. In the short term, the market shows signs of weakness, which is also affected by CPI data, and expectations for interest rate cuts have weakened. In the current state where there is no break in the pattern, waiting and watching is still the best strategy.
The first support level is around 3,310, which is the starting point of last week's high. The second is around 3280, which is the historical low since July and also the starting point of the rise in the first week of July.
Goldprice
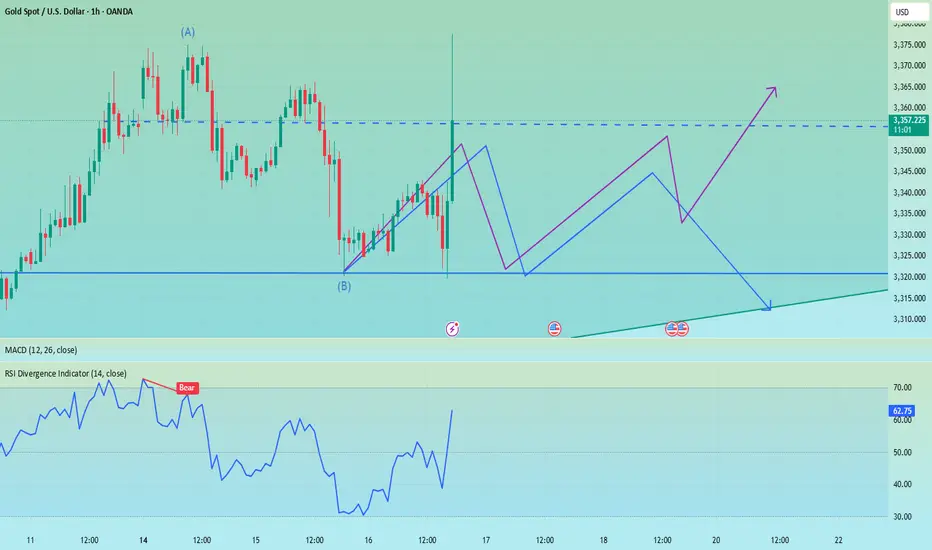
XUA/USD) Bearish Analysis Read The captionSMC trading point update
Technical analysis of XAU/USD (Gold vs USD) on the 1-hour timeframe. Here's a breakdown
Technical Analysis Summary
1. Descending Channel:
The price is moving within a clear descending channel, indicating a bearish market structure.
Recent price action rejected the upper boundary of the channel, strengthening the downtrend bias.
2. Resistance Rejection:
A key resistance level around 3,340–3,345 was retested (marked with a red arrow) and rejected.
Price has already shown early bearish candles post-rejection, suggesting weakness at that level.
3. 200 EMA (Exponential Moving Average):
Price is currently hovering around the 200 EMA, and a clean break below it could accelerate the bearish move.
4. RSI Indicator:
RSI is around 46, below neutral 50, showing bearish momentum is building but not yet oversold.
No divergence is present, supporting the idea of continuation.
---
Bearish Playbook
Entry Idea: After the rejection at the resistance zone and confirmation of lower highs.
Target: 3,313 – 3,310 zone (marked as the “key support level” and “target point”).
Risk Management: A stop loss above 3,345 (above the resistance zone) would be a prudent protection level.
---
Confluences Supporting the Short Setup:
Rejection at horizontal resistance.
Alignment with the descending trendline/channel.
Price trading near or below the 200 EMA.
RSI slightly bearish.
Caution:
Watch out for any macroeconomic news or high-impact events (highlighted with the economic event icons) that could inject volatility.
A strong break back above the resistance could invalidate this bearish setup.
Mr SMC Trading point
Conclusion:
This setup anticipates a bearish continuation targeting the 3,310 support zone. Ideal for short-term traders looking for downside opportunities, provided price respects the trend and fails to reclaim the resistance.
Please support boost 🚀 this analysis)

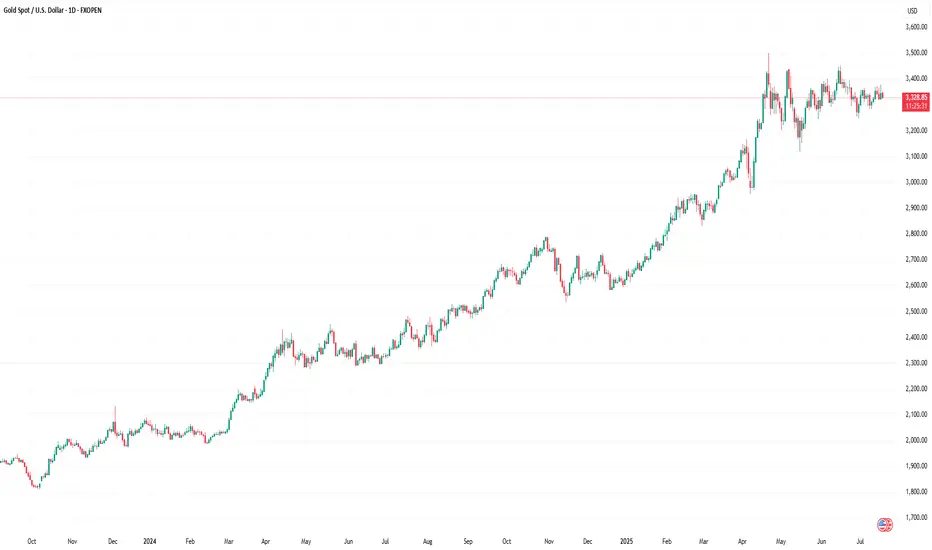
XAU/USD Chart Analysis: Volatility at a Yearly LowXAU/USD Chart Analysis: Volatility at a Yearly Low
The daily chart of XAU/USD shows that the Average Directional Index (ADX) has reached its lowest level since the beginning of 2025, indicating a significant decline in gold price volatility.
Yesterday’s release of the US Producer Price Index (PPI) initially triggered a sharp spike in gold prices, but the gains were short-lived, with the price quickly reverting to previous levels. This price action aligns with a broader market narrative of equilibrium—where supply and demand are in relative balance, and the market appears to be efficiently pricing in key influencing factors, including geopolitical tensions and tariff-related developments.
However, this fragile balance may soon be disrupted.
Technical Analysis of XAU/USD
From a broader technical perspective, gold remains within a long-term ascending channel (highlighted in blue) in 2025. Key observations include:
→ Attempts to rebound from the lower boundary of the channel (marked with arrows) lack conviction. Bulls are not capitalising on these opportunities to reignite the uptrend, suggesting a potential exhaustion of buying interest.
→ A trendline drawn across the major highs of 2025 has proven to be a strong resistance level. All recent breakout attempts have failed at this barrier.
As a result, the XAU/USD chart is showing signs of forming a large-scale triangle pattern, with its axis centred around the $3,333 level. If bulls continue to falter in extending the multi-month rally, it could encourage bears to challenge the lower boundary of the ascending channel, increasing the risk of a downside breakout.
This article represents the opinion of the Companies operating under the FXOpen brand only. It is not to be construed as an offer, solicitation, or recommendation with respect to products and services provided by the Companies operating under the FXOpen brand, nor is it to be considered financial advice.
The firing of Powell set off the market, don't chase the longsTrump showed a draft of the letter to fire Powell, but whether Powell will be fired in the end remains to be seen, but the impact on the gold market is undoubtedly huge. The wolves have now smelled a very dangerous scent. Don’t chase high prices. Don’t chase high prices! ! ! After all, the impact of the news comes and goes quickly, and there is a high possibility of a reversal later in the evening. The final suppression position of the current gold daily line is 3340. If the closing line today can maintain above 3340, then gold will usher in a real bullish trend in the future.
OANDA:XAUUSD
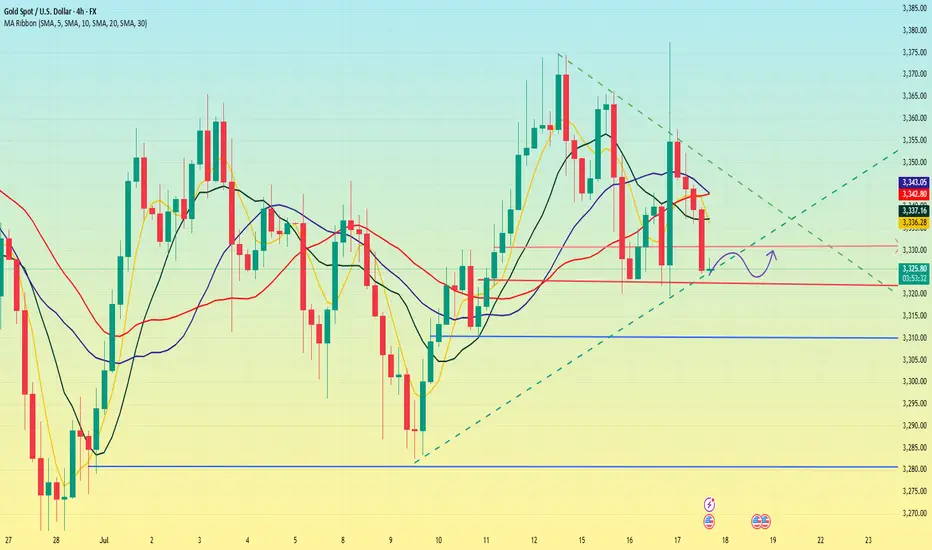
Gold----Sell near 3357, target 3330---3320Gold market analysis:
Yesterday's gold daily Asian session was still a normal shock drop. We sold at 3340 and 3341 twice to 3322 to make all profits. 3320 is the previous low point and the moving average support position. This position is also a strong support today. Yesterday, the Trump and Powell incidents made gold strongly rise to around 3377. In addition, the Middle East bully bombed Syria again, which is also the main reason for the surge in gold. However, the fundamentals are only short-lived. In the end, the gold daily line closed positive, but closed with a super long upper shadow line. Selling is still not dead. Today's gold buying and selling have opportunities, and the possibility of a direct decline is small. I estimate that the Asian session will be repaired, and our ideas for buying and selling in the Asian session can be intercepted. If it breaks 3320, consider chasing and selling again, which means that selling has started again.
The highest rebound in the Asian session was around 3352, and the highest position in 1 hour was around 3357. Today's small suppression in the white session is 3357. The following support focuses on two positions, one is 3320, and the other is 3330. I estimate that the fluctuation range of the Asian session is 3320-3357. Let's observe and wait for the position in the Asian session.
Pressure 3352 and 3357, strong pressure 3366, support 3320 and 3330, and the watershed of strength and weakness in the market is 3350.
Fundamental analysis:
Trump's dissatisfaction with Powell has not been a day or two, and the conflict is inevitable. The impact on gold is also short-term. Yesterday's pull-up and dive is a case in point.
Operation suggestion:
Gold----Sell near 3357, target 3330---3320

Powell's stay or departure affects the market, and gold is unlik
Yesterday, the Trump and Powell incident caused gold to rise strongly to around 3377. The rise of gold was just a moment. In the end, the gold daily line closed positive, but closed with a super long upper shadow line. In the end, the gold price quickly rose and broke through the 3377 mark, and then fell under pressure and fell into a shock closing. The daily K line closed high and fell back and fluctuated in the middle of the positive. Although the overall gold price repeatedly fluctuated and washed the market under the stimulation of the news, it ultimately failed to break through the recent large box shock range. Today we continue to pay attention to the support line of 3318-25 below. We will continue to go long if it falls back!
From the 4-hour analysis, today's short-term support below continues to focus on the vicinity of 3318-25, the short-term pressure above focuses on the 3340-45 line, and the key pressure above focuses on the 3380 line. The overall support range still maintains the main tone of high-altitude low-multiple cycle participation. In the middle position, watch more and do less, and follow orders cautiously, and wait patiently for key points to enter the market.
Gold operation strategy:
Gold falls back to the 3318-25 line and goes long, stop loss 3312, target 3340-45 line, and continues to hold if it breaks;

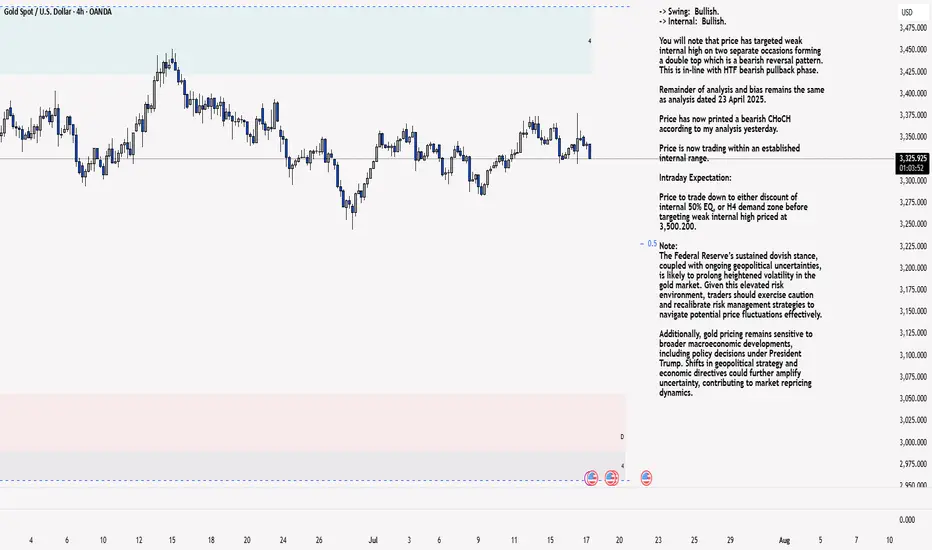
XAU/USD 17 July 2025 Intraday AnalysisH4 Analysis:
-> Swing: Bullish.
-> Internal: Bullish.
You will note that price has targeted weak internal high on two separate occasions forming a double top which is a bearish reversal pattern. This is in-line with HTF bearish pullback phase.
Remainder of analysis and bias remains the same as analysis dated 23 April 2025.
Price has now printed a bearish CHoCH according to my analysis yesterday.
Price is now trading within an established internal range.
Intraday Expectation:
Price to trade down to either discount of internal 50% EQ, or H4 demand zone before targeting weak internal high priced at 3,500.200.
Note:
The Federal Reserve’s sustained dovish stance, coupled with ongoing geopolitical uncertainties, is likely to prolong heightened volatility in the gold market. Given this elevated risk environment, traders should exercise caution and recalibrate risk management strategies to navigate potential price fluctuations effectively.
Additionally, gold pricing remains sensitive to broader macroeconomic developments, including policy decisions under President Trump. Shifts in geopolitical strategy and economic directives could further amplify uncertainty, contributing to market repricing dynamics.
H4 Chart:
M15 Analysis:
-> Swing: Bullish.
-> Internal: Bullish.
H4 Timeframe - Price has failed to target weak internal high, therefore, it would not be unrealistic if price printed a bearish iBOS.
The remainder of my analysis shall remain the same as analysis dated 13 June 2025, apart from target price.
As per my analysis dated 22 May 2025 whereby I mentioned price can be seen to be reacting at discount of 50% EQ on H4 timeframe, therefore, it is a viable alternative that price could potentially print a bullish iBOS on M15 timeframe despite internal structure being bearish.
Price has printed a bullish iBOS followed by a bearish CHoCH, which indicates, but does not confirm, bearish pullback phase initiation. I will however continue to monitor, with respect to depth of pullback.
Intraday Expectation:
Price to continue bearish, react at either M15 supply zone, or discount of 50% internal EQ before targeting weak internal high priced at 3,451.375.
Note:
Gold remains highly volatile amid the Federal Reserve's continued dovish stance, persistent and escalating geopolitical uncertainties. Traders should implement robust risk management strategies and remain vigilant, as price swings may become more pronounced in this elevated volatility environment.
Additionally, President Trump’s recent tariff announcements are expected to further amplify market turbulence, potentially triggering sharp price fluctuations and whipsaws.
M15 Chart:
XAUUSD Trade Setup: Buying Opportunity at 3,322 Support ZoneGold (XAUUSD) is currently testing a critical support zone between 3,322 and 3,323 USD. This area represents a confluence of the previous swing low and the 0.618 Fibonacci retracement level, which is historically known to trigger technical bullish reactions. If a confirming signal appears on the H1 chart, this may offer a favorable short-term buy opportunity.
Trade setup details:
Entry (Buy limit): 3,323 – 3,322 USD
Stop loss: below 3,318 USD
Take profit: 3,331 – 3,340 USD
Risk-to-reward ratio: approximately 2:1
Technical rationale for the trade:
The 3,322 level has acted as a strong support in recent price structure
Aligns with the 0.618 Fibonacci retracement, often seen as the last line of defense in bullish setups
RSI on the lower time frame is nearing oversold, signaling potential bullish momentum
Risk management notes:
If price closes below 3,318 USD, the long idea becomes invalid
Best entries should be supported by price action signals such as pin bar, bullish engulfing, or other reversal candles near support
Conclusion: A buy position in the 3,322 – 3,323 USD zone presents a reasonable strategy as long as the support holds. If bullish reaction occurs, price may revisit the 3,340 resistance area in the short term.
Save this strategy if you find it useful, and stay tuned for more real-time trade ideas and insights.

Gold Just Flipped Is the Drop Coming?🚨 Gold Market Update – Are You Ready? 🚨
Yesterday, the gold market swept the liquidity from the previous days taking out stop orders and clearing out weak positions. After the sweep, price closed lower, showing clear signs of weakness. 📉
But that’s not all...
In the process, it also broke through a key bullish Fair Value Gap (FVG) an area where buyers had previously shown strength. That FVG is now inverted, meaning it could act as a strong resistance level going forward.
With this shift in structure, there's a real possibility that gold could drop further, potentially hunting the liquidity resting near previous lows. The market might be gearing up for a deeper move.
🔥 So the question is:
Are YOU ready for the next leg down?
📌 As always Do Your Own Research (DYOR)
This is not financial advice just reading the tape.

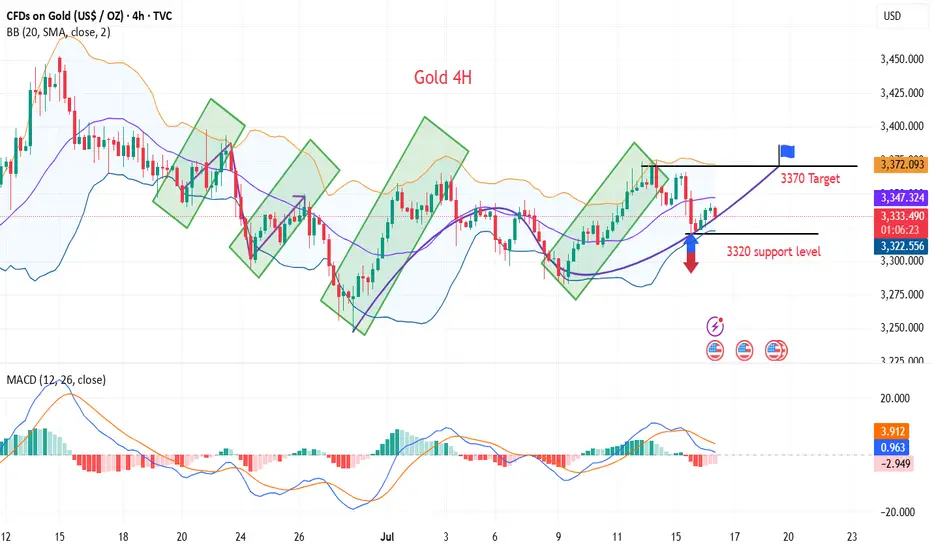
Gold price fluctuates! Gold operation guide!Market news:
In the early Asian session on Thursday (July 17), spot gold fluctuated in a narrow range and is currently trading around $3,341 per ounce. Rumors that Trump plans to fire Federal Reserve Chairman Powell caused violent market fluctuations. The US dollar once plummeted, and then narrowed the decline; while the London gold price gave up most of its gains after soaring. If Powell is fired in advance, it may be unfavorable to the US dollar, because it will shake the outside world's confidence in the US financial system and the safe-haven status of the US dollar.
Trump's repeated statements have caused the international gold price to experience violent fluctuations in a short period of time. The market's concerns about the independence of the Federal Reserve have become an important driving force for the rise in gold prices. However, geopolitical tensions still support gold prices. Israel launched an airstrike on Damascus, Syria on Wednesday, destroying the Ministry of Defense building, which is very close to the Syrian presidential palace. Trump's trade policy has further injected uncertainty into the gold market.
Technical Review:
The news that Trump's big mouth "considered replacing Federal Reserve Chairman Powell" caused violent fluctuations in the financial market. Although the storm subsided after Trump's denial, Wall Street has sounded the alarm. Rumors that Trump will fire Powell caused market volatility, and the US dollar index plunged and closed down 0.36% during the session. Spot gold was on a roller coaster ride, rising sharply from 3320 to 3377 in the late trading, then plunged back to 3336 and then rose again to 3357 before closing sideways around the 3350 mark.Technical daily chart structure alternates between positive and negative cycles to maintain the adjustment of the Bollinger band middle track, the indicator is neutral, the Bollinger band closes, and the RSI indicator is flat. The four-hour chart and hourly chart indicators are neutral. Affected by market news, the gold price alternates between long and short cycles and fluctuates widely, the moving average is glued, the RSI indicator middle axis is flat, and the Bollinger band is flat and closed. Gold maintains a wide range of fluctuations, selling at high prices and buying at low prices.
Today's analysis:
The gold market last night was quite exciting. In the middle of the night, Trump claimed that he would fire Powell. After the news came out, gold soared by more than 50 US dollars in a short period of time, but the market was only controlled by emotions in a short period of time. After all, the chairman of the Federal Reserve is independent, and Trump cannot have the right to fire Powell. Once the emotions passed, although gold fell sharply, it also pushed up the trend of gold prices to a certain extent! At present, after the strong rise of gold in 1 hour, it quickly fell back and closed with a long upper shadow line. The change in gold buying did not successfully stabilize. Then this market is actually a kind of catharsis of the news. The confidence of gold buying in directly rising again is not very sufficient. The gold 1-hour moving average is still in the form of dead cross selling. So gold rebounds or continues to sell.The gold 1-hour pattern excludes the influence of the upper shadow line stimulated by yesterday's news. In fact, the whole rhythm is still fluctuating and falling. The upper shadow time is not long, and it is probably just a temptation to buy. After the ups and downs of gold last night, it rebounded again to the 3360 line or continued to fall under pressure. So gold continued to rebound under pressure and continued to sell at high prices below 3360.
Operation ideas:
Buy short-term gold at 3325-3328, stop loss at 3317, target at 3350-3370;
Sell short-term gold at 3357-3360, stop loss at 3368, target at 3340-3320;
Key points:
First support level: 3330, second support level: 3319, third support level: 3303
First resistance level: 3358, second resistance level: 3370, third resistance level: 3386

XAU/USD(20250717) Today's AnalysisMarket news:
The annual rate of PPI in the United States in June was 2.3%, lower than the expected 2.5%, the lowest since September 2024, and the previous value was revised up from 2.6% to 2.7%. Federal Reserve Beige Book: The economic outlook is neutral to slightly pessimistic. Manufacturing activity declined slightly, and corporate recruitment remained cautious.
Technical analysis:
Today's buying and selling boundaries:
3348.05
Support and resistance levels:
3405
3383
3369
3326
3312
3290
Trading strategy:
If the rise breaks through 3348, consider entering the market to buy, the first target price is 3369
If the fall breaks through 3326, consider entering the market to sell, the first target price is 3312

TACO trading reappears. Gold is down.The news that Trump intends to fire Powell caused a decline in US stocks and bonds, and gold prices soared in response. But then Trump denied the news, and the market subsequently fell back to stabilize.
On Wednesday, the Asian market began to fluctuate and rise in the early trading. It rose to a high of 3343 in the European market and then fell to 3319 in the US market. Then it rose sharply due to the news. It rose to a high of 3377 and then fell to 3336. It fluctuated around 3350 in the late trading. The daily line closed with a positive line with an upper shadow line.
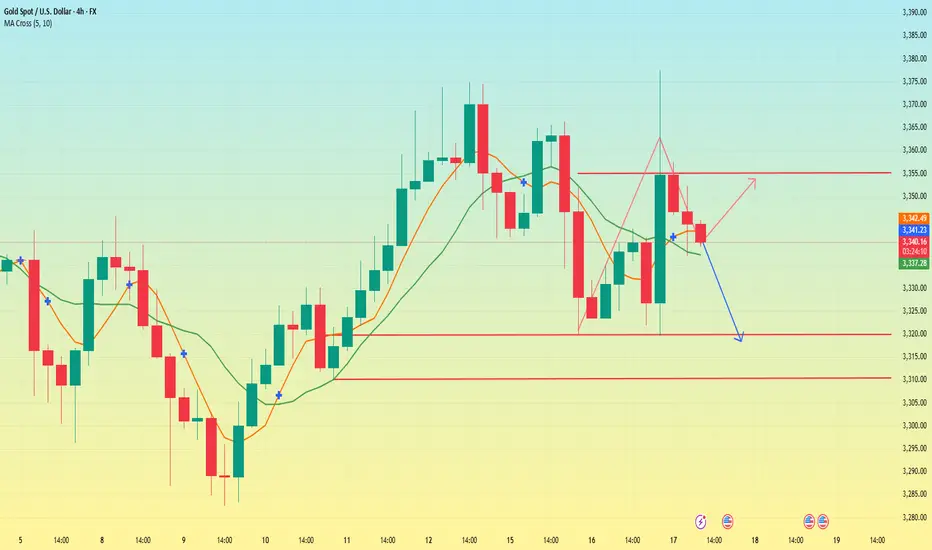
The recent market trend fluctuated violently. Since last Wednesday, there have been three consecutive positive rises. This week, there have been two consecutive negative declines on Monday and Tuesday. On Wednesday, it closed positive after washing up and down. At present, the MA5 and 10-day moving averages have formed a golden cross, but the direction is unclear. The Asian market opened above the moving average on Thursday. The overall pattern needs to pay attention to the breakthrough of the key points of long and short positions.
Today, the focus below is on the support near the low point of 3320, followed by the support near 3315 and 3310. This position is the trend line support formed by the previous low point connection. If it breaks down, we need to pay attention to the position of 3280. The upper resistance level is mainly concerned with the resistance near 3355, which is the rebound high point after the US market hit 3377.
Today, the operation needs to adjust the strategy according to the breakthrough of key points. In the volatile market, we need to be vigilant about the sudden fluctuations caused by the news. After breaking the key support or resistance, the trend direction may be further clarified.
Fake news stirs up the market, market trend analysis📰 News information:
1. Beige Book of Federal Reserve's economic situation
2. European and American tariff trade negotiations
📈 Technical Analysis:
Today, our overall trading can be said to have accurately grasped the trading points, and both long and short positions have earned us good profits.The gold market surged due to Trump's intention to fire Powell. Trump then denied the plan, which dissipated the risk aversion in the gold market and the overall rhythm fell back to a volatile pattern. The current market price of gold closed with a long upper shadow line, indicating that there is a certain need for adjustment in the market. Although the news stimulus has pushed it up to 3377, we need to be vigilant against the risk of a decline after a high rise. Pay attention to today's closing. If it closes below 3345, the bearish trend may continue in the future.
OANDA:XAUUSD PEPPERSTONE:XAUUSD FOREXCOM:XAUUSD FX:XAUUSD OANDA:XAUUSD FXOPEN:XAUUSD

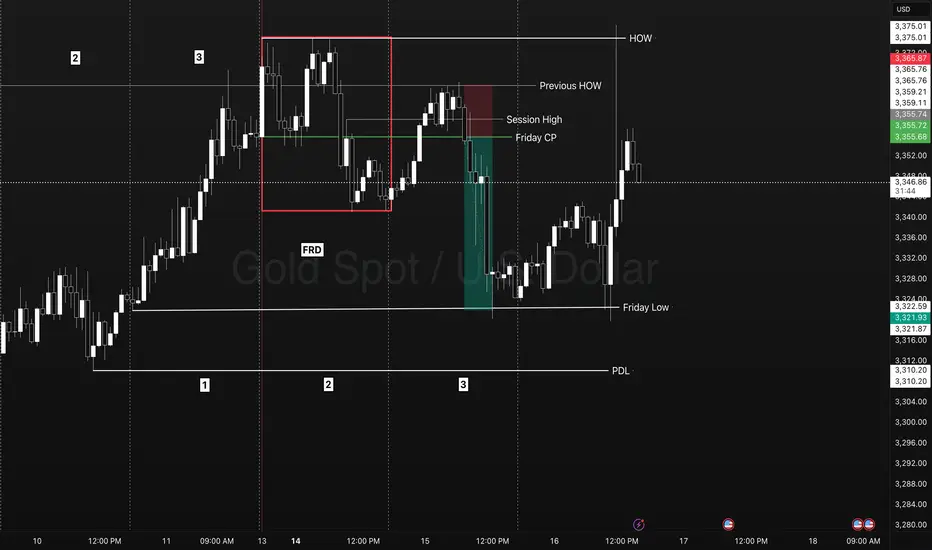
XAUSD - Using HOW levels for a break and retest!Identify what signal a market is showing you.
TYPES IOF SIGNAL DAYS
- First red/green day
- Dump/Pump
- Inside day
Frame the Trade play
- Reversal
- Continuation
Identify the Levels
- HOW/LOW
- Session High/LOW
- Friday Closing Price.
Trade Explanation
On the previous week FOREXCOM:XAUUSD triggered 3 days of breakout traders into the market closing in breakout. On Monday we have a FRD signal that sets up a next day trade opportunity. A retest of a previous weeks high gave us an indication of a retest/reversal trade on day 3 below Fridays closing price. Into the NY session this market quickly displaced back to Friday day 1 LOD level. Going into Tuesday day 2 we had the test of a weekly level and reversal above a session high closing below the Friday closing price. The break of a previous weeks high triggered more breakout traders into the market however it failed. We know day 2 typicall expands the range on Monday for a great parabolic trade setup right to as previous days low.
NO GUESSING, NO FOMO, NO FEAR, NO STRESS!
- Friday Closing Price (Entry)
- Previous HOW (Stop)
- PDL (Target)
Falling correction, shorting in European session📰 News information:
1. Beige Book of Federal Reserve's economic situation
2. European and American tariff trade negotiations
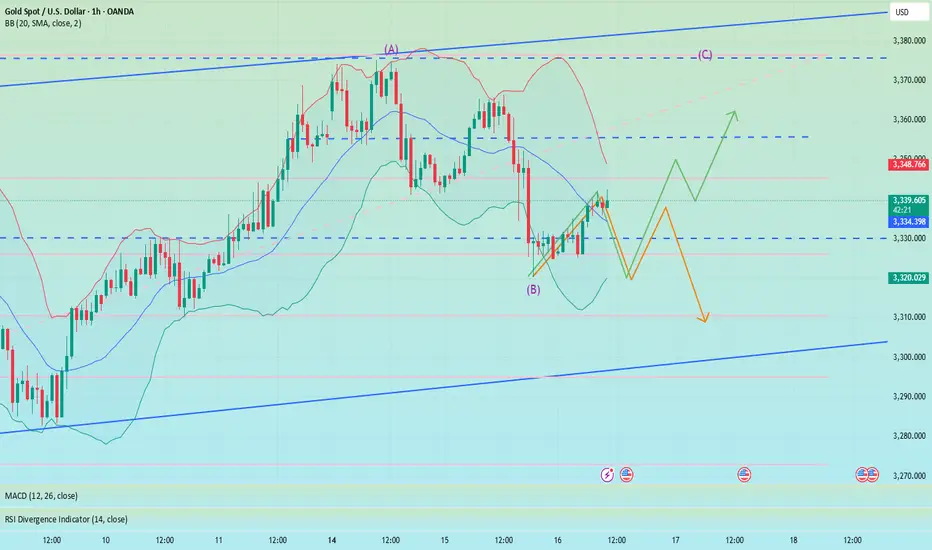
📈 Technical Analysis:
Currently, gold continues to consolidate around 3340, and the daily MACD indicator is stuck to the zero axis. Two consecutive days of negative bars also indicate that the overall trend of gold is weak and volatile. The hourly Bollinger Bands are closing, with the upper band located near 3352. The corresponding positions of the upper pressure middle band and SMA60 are basically at 3335-3350, but it is expected to gradually decline over time. On the whole, there are no particularly clear trading signals at present. Both bulls and bears have certain opportunities. It is recommended to wait and see for the time being. Pay attention to the 3342-3352 area above. If the bearish trend is confirmed in the future, you can consider shorting when it rebounds here, with the target at 3330-3325. If gold retreats directly to 3325-3320 and gains effective support again, you can consider going long.
🎯 Trading Points:
SELL 3342-3352
TP 3330-3325
BUY 3325-3320
TP 3340-3350
In addition to investment, life also includes poetry, distant places, and Allen. Facing the market is actually facing yourself, correcting your shortcomings, facing your mistakes, and exercising strict self-discipline. I share free trading strategies and analysis ideas every day for reference by brothers. I hope my analysis can help you.
FXOPEN:XAUUSD TVC:GOLD FX:XAUUSD FOREXCOM:XAUUSD PEPPERSTONE:XAUUSD OANDA:XAUUSD
Pay attention to 3320, if it falls below, go long at 3310-3300The short order has been completed and profit has been realized. Now the 1H technical indicators show that there is still room for decline in the short term. Focus on the 3320 support. If it falls below 3320, the gold price is expected to reach the 3310-3300 area, which is also an ideal trading area for intraday long positions. There is nothing much to say. Follow the wolves and you will get meat. Currently, the brothers who follow me to trade have all made good gains.
OANDA:XAUUSD
Gold Holds Key Support Zone📊 Market Summary
– Gold is currently trading at $3,338/oz, hovering near a key technical support level.
– US Treasury yields remain elevated and the USD is strong, both pressuring gold; however, ongoing concerns over US–EU/Mexico trade tensions continue to support safe-haven demand.
– The market is awaiting the upcoming US PPI data to determine the next directional move.
📉 Technical Analysis
• Key Resistance: $3,372 – $3,375 (23.6% Fibonacci zone – short-term ceiling)
• Nearest Support: $3,338 – $3,330 (tested and bounced at 3,338 per Oanda); deeper support at $3,325 – $3,320 if broken
• EMA 9: Price is below the MA20/50/100 but above MA200 (H1); EMA9 is flat, suggesting a sideways/consolidation trend
• Momentum / Indicators:
• RSI around 44–52 – neutral to slightly bullish
• MACD slightly positive; Stochastic above 50, hinting at short-term overbought conditions
📌 Outlook
– Gold is holding above the 3,338–3,330 support zone. If this level holds and rate-cut expectations strengthen, the price may rebound toward 3,372–3,375.
– However, if the USD continues to strengthen and PPI/CPI data surprises to the upside, gold could break support and head lower toward 3,325–3,320.
💡 Trade Strategy Proposal
🟣 SELL XAU/USD at 3,372 – 3,375
🎯 TP: ~ 40 / 80 / 200 pips
❌ SL: ~ 3,378
🟢 BUY XAU/USD at 3,330 – 3,333
🎯 TP: ~ 40 / 80 / 200 pips
❌ SL: ~ 3,327

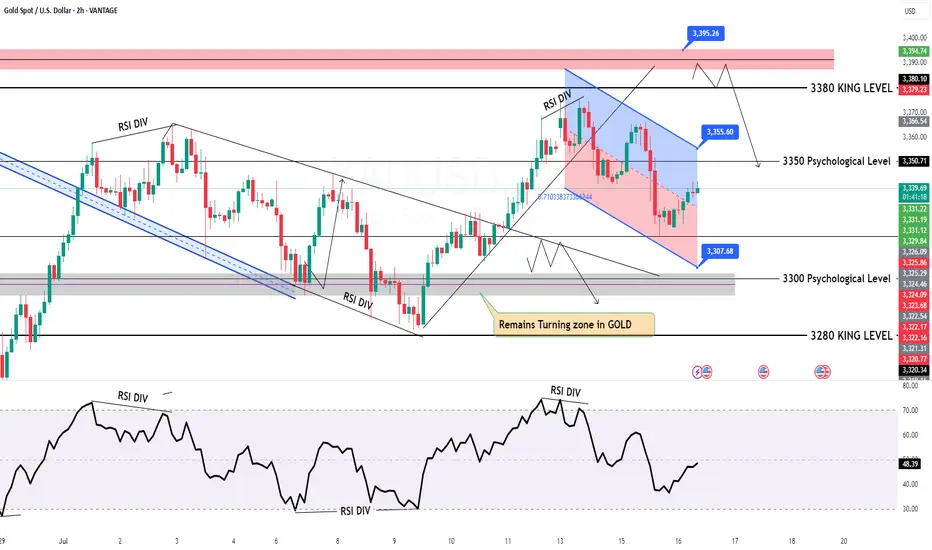
As risk aversion wavers, will gold rise or fall?
💡Message Strategy
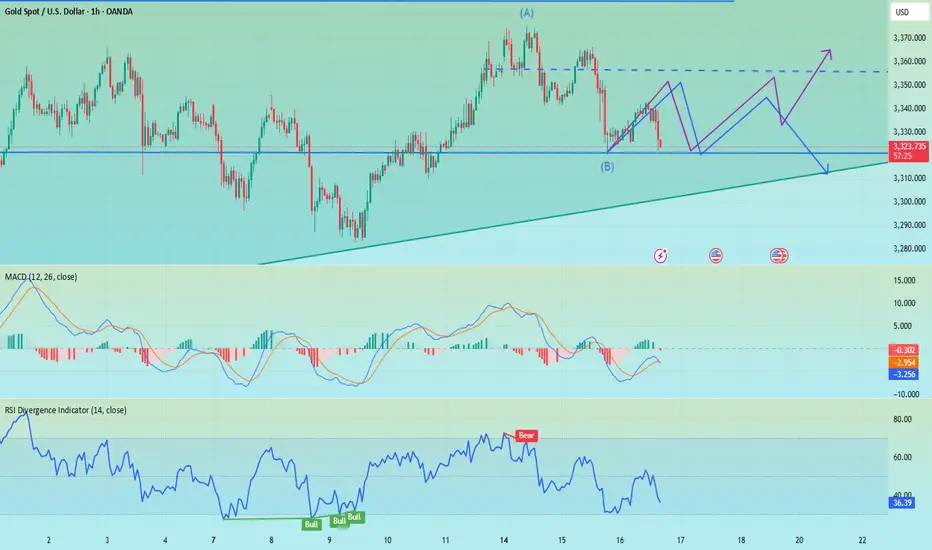
After falling for two consecutive days, gold (XAU/USD) rebounded slightly in the Asian session on Wednesday, stabilizing above $3,320, attracting some bargain-hunting buyers. The market has paid close attention to the tariff policy that US President Trump continues to increase, and the rising risk aversion has become the core factor supporting gold prices.
The US CPI data for June showed that overall prices rose by 0.3% month-on-month, the largest increase in five months, and the core CPI rose to 2.9% year-on-year, both higher than expected. This has caused the market to worry that tariffs are gradually pushing up inflation, prompting the Federal Reserve to extend the high interest rate policy cycle.
📊Technical aspects
The current trend of gold is constrained by both fundamentals and technical factors.
On the one hand, Trump's tariff policy has pushed up inflation expectations, triggering risk aversion and rethinking of the Fed's policy path, providing support for gold;
On the other hand, the Fed's tone of "maintaining high interest rates for longer" has limited the room for gold prices to rebound.
From the 4-hour chart, gold prices found support near the 100-period SMA (about $3,320) on Tuesday, stopping the decline from the three-week high. In the short term, if it can stand above the 3340-3345 resistance band, it may test the 3365-3370 area again, and the further target is the 3400-dollar round mark.
💰Strategy Package
Long Position:3320-3330,SL:3305,Target: 3365-3370
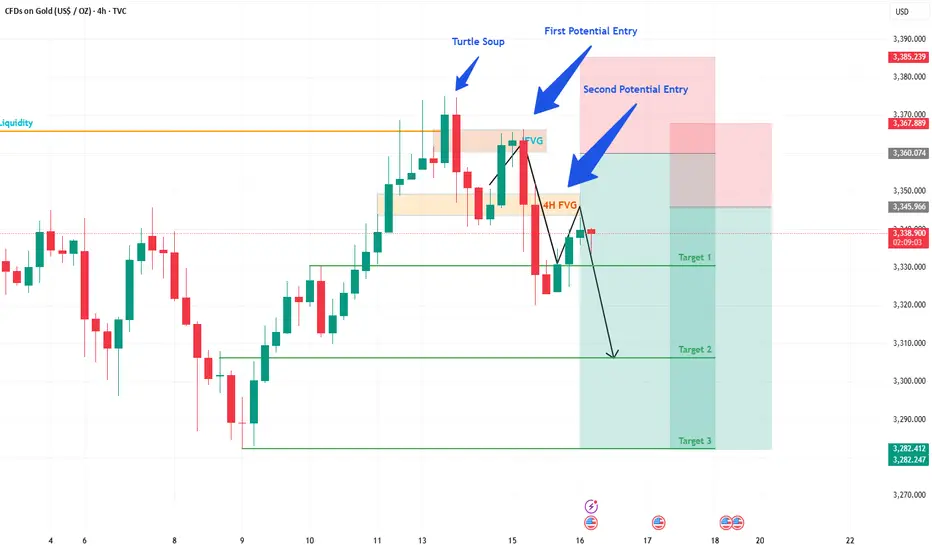
Gold Trade Update: Another Win & What's Next!Hey Fellow Traders! 👋
What a week for Gold! On Monday, I shared my Gold analysis and trade idea, pinpointing a key 1H FVG zone. And guess what? The trade played out perfectly! 🎉 The price dropped ~400 pips from our highlighted area with a tiny drawdown of just 30-40 pips. We smashed Target 1 (TP1), and the market even pushed beyond it! 🙌 Huge congrats to everyone who jumped on this trade! 💰
📈 What's Happening Now?
The price action is heating up! Gold has broken through the 4H FVG, which now acts as an IFVG. The price has retraced almost perfectly to this IFVG, triggering our second layer of entry. 🚦 This is a prime setup, and we’re eyeing TP1 again—and potentially beyond! 🌟
💡 What's the Plan?
Entry: Triggered at the IFVG retracement.
Target: Aiming for TP1, with room for more upside.
Stay sharp and manage your risk—let’s keep those drawdowns tight!
🗣️ Join the Conversation!
What did you think of this move? Did you catch the Gold trade? Drop a comment below, give this post a LIKE 👍, and FOLLOW for more trade ideas and updates! Let’s keep the momentum going and crush it together! 💪
#TradingView #Gold #PriceAction #TradingSuccess
Gold (XAU/USD) Trading Analysis for July 16Support Zone: The market has found support around the 0.5 Fibonacci retracement level at 3,333.58. This could be a potential entry point for a long trade if the price bounces here.
Resistance Zone: The price action is approaching the 3,345.18 level, with a strong resistance around that zone. If the price breaks above this resistance, we could see further upward movement.
Price Action: We can observe an initial bullish movement followed by a correction. The price is currently in an uptrend, forming a series of higher lows and higher highs.
Fibonacci Levels: The 0.5 level at 3,333.58 has already acted as a support zone, and if the price retraces back here, this could be a good opportunity to enter long positions. The 0.618 level at 3,336.32 serves as a key resistance point. If price breaks above this level, it could indicate a continuation of the bullish trend.
Bullish Scenario (Long Entry): If the price retraces back to the 3,333.58 area (0.5 Fibonacci level) and shows signs of support (such as bullish candlestick patterns), consider entering long with a target at 3,345.18.
Bearish Scenario (Short Entry): If the price fails to break above 3,345.18 and forms a reversal pattern, you could consider shorting with a target near 3,320.
Risk Management:
Stop Loss: Place a stop loss just below 3,330, allowing for a small margin of error in case the price breaks through the support level.
Take Profit: Consider setting a take-profit at 3,345.18 for short-term moves or look for further price action if you're aiming for a longer-term trend.
Reminder: Always monitor the price action closely and adjust stop losses accordingly. The market is subject to volatility, especially during high-impact news events, so make sure to stay updated.

GOLD Intraday Chart Update For 16 July 2025Hello Traders,
Today we have major news is US PPI, currently market is in tight range between 3360 to 3310
all eyes on 3360 level breakout for the day for further upward continuation
Only break below 3315 market will goes further downside
Currently we also have Bearish channel in H2 TF
Disclaimer: Forex is Risky
Gold XAU/USD Analysis for July 15, 2025: Trading Strategy and KeThe market is showing a strong upward trend, as indicated by the yellow trendline.
Fibonacci Retracement Levels:
38.2% Fibonacci Level: 3,344.79
50% Fibonacci Level: 3,344.47
61.8% Fibonacci Level: 3,347.91
Resistance Zone: The price is approaching a strong resistance level at 3,370 USD.
Technical Observations:
Gold is currently moving upward but is encountering resistance at 3,361. The price tested the 61.8% Fibonacci level and is now facing some resistance.
The Fibonacci levels suggest that if the price breaks above 3,362, the next target could be 3,370 USD.
Support Zone: If the price retraces, support may emerge near the 3,340 region.
Gold XAU/USD Trading Strategy:
Bullish Scenario:
If the price breaks above resistance at 3,362, the next target would be the 3,370 level. This could be a signal to enter Long positions near the 3,344 to 3,348 range, with a target around 3,370.
Bearish Scenario:
A retracement to the support level at 3,340 is possible. If the price drops below 3,340, further downside could be expected. In this case, a Short position could be considered if the price falls below 3,340, with a target near 3,330.
With the current upward trend, gold XAU/USD may continue to rise if it breaks the 3,362 resistance level, with the next target being 3,370 USD. However, if the price turns lower and drops below the 3,340 support level, the market may continue to decline.
Note: Be sure to monitor the Fibonacci levels and price behavior closely to adjust your trading strategy accordingly for today. If this analysis was helpful, don't forget to save it and follow for more trading strategies!

Gold Price Analysis Bullish Continuation PossibleBullish Trend Formation: We see a series of higher highs and higher lows forming on the chart, suggesting a potential continuation of the bullish trend. However, the market has recently pulled back from the previous peak at 3,340.69, which is now being tested as support.
Fibonacci Retracement Analysis:
The current pullback has reached the 0.5 level around 3,334.32, a strong support zone. This area could offer a potential long entry if the price reacts positively from here.
The 0.618 Fibonacci level at 3,335.82 is also significant, often acting as a final retracement level before the market continues its bullish move.
Support Testing: If the price holds above the 0.618 level, we could expect a price rally towards the resistance at 3,372.00, with possible extension above it.
Trend Continuation: If the price breaks below 3,335.82, consider watching for further downside potential with the next target being the 0.5 level, near 3,334.32.
Trade Strategy (Buy on Support):
Entry: Around 3,334.32 or 3,335.82 (depending on price action confirmation).
Target: 3,340.69 (next resistance zone).
Stop-Loss: Set just below the 0.5 Fibonacci level around 3,327.95 to manage risk effectively.
The current chart is showing a potential for a bullish continuation, with key support levels at 3,335.82 and 3,334.32, backed by Fibonacci retracement. Watching the price action around these levels will be crucial for entering a potential buy position.
Remember to adjust your strategy based on the actual market movements and confirm the trend with price action before making a trade.
