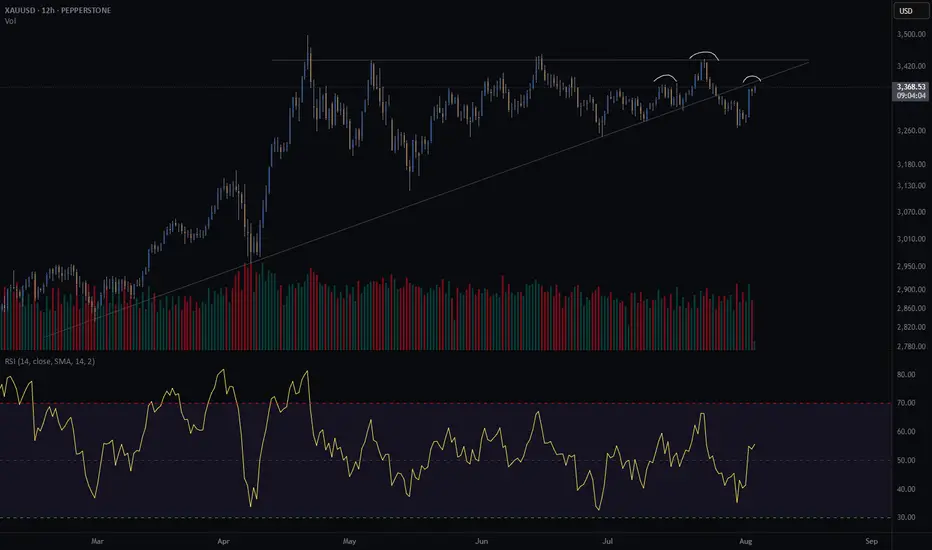
Gold crash (SHORT) - head and shouldersGold is at an interesting crossroad.
It broke through its diagonal support on Friday the 25th of July.
Price is retesting previous support. Does it turn into resistance?
Further confluence is a head and shoulders of the H8 and H12, with the right shoulder coinciding with the retest of the diagonal.
Since I am long gold with my investments, I am hesitant to short gold through my trading business. However, if my pattern is available, I take the trade. This will be a very short term trade - a few days at most if the trade goes in my favour.
Risk/reward = 12.6
Entry price = 3382.5
Stop loss price = 3396.2
Take profit level 1 (50%) = 3230
Take profit level 2 (50%) = 3181
The risk reward is exceptionally high. However, I have taken a more conservative approach with my entry because of my apprehension to short gold. For this trade I will enter at the extreme end of the range in which I will look for entries. This is the reason for such a high RR. It might result in me missing an entry.
Goldrush
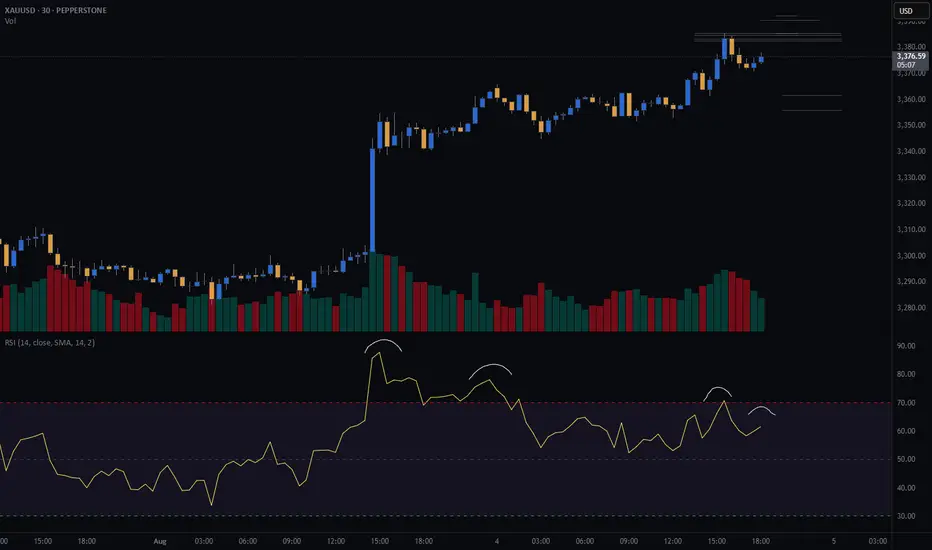
GOLD (XAU) SHORT - Double top 30minRisk/reward = 2.8
Entry price = 3382.5
Stop loss price = 3390.5
Take profit level 1 (50%) = 3361.7
Take profit level 2 (50%) = 3356
I am considering a short on gold.
Still need some variables to fall into place before I enter the trade.
There is nice RSI negative divergence showing declining momentum.
Further confluence:
- Potential head and shoulders on higher time frame
- At area of previous diagonal support which could be turned into resistance if the 30min double top plays out
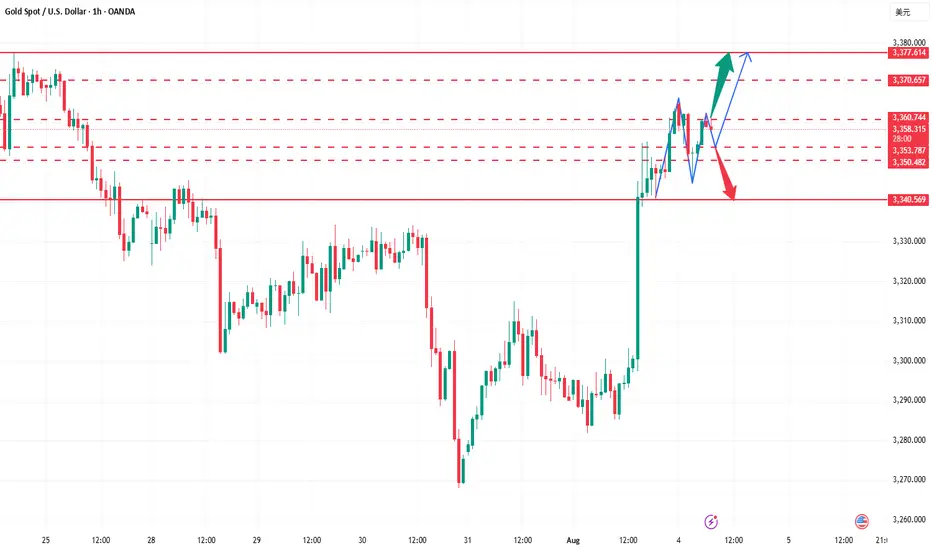
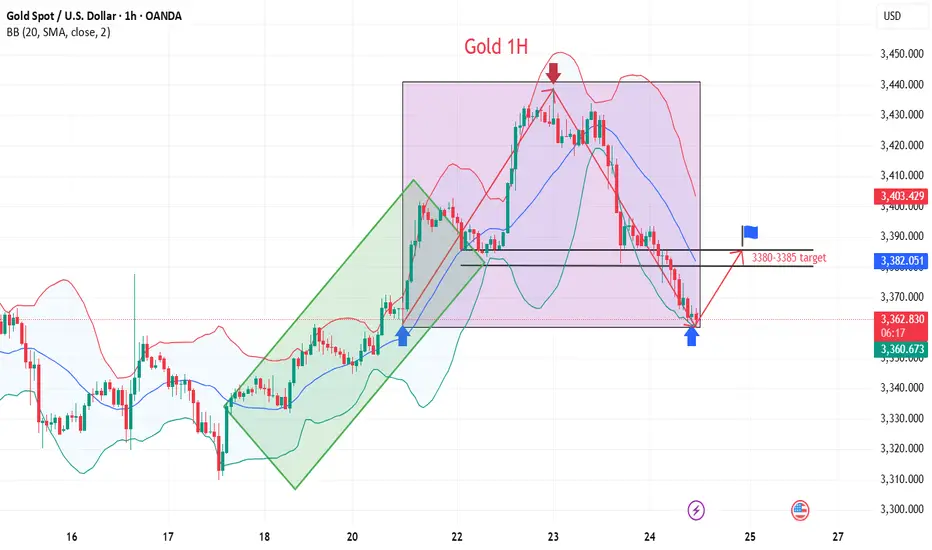
Go long on the pullback and head straight to new highs!Gold fell back and stabilized at 3345 yesterday, and continued to rise during the US trading session, reaching a high of 3385. The overnight daily line closed positive again, which is in line with our expectations, so there is still room for growth. We will continue to take a bullish approach today. In the 4H cycle, the Bollinger opening is in the stage of large volume, and the consecutive positive lines are rising steadily based on the moving average. The support below is 3370-3360, and the intraday watershed is at 3360. The operation is mainly to go long on pullbacks. First look at the pressure of the 3385 high point. If it breaks, continue to look at 3395 and 3410.
Gold operation suggestion: go long on gold around 3370-3360, and look at 3385 and 3400.

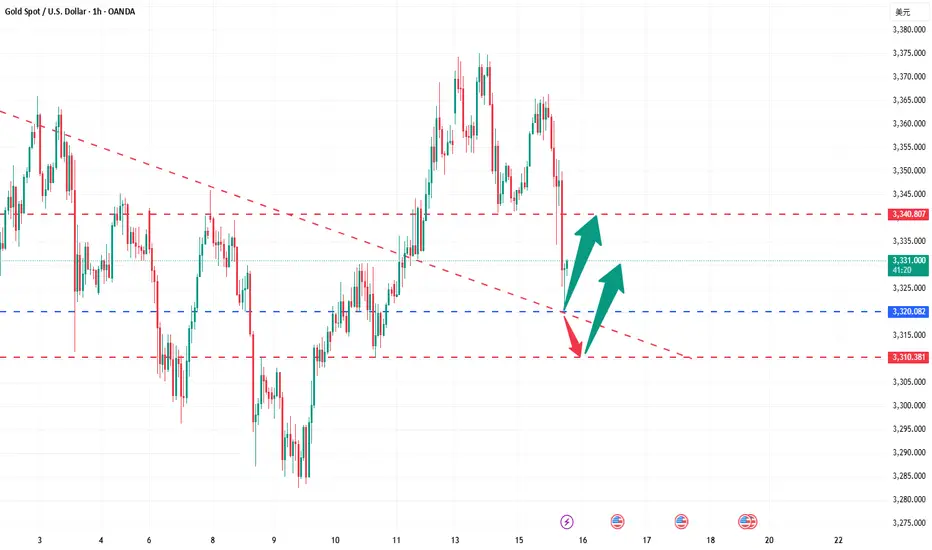
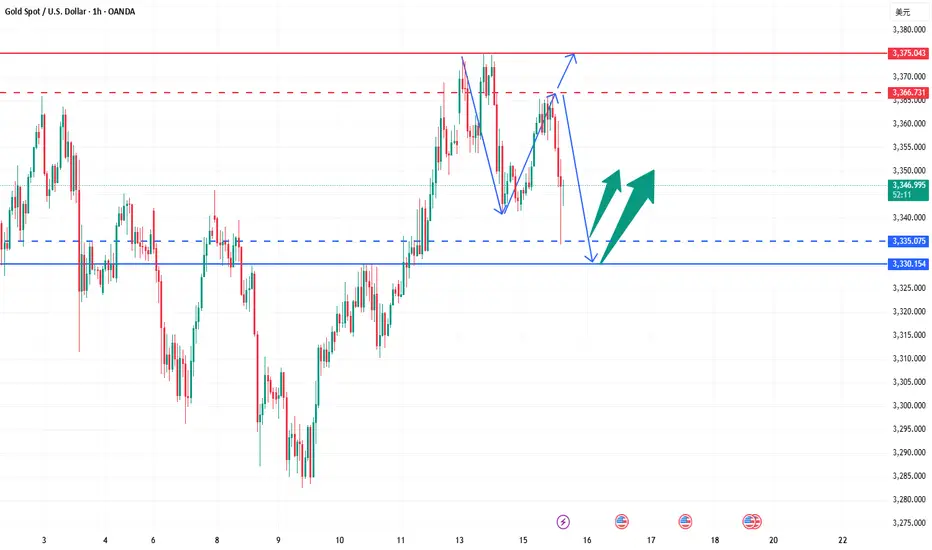
As the bull market continues, is gold poised to hit new highs?Judging from the current gold trend, the technical side opened high and closed low, releasing the demand for short-term adjustments. The intraday low hit 3344 and then rebounded, which is enough to reflect the resilience of the bulls. The hourly doji continued to rise, and the 3353 line was pulled up again. It is expected that it will be difficult to give an entry opportunity near 3340-3345 again. Since the new high has been refreshed again, the technical short-term adjustment may have ended. With the current strong bull structure, further testing the 3370-3380 area is a high probability event. If it unexpectedly falls below 3340 in the future, the bulls will no longer defend strongly, and the market may turn to volatility. Breaking below 3340 is also expected to open up short-term short space, but this is a later story. The current market structure is clear, and we continue to see a strong upward trend for the bulls. At least at the beginning of the week, I do not think the bull market is nearing its end.
Gold operation suggestion: go long around 3360-3355, target 3370-3380.Strictly set stop loss and control your position.
GOLD Weekly Idea💡Why Gold Pulled Back
- Gold pulled back today after hitting $3439.04, just below resistance at $3451.53. Traders took profits ahead of key Fed and trade headlines. Right now, it’s trading around $3414.48, down 0.50%.
- The dip came after the U.S.-Japan trade deal eased geopolitical tension, cutting safe-haven demand. Plus, U.S. bond yields are climbing (10-year at 4.384%), which adds pressure on gold.
Support is building at $3374.42, with stronger buying interest expected around $3347.97 and the 50-day moving average at $3336.40 — a key level bulls want to defend.
Short-term looks a bit weak, but as long as gold holds above the 50-day MA, the bullish trend remains intact. Longer-term, weakness in the dollar, central bank gold buying, and concerns about Fed independence could push prices higher.
🔍Watching the Fed’s July 29–30 meeting next
Gold failed to break through three times, short-term bearish?
💡Message Strategy
Gold's decline today means the second consecutive day of decline as investors turn their attention to more positive trade developments since yesterday.
However, gold still received buying support earlier this week and briefly broke through $3,400. This round of gains tested key resistance levels on the gold daily chart, but ultimately the bears held their ground.
This is the third time in nearly three months that gold has tried to break through the $3,430 to $3,435 resistance area, but all failed.
📊Technical aspects
Gold’s latest decline this week has brought the price back into a range-bound trading state between key hourly moving averages. This means that the short-term trend has become more neutral.
This shows that the upward momentum has clearly weakened and buyers need to regain short-term dominance before they can hope to challenge the key resistance area mentioned earlier again.
Currently, the 200 hourly moving average near $3,365 provides support to the downside. If the price can hold this level, it will indicate that buyers are still holding on and waiting for the next upside opportunity.
Combined with the current 1H chart trend analysis, there is still a great chance of a bullish pullback in gold in the short term.
💰Strategy Package
Long Position:3360-3365,SL:3340,Target: 3380-3400
How to find stable trading opportunities in gold fluctuations?Today, the rhythm of gold going short first and then long is perfectly grasped. Congratulations to those who followed the trading plan for reaping good returns. We are still holding long orders at present, and the overall position is arranged around the idea of stepping back to low and long. From the current market structure, the 3325-3320 area below is an important dividing line for the bulls to be strong, and it is also a key support level that determines the subsequent direction. If this area stabilizes, the short-term structure will still be bullish and unchanged, and the rhythm of stepping back to low and long is expected to continue. It is expected that gold will rebound to 3340-3350 and the upper target again. If 3320 is lost, it is recommended to stop loss as soon as possible, and the defense position is recommended to be set below 3315 to prevent the short-term structure from turning short and bringing further callback risks. The core of this round of trend is that only by holding the support can we be qualified to talk about rebound; if the support is lost, we need to turn decisively to prevent being passive. The current market volatility has intensified, but the direction has not yet completely broken. The focus of operation is still on entering the market around key points, switching positions between long and short positions to find the rhythm, blindly chasing orders and emotional operations will be taboos in the current market. Opportunities are not absent, but they belong to those who are always ready. The structure is not broken and the low and long will not change.
Gold bearishness once again in line with expectationsThe data released so far show that the US inflation data is stable and tends to decline, which increases the possibility of the Fed's monetary policy. The US dollar index fell first and then rose. Gold opened at around 3344 and rebounded all the way. The current highest rebound is around 3366. It fell back to 3352 before the data was released, and then quickly rebounded to 3360. After the data was released, it fell again quickly, and the current lowest touched around 3346. The short orders around 3360-3365 that we shared with brothers before were basically the highest short orders of the day, and we successfully completed our first goal. The brothers who participated in it all made good profits. Judging from the current trend of gold, we continue to participate in short orders during the rebound, and the long position is still around 3335-3330. After the release of the CPI data, it is bearish overall. The core is that it is lower than market expectations but higher than the previous value. Inflation has heated up again, which has once again suppressed the expectation of interest rate cuts. After this data, it also laid a good foundation for the decline in the market. If the price goes up again, it will still rely on the 3365 level to go short again. The data is obviously bearish, and it scared a lot of long positions before it was released.
Gold reference ideas:
Continue to short when it rebounds to around 3358-3365, with a target around 3350-3340;
Go long when it falls back to around 3335-3330, with a target around 3350.
Gold fell under pressure, and the watershed is 3321.
⭐️Gold Information:
During the Asian session on Wednesday, gold prices (XAU/USD) continued to be under pressure, falling below the $3,300 mark, hitting the lowest point in more than a week. The decline in gold prices comes as the market generally believes that the Federal Reserve (Fed) will maintain high interest rates for a longer period of time, especially as the market expects that tough U.S. tariffs may exacerbate inflation in the coming months.
Such expectations have pushed up U.S. Treasury yields and stabilized the U.S. dollar (USD) near a two-week high hit on Tuesday - a key resistance for the non-yielding precious metal, which continues to face downward pressure.
⭐️Personal comments:
Gold price fell below support, Dow Jones H1 pattern, gold price fell below 3300
⭐️Set gold price:
🔥Sell gold area: 3344-3446 SL 3351
TP1: $3335
TP2: $3320
TP3: $3302
🔥Buy gold area: $3256-$3254 SL $3249
TP1: $3268
TP2: $3280
TP3: $3298
⭐️Technical analysis:
Set reasonable sell orders based on technical indicators EMA 34, EMA89 and support and resistance areas.

The idea is clear, gold falls as expected!The gold market is just as I predicted. I have repeatedly warned everyone not to chase the 3350-3355 line. The technical side needs to step back. Now, it just proves the idea I gave. After gold hit the highest line of 3358, it stepped back to the 3337 line and started to fluctuate. Our 3355 short order plan successfully touched 3340 to stop profit and exit. From the current gold trend, it should fluctuate like this before closing. After the opening, we will step back and go long as planned. Focus on the 3330-3335 line below. If it does not break, we can consider going long.
From the current gold trend analysis, pay attention to the 3360-3370 line of pressure on the top, and the short-term support on the bottom is around 3330-3335. Focus on the key support at 3315-3325. Relying on this range as a whole, maintain the main tone of low-long participation unchanged, wait for the pullback to confirm the support and then intervene when the opportunity arises. In the middle position, keep watching and do less, chase orders cautiously, and wait for the entry opportunity after the key points are in place.
Gold operation suggestion: go long around 3315-3325, target 3340-3350.

Where will gold go?In 4 hours, it has fallen below the previous low of 3295, and will continue to fall. There are two supports below, namely 3280 and 3265. Don't expect a big rebound before going short in a negative market. If the rebound is large, it will not fall. This kind of negative decline is generally judged by the 15- and 30-minute patterns. When resistance appears in the big cycle, the market has actually fallen a lot.
Today, I think the pressure is mainly in the 3300 and 3310 areas. 3310 can be considered as the pressure of the top and bottom conversion. Pay attention to 3280 and 3265 below. If you consider going long, these two positions are the main positions. For the time being, the general direction is mainly short.

Gold shorting opportunity not to be missedGold hit the key resistance of 3350 and then fell under pressure, reaching a low of 3309, and was temporarily supported by the low point on Wednesday. The intraday showed a pattern of rapid decline after a volatile rise, highlighting the long-short tug-of-war pattern. The hourly line fell again after a pullback to 3328, indicating that there is still room for short-term retracement. The current operation needs to focus on key points: short orders can be entered again near the pullback of 3328-3335. If the market continues to decline, focus on the support range of 3300-3290, and long orders can be arranged if it stabilizes. The overall idea of oscillation is maintained. Before effectively breaking through 3350 or losing 3290, high-altitude and low-long are still the main strategy.
Gold recommendation: short near 3328-3335, target 3315-3305

Gold is obviously suppressed, so we must go short!Yesterday, gold continued to fluctuate and fall under pressure at the 3360 mark. The US market further accelerated downward to break through the 3300 integer mark and reached a weak closing near 3295. The daily K-line closed with a suppressed fall and broke the bottom of the middle shadow. The overall gold price continued to fluctuate and fall in a weak rhythm. After reaching the lowest level of 3295, it rebounded and closed at 3323. Today, it opened at 3324. As of now, it has reached the highest level of 3337. At present, we are focusing on the suppression of 3340-3348. If the rebound is under pressure, we can still intervene in short orders. The recent market trends are basically the same - bottoming out and rebounding. In terms of operation, continue to keep shorting under pressure and long positions after bottoming out and rebounding.
From the current market trend, today's upper short-term resistance focuses on the 3338-3342 area. If it rebounds to this range and is under pressure, you can consider choosing an opportunity to arrange short orders. The lower support focuses on the 3315-3305 line. If it falls back and stabilizes, there is a possibility of a short-term rebound. The overall situation is still in a range-bound structure. It is recommended to focus on key points, buy high and sell low, follow the trend, and strictly control risks. For more specific operation points, please pay attention to the 🌐 notification at the bottom.

The current price of gold is 3330-3335, go short directly!Gold rebounded after hitting the bottom of 3295. At present, gold is just a rebound, not enough to reverse directly. Gold rebounds and continues to be short. After all, the daily line has fallen continuously, so the short momentum of gold is still there. In the short term, the rebound of gold is just a repair after oversold. Gold is currently priced at 3330-3335 and is directly short.
The 1-hour moving average of gold continues to be arranged in a short position downward. After gold fell below the previous low of 3340 yesterday, gold has not been able to rebound again. In the short term, 3340 has become the key to long and short positions. In the short term, gold rebounds below 3340 and continues to be shorted. If gold breaks through and stabilizes at 3340 again, then gold may start to fluctuate again. Before breaking through 3340, gold is still weak and continues to maintain a short trend.

Today, the Federal Reserve is the key to breaking the deadlock!
📌 Core driving events
Yesterday, as the market believed that the possibility of direct U.S. involvement in the conflict had increased, tensions intensified again, and the market was once worried about possible attacks during the Asian session. Although it did not happen in the end, it is said that the next 24 to 48 hours will be a critical period. This wave of tension triggered widespread "risk aversion" operations in the market, but interestingly, gold did not react strongly. The market remained cautious before the Fed's interest rate decision was released, and the slight increase in risk appetite in the stock market also put pressure on gold prices.
📊Comment analysis
At present, the technical side of gold has been showing a bearish trend, but as of now, the market has not fallen below yesterday's closing low of 3364, and the upper side has been under pressure from the resistance of 3405. Long and short positions are wandering in this range, and the breakthrough market will either break through at the end of the day, and the current trend uses sideways trading to exchange time and space, and has not fallen below the support below, so there is a high probability that it will go up.
In the current tense market, it is more necessary to open a position near the high and low points to make a better game. At the same time, from historical experience, the impact of the Middle East geopolitical crisis on gold has three stages and has entered the second stage. The uncertainty of the global economy, the intensification of trade frictions and the rise in inflation expectations may provide structural support for gold. Therefore, if it does not break near 3364 today, it will be bullish first!
💰Strategy Package
Gold: More near 3368-70, defend the 3364 line, and look up to the 3397-3405 line. If it breaks 3405 upward, it will further impact 3422 and even the previous high, but if it breaks below 3364, the long single position will be adjusted out and it will no longer be bullish for the time being!
⭐️ Note: Labaron hopes that traders can properly manage their funds
- Choose the number of lots that matches your funds

Continue to be bullish after successful adjustment of low longToday, gold opened high at 3448, and fell under pressure after touching 3452. It fell after repeatedly confirming resistance at high levels. We arranged short orders in the 3445-3450 area, successfully touched the target of 3330, and realized profit-taking. Then the market fell back to around 3409 and stabilized and rebounded. We arranged long orders and stopped profit at around 3420. Then we fell back and arranged long orders of 3385 and 3395 to take profits at 3405.
Overall, gold fell slowly after opening high, and maintained sideways consolidation in the European session. The US session continued to fall due to the easing of the geopolitical situation. At present, the focus of the evening is on the support of 3390. If it does not break after the retracement, it can still go long. Pay attention to the key pressure levels of 3410 and 3422 above. The current market is still in the adjustment stage of the upward trend. After the adjustment, it is expected to continue the upward rhythm.
Operation suggestion: Go long on gold when it falls back to around 3390-3392, with the target at 3410 and 3435.
If you still lack direction in gold trading, you might as well try to follow my pace. The strategy is open and transparent, and the execution logic is clear and definite, which may bring new breakthroughs to your trading. The real value does not rely on verbal promises, but is verified by the market and time.

The summit is just around the corner, just one final push away!Gold closed sideways at a high level yesterday, and closed positive again overnight. It opened back to 3379 and pulled up strongly, breaking through the 3400 mark and then increasing in volume. The recent low-multiple bullish ideas have been realized. Today, there is no doubt that it will continue to be bullish and long. The market has turned from the previous sweeping upward to a strong unilateral trend. The upper side will first look at the previous high pressure of 3435. Continued breakthrough will further open up the upper space, or it will hit 3500 or even a new high again. The lower support focuses on the top and bottom conversion position of 3395-3405, and then pay attention to the 1H cycle support near 3410. Intraday operations are still mainly based on falling back and long.
Operation suggestion: Go long when gold falls back to 3395-3345, and look at 3434 and 3450. If it is strong, continue to go long with the support of 3415-3410.

Gold rebound is still a short-selling opportunityFirst of all, let's take a look at why the market is still not reversing after a big rise, and there is a rapid rise and fall?
The data is bullish, and gold is rising rapidly, but we should pay attention to the sustainability of the rise, and secondly, the current trend direction. The overall trend of gold is still fluctuating downward recently, so even if the data is bullish, it is likely to just give an opportunity to "go high and short".
Although gold performed strongly after the data was released, it began to fall under pressure at the 3360 line, the trading concentration area of the last box shock, indicating that the bulls' volume is still not enough to break through the upper resistance. It is reasonable to rise and fall.
Since gold is currently in a market that is tempting to buy more, it means that the main trend is still bearish. The rebound is still dominated by short selling. The gold 1-hour cycle closed with a long upper shadow, indicating that the upward attack is weak, indicating that the area above 3350 is still a strong pressure area. This upward rush is just a short-term effort with the help of data benefits, which is a typical false breakthrough. Therefore, gold rebounded to the 3350-3360 area in the US market, and it is still dominated by high shorts.
This is the charm of the market - some people are always hesitant in the ups and downs, while others can always grasp the key turning points. The premise is to be able to see the trend clearly and follow the trend.
Don't be led by the market, but understand: Is the current fluctuation a trap or an opportunity?
If the direction is wrong, the effort will be in vain; if the direction is right, you will get twice the result with half the effort.
Don't make excuses for failure, just find ways to succeed. Have you found it?
All recent trading strategies and ideas have been realized, and the point predictions are accurate. If your current gold operation is not ideal, we hope to help you avoid detours in your investment. Welcome to communicate with us!

Gold fluctuates repeatedly, and opportunities emerge!Gold was under pressure for the second time during the day, and the pressure at the 3349 line fell back. It continued to be treated with a fluctuating mindset. The 4H cycle observation showed that the Bollinger Bands were closing, and the K-line repeatedly interspersed around the middle track. The short-term structure tended to fluctuate upward. Pay attention to the 3348-3350 and 3362 pressure zones above, and the support below is located in the 3315 and 3302 areas. In terms of operation, the main long and auxiliary short ideas are maintained, and the guidance of CPI data is paid special attention.
Operational suggestions: Gold retreats to the 3315-3305 area and tries to arrange long orders, with the target looking at 3338 and 3349. A strong breakthrough can look up to 3360. If the 3350-3360 pressure zone above is not broken, short orders can be tried in the short term.
All recent trading strategies and ideas have been realized, and the point predictions are accurate. If your current gold operation is not ideal, we hope to help you avoid detours in your investment. Welcome to communicate with us!

Gold V-shaped reversal still has room to rise In the morning, the market was under pressure at 3328, and two consecutive big negative lines fell to the low of 3302, breaking through the lower track of the descending flag consolidation channel, forming an effective break. 3317 was originally the confirmation point of the channel counter-pressure, and it was also the 618 split resistance at the time. Then the middle track was lost, and the trend was bearish, so it tried to rebound but continued to fall under pressure.
But the market immediately made a V-shaped reversal, breaking through the morning high of 3328, and had attacked to 3342 before the US market. The European session was volatile and strong, and with the help of a pullback before and after the U.S. session to lure short sellers, there is still hope for a second rise
The focus of the support for the retracement is on two positions: one is the 3322 line, corresponding to the middle track and 50% split support; the other is 3318, corresponding to the 618 split support. If it stabilizes after touching it, it will most likely point to the 3348 counter-pressure position.
If the pressure of 3348 cannot be broken, there is still a possibility of repeated fluctuations in the short term. It is necessary to pay attention to whether the secondary low point appears when it pulls back to further consolidate the support structure. If the market directly breaks through and stands above 3348, 3293 may have been confirmed as a short-term low.
The recent trading strategy ideas are all realized, and all the points are predicted accurately. If your current gold operation is not ideal, I hope I can help you avoid detours in your investment. Welcome to communicate with us!

Gold fluctuates repeatedly and opportunities emerge.Gold bottomed out in the Asian session and rebounded to break through the opening of the decline. The European session continued to break through yesterday's high. The US session continued to break through the key pressure position of 3335-3345, and walked out of the standard strong cycle. After the break, it is necessary to change the thinking and follow the trend to be bullish. Pay attention to the support below 3315-3325. In terms of operation, it is mainly long when it falls back. The upper side gradually looks to 3352 and 3365. If the pressure is not broken, look at the falling space!
Operation suggestion: Go long when gold falls back to 3325-3315, and look at 3338 and 3352! If the pressure above 3352 and 3365 is not broken, you can short!
The recent trading strategy ideas are all realized, and all the points are predicted accurately. If your current gold operation is not ideal, I hope I can help you avoid detours in your investment. Welcome to communicate with us!

Perfect grasp of the high altitude and low multi rhythm!The current trend of gold continues yesterday's trend, maintaining a high rebound and volatile market. But don't panic, focus on the performance of the rebound. If the rebound fails to break through the upper resistance level, continue to focus on shorting. The upper suppression area is locked at the 3335-3345 line. Although the bullish performance has been strengthened, if it cannot effectively break through this range, it is still a short-term weak signal. From the current market, the upper pressure is obvious, and the rebound can rely on this range to layout the main short, focusing on the continuation of the decline. The lower support focuses on the 3293-3300 integer mark, and the overall long and short wide range of volatile market is maintained. Before the daily level fails to effectively break through and stand firm at the 3345 mark, it is difficult to say that the bulls will turn strong, and operations need to be cautious. If the market adjusts, the strategy will be updated simultaneously.
Operation strategy suggestion: Gold rebounds to the 3335-3345 first-line area to choose the opportunity to short, target the 3295-3306 range, strictly control risks, and follow the trend.

Gold fluctuates repeatedly, hiding great opportunities!After the opening of gold today, the bulls and bears played fiercely. In the early trading, it fell to 3293 and received temporary support, then stabilized and rebounded. It broke through the high point of 3320 in the Asian session and continued to rise above 3330. However, the price was under obvious pressure near 3330, and the momentum indicators (MACD, RSI) showed a top divergence at the same time, reflecting the exhaustion of bullish momentum and limited short-term upside space.
From the technical structure, gold has effectively fallen below the middle track support of the H4 cycle, and at the same time lost the upward trend line built since the low point in June. The two breakout positions are highly overlapped, constituting an obvious technical weakening signal. The current trend is trapped in the key resistance suppression area, and it is expected to enter a high-level shock and weakening stage.
The operation suggestions are as follows:
🔸Strategy direction: short-term thinking
🔸Entry area: 3335–3345 range
🔸Defense reference: stop loss above 3350
🔸Target expectation: look down to 3305, break to 3293 or even 3280 near the extension support
In terms of fundamentals, the US dollar index is under short-term pressure, mainly due to the decline in the US fiscal outlook and US Treasury yields; but the non-agricultural data boosted economic resilience, which cooled the market's expectations for a rapid rate cut this year, restricting the rebound space of gold prices. Although risk aversion has support, it has not yet become a dominant driver. The current market sentiment remains cautiously neutral.
Overall judgment: The short-term rebound of gold prices is limited, and the short-term trend is gradually released after the structural break. It is recommended to follow the trend and go high, control risks, and steadily execute trading plans.
