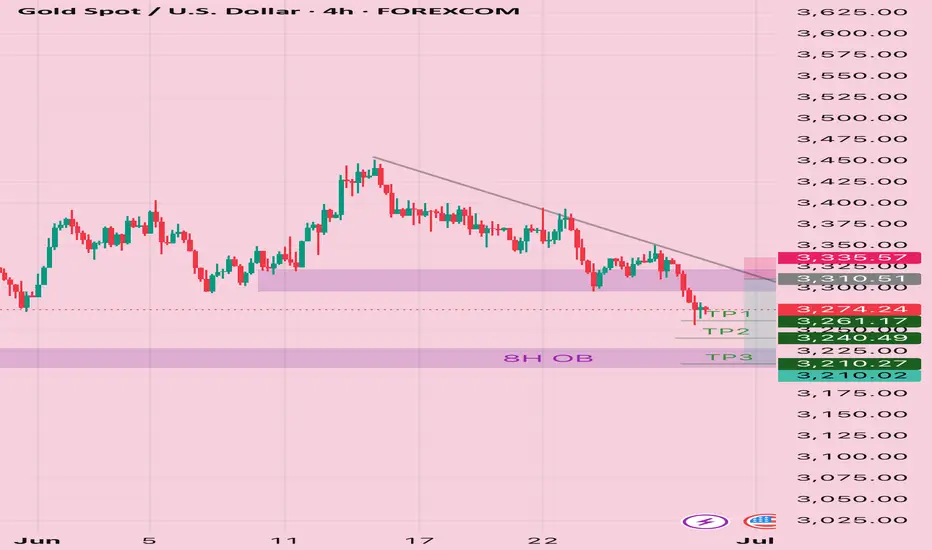
XAU/USD) bearish Trand analysis Read The captionSMC trading point update
Technical analysis of (XAU/USD) on a short-term timeframe, incorporating several key tools and concepts:
---
Overview of the Analysis
Price Level (Current): Around $3,273.40
EMA 200 (Blue Line): Around $3,337.95 (signaling broader trend)
Resistance Zone (Yellow Box): Between approximately $3,300–$3,320
Support/Target Zone: Around $3,231.11
RSI (Relative Strength Index): At 32.88, which is near oversold territory (below 30)
---
Interpretation of Chart Structure
1. Descending Channel:
Price is moving within a downward-sloping channel.
Suggests a bearish trend is in play.
2. Resistance Level (Yellow Box):
Price is expected to retest this area and face resistance.
Confluence of a supply zone and upper trendline, reinforcing its strength.
3. Projected Price Action:
Price may climb back up into the resistance zone.
A rejection is anticipated, leading to another leg down.
The target is around $3,231.11, which matches previous measured moves.
4. Measured Moves (Blue Arrows):
Highlights historical price drops of ~79 points.
Repeating this pattern suggests symmetry and continuation.
5. RSI Indicator:
Currently at 32.88: nearing oversold, but not quite.
No clear bullish divergence, so price could drop further.
---
Trade Idea Summary
Bias: Bearish
Entry Zone: Near $3,300–$3,320 (resistance)
Target: Around $3,231.11
Invalidation: If price breaks and holds above $3,337–$3,340 (EMA 200 and channel breakout)
Mr SMC Trading point
---
Caution/Considerations
Watch for false breakouts above the resistance zone.
Monitor RSI for potential bullish divergence that could invalidate the downside.
Be cautious around the U.S. economic news event icon, which might cause volatility.
plesse support boost 🚀 this analysis)
Goldsell

Navigating Gold Futures: Support, Resistance, and ProjectionsCOMEX:GC1!
The chart appears to depict a clear five-wave pattern: I, II, III, IV, and V.
Waves I to III show strong upward movements, indicating bullish sentiment.
Wave IV looks like it could be a corrective phase, with a potential dip before another upward movement in Wave V.
Support and Resistance Levels:
The horizontal lines around 2,800 and 2,575.3 indicate critical Fibonacci retracement levels (38.20% and 50%).
If the price approaches these levels during the correction, they could serve as support, making it a potential buying opportunity.
RSI Indicator:
From the bottom indicator (RSI), we can see fluctuations in momentum, which can aid in timing trades.
Look for interpretations of the RSI: if it trends towards the extremes (overbought/oversold), that could signal reversal points.
Future Projections:
Should the market respect the outlined support levels, Wave V could potentially push towards a new high above 4,000 as indicated by the upward projection.
Market Sentiment:
Overall, the pattern suggests a bullish outlook long-term, but caution is warranted during corrective phases as prices might retrace towards support levels.

"BREAKOUT ALERT! XAU/EUR Bear Raid – Get In Before The Drop!"🤑 GOLD HEIST ALERT! 🚨 XAU/EUR Bearish Raid Plan (Thief Trading Style) 💰🔥
🌟 Greetings, Market Pirates & Profit Snatchers! 🌟
Based on the 🔥Thief Trading Strategy🔥, we’re plotting a high-stakes bearish raid on XAU/EUR ("The Gold Market"). Our mission? Short the breakout & loot the downside!
🎯 TRADE SETUP (Scalping/Day Trade)
Entry (Sell Zone) 📉: 2841.00 – Wait for Neutral Level breakout, then strike!
Pro Tip: Place sell-stop below support or sell-limit on pullback (15-30min TF).
Set an ALERT! Don’t miss the breakout moment.
Stop Loss 🛑:
"Stop right there, cowboy! 🤠 If you’re entering on a sell-stop, DO NOT set SL before breakout!
Thief SL Rule: Nearest swing high (30min TF) – Adjust based on your risk & lot size.
Rebels, be warned – stray at your own peril! 🔥
Target 🎯: 2815.00 (Lock profits & escape like a pro thief!)
💡 WHY THIS HEIST? (Bearish Triggers)
Technical Setup: Oversold bounce? Trap. Strong bearish reversal brewing.
Fundamentals: Macro risks, COT data, geopolitics – Gold’s under pressure!
News Alert 🚨: High-impact events ahead! Avoid new trades during news – trail stops to protect gains.
💥 BOOST THE HEIST! 💥
Like & Boost this idea to strengthen our robbery crew! More loot = more winning trades. Stay tuned for the next heist! 🚀💰
⚠️ Disclaimer: Trade at your own risk. This is not financial advice – just a strategic raid plan. Manage risk wisely!

GOLD Setup- Bearish Bias!FOREXCOM:XAUUSD Price is forming a series of lower highs and lower lows on the 4‑hour timeframe, indicating a downtrend bias. Recent resistance at the 70 EMA / descending trendline is holding strong,hard to break above.
Based on recent candle pattern with long lower wicks at current price, it’s most likely A short term correctional swing might occur to zone 3295-3310.
Setup:
Entry: 3300-3310
Targets: 3260, 3240, 3210
Stop Loss: 3331
Risk: 1:2,3,5
Disclaimer: This is not financial advice.
.
Welcoming your thoughts in this setup. Let’s grow together<3
Will the FALL continues?Last trade idea was fulfilled and went into the downside. Targeted 3250. If this 3250 major support area breaks down, we can expect a bigger downside move.
However, there’s a huge buying that happened at that level. It may first have a pullback upwards before it continues its decline. RSI is also at oversold level.
Bullish reversal can be confirmed if 3350 gets broken.

XAUUSD/GOLD/SellThe pressure from the bears is too great. In the end, the pressure from above was not broken. Instead, it broke out and fell after being under pressure. The stop loss was hit.
The current price is 3285. After gradually boosting the US dollar index. The trend of gold prices has continued to fall. More importantly, the tariff issue has been eased. At the same time, geopolitical factors are also orderly and stable. This is the news that caused the bears to attack.
History has not become the savior because of repeating itself. Of course, this is also an emergency. In some transactions, the extremely low probability of causing losses is a common problem in transactions. However, our analysis team has stabilized a high trading win rate.
Then the next trading plan is still to focus on the pressure from above. If the London market rebounds above 3300. It is still mainly selling. 3314 is an important level for short-term rebound, and we need to pay attention. Although there is no obvious sign of rebound yet, the release of short-selling pressure has been alleviated because the decline is slow. Today's main trading idea is still to sell at high levels.
The target is to focus on the position of 3264-3248. Remember the risk of buying at low levels. Do not trade independently.
XAUUSD - Gold Bearish Bias Remains StrongXAU/USD remains under bearish pressure on the 4-hour timeframe. Until price breaks and closes above $3,336 with strength, selling the rallies remains a preferred strategy. However, watch for potential bounces near support zones, especially if momentum weakens or reversal candles appear. The price is currently trading below both the 50, 100 and 200 EMA, indicating a short-term downtrend. The recent price action has respected the trendline resistance and failed to break higher, reinforcing sellers’ control.
Price structure has formed a descending channel, which often signals a bearish continuation. However, if price finds a strong reaction from support, a temporary rebound could occur before further downside. Overall sentiment is cautious due to recent geopolitical de-escalation between Iran and Israel, which reduced gold’s safe-haven demand. Dollar strength, driven by hawkish Fed tone, continues to pressure gold.
Key Support Levels :
$3,295 – A minor support where previous candles showed buying interest.
$3,289 – Critical horizontal support and psychological level.
$3,270 – Next significant support if $3,289 breaks.
$3,240 – Major support zone, last line before larger downside moves.
Key Resistance Levels:
$3,310 – Near-term resistance and EMA zone.
$3,320 – Price rejection level from earlier 4H candles.
$3,336 – Strong resistance with previous swing highs.
Note
Please risk management in trading is a Key so use your money accordingly. If you like the idea then please like and boost. Thank you and Good Luck!

GOLD - XAUUSD Bear Flag PatternVery simple and clean chart with Bear flag pattern. If it breaks then hoping for retrest of 3300 area or more down.

Analysis and layout of the latest gold trends during the day📰 Impact of news:
1. PCE and Consumer Index
📈 Market analysis:
Judging from the 4H chart, the Bollinger Bands are closing and the MACD is showing a trend of forming a death cross, indicating that the short-selling momentum is still relatively strong in the short term. However, as the overall upward structure has not been destroyed, there is still a possibility of a rebound and repair in the future. During the day, we need to pay special attention to the support strength of the MA5 and MA10 moving averages. It is recommended to adopt the idea of shorting at high levels and going long at low levels. The key support below is the 3305-3295 area, and the upper resistance is the 3340-3350 range. However, judging from the chart, in the short term, there may be a rebound near 3313. At present, it has indeed rebounded to around 3319 as expected. If it falls weakly to this week's low of 3295, you can buy if it does not break. On the whole, if it rebounds to 3335-3345, you can consider shorting, and if the support below 3305-3295 is not broken, go long. Today is Friday, and as it is near the end of the month, market liquidity is strong. Please be cautious in your operations today and be sure to set stop losses strictly.
🏅 Trading strategies:
SELL 3335-3345-3350
TP 3320-3315-3300
BUY 3305-3295
TP 3310-3320-3330
If you agree with this view, or have a better idea, please leave a message in the comment area. I look forward to hearing different voices.

XAUUSD: Bearish Trend, Key Support at $3,295Market Overview
In today’s trading session (26/06/2025), XAUUSD shows continued downward momentum. Gold prices are currently hovering around $3,302.05, with a slight drop of 0.01%. The intraday price range has been tight, between $3,330.00 and $3,350.00, indicating a battle between the buyers and sellers around the short-term equilibrium zone.
Recent price action suggests that after a brief recovery, gold is once again encountering resistance at the $3,350.00 level. In the coming hours, a decisive breakout either above this resistance or below current support will dictate the market’s next move.
Key Technical Levels to Watch:
Support Levels: The first significant support is at the $3,295.37 level (50% Fibonacci retracement), with the next support at $3,296.60 (61.8% Fibonacci retracement), followed by a crucial level at $3,300.56.
Resistance Levels: The primary resistance area lies around $3,350.00, with the second resistance at $3,327.72, which coincides with the 3.618 extension of the previous price swing.
Price Action Analysis
As seen in the chart, XAUUSD is currently trading below both the 50-period (blue) and 200-period (yellow) moving averages, indicating a strong bearish trend. The price action is forming a series of lower lows and lower highs, reinforcing the downtrend.
Bearish Trend Continuation: A break below the support at $3,295.37 could signal further downside towards $3,290.00 or even $3,275.00. The yellow trendline indicates the overall bearish direction, and any failure to hold above $3,300.00 could trigger additional selling pressure.
Fibonacci Retracement Levels: Price is testing the 50% and 61.8% Fibonacci levels. A rejection at these levels could cause a pullback towards lower support zones, confirming the bearish outlook for the short term.
Volume Analysis
The volume chart shows relatively low volatility, with decreasing volume during the price pullbacks. This suggests that there is not enough buying interest to push the price higher, and the market may be more inclined towards bearish continuation in the near term.
Market Sentiment
Currently, the market is undecided. The recent price action suggests that traders are waiting for a confirmation of direction. The next few hours are critical in determining if the downtrend will continue or if we will see a short-term bounce at one of the key support levels.
Trading Strategy
Short Position: A break below $3,295.37 would be an excellent opportunity to short XAUUSD with a target at $3,290.00, and further down to $3,275.00.
Long Position: Only consider long positions if XAUUSD manages to break above $3,350.00 decisively, with the next target near $3,375.00.
Conclusion
XAUUSD remains under pressure, and unless there’s a strong reversal at support levels, the bearish momentum could continue in the short term. Traders should monitor the key levels mentioned above closely to adjust positions accordingly.

Gold Falls After Rejection at 3350 – Eyes on Short-Term Pullback📊 Market Drivers:
• Gold spiked to $3,350/oz early in the day but later dropped to $3,310/oz as profit-taking kicked in and U.S. yields recovered slightly.
• Market is in a wait-and-see mode ahead of PCE inflation data on Friday, limiting upside momentum late in the session.
📉 Technical Analysis:
• Key resistance: $3,345–3,350 (daily high)
• Nearest support: $3,310 – session low; then $3,290
• EMA09: Price trading above EMA09, but below EMA21, signaling a neutral bias
• Candle/momentum: Formed shooting star reversal near $3,348 on H1 with declining volume → short-term weakness ahead
📌 Outlook:
Gold may pull back toward $3,300–3,290 short-term if USD rebounds and selling persists. But medium-term bullish bias remains if inflation data disappoints and USD continues weakening.
💡 Trade Ideas:
🔻 SELL XAU/USD at: 3,335–3,345
🎯 TP: 3,315
❌ SL: 3,352
🔺 BUY XAU/USD at: 3,295–3,305
🎯 TP: 3,315
❌ SL: 3,285

Still bearish!If the short-term bull lifeline 3330 is lost, the trend will be bearish again. The first pressure point above is 3350-the secondary top 3345, and then the 3332-35 area. If the price bulls regain 3335 again, then the operation should be carried out in the range of 3350-3310. It is not recommended to enter the market at the halfway point because it is easy to be washed out. If the daily K line closes below 3340, then 3332-35 is the best position at present. At present, the price is bearish below 40, and it can rely on 3332-31 to continue to be bearish. The target is 3310 and 3924.

Seize the rebound opportunity and prepare to short goldGold continued to rebound as expected and has now extended to above 3340. In the short term, it tends to fluctuate and rise. In the previous trading idea overnight, I emphasized that everyone should not take the risk of shorting gold near 3330. Now it seems that this reminder is completely necessary. Although gold continues to rebound, the overall performance of the bulls is still not strong, and the upper side is still under pressure in the 3350-3360-3370 area. So I still advocate that you can consider shorting gold in the 3350-3360 area after the rebound.
The Premium privilege of my account will end in 10 hours. Friends in the channel have already made a lot of money by following my trading strategy. Friends who have not joined yet can join and receive the latest trading strategies and trading signals as soon as possible to escort your trading!

XAUUSD Outlook: Watching FVG Reaction for Bearish EntryThe previous day’s up-close candle didn’t reflect strong bullish conviction. Although price opened higher than the previous candle’s close, it closed only slightly above — completing the three-candle formation required to establish a Fair Value Gap (FVG).
As expected, buy-side liquidity above the previous day’s high has been raided. Price is now pushing towards the consequent encroachment of the FVG. How the market reacts at this level will be key in determining the next directional move.
While I maintain a bearish bias, I expect the market to trade higher into a bearish order block, providing a potential opportunity to enter short. If price does not react from the current FVG, it could continue higher to sweep liquidity resting above the swing high at 2357.82, which sits just below another unfilled FVG.
Entry Strategy
I will look to enter short only after a clear displacement, signalling a change in state of delivery, either:
Off the reaction from the current FVG, or
From a deeper liquidity zone
If no such confirmation presents itself, I will remain on the sidelines and wait for a more favourable setup.
Thanks for your support!
If you found this idea helpful or insightful, please drop a like 👍 and leave a comment — I’d love to hear your thoughts! 🚀
Follow me for more daily price action insights and trading strategies on XAUUSD and other key markets.
Let’s grow and trade smarter together! 📈
Disclaimer:
This content is for educational and informational purposes only and does not constitute financial or investment advice. All trading involves risk. You are solely responsible for your own decisions, so always conduct proper research and due diligence before taking any trades.
Past performance is not indicative of future results. Trade responsibly.

It’s the right time to short goldThe daily gold line presents a three-top gathering pattern. The historical trend shows that the 3290-3280 area has triggered technical pullbacks many times, all of which rebounded to around 3350. The current 4-hour chart trend line suppression level coincides with the Fibonacci 0.618 pullback resistance from the previous high of 3450 to 3300 in the 3350-3360 range. This area constitutes the core pressure zone. If the price fails to effectively break through and stand above 3360 when it probes this area again, it is highly likely to replicate the previous two resistance and fall patterns. At that time, short orders will be arranged based on the 3350 first-line resistance area, with the goal of breaking the key support of 3300 and further looking down at the 3280 and 3260 levels. The overall bearish tendency is maintained, and the resistance to rebound is a signal to enter the market and sell short.
Gold recommendation: Gold is short around 3345-3352, target 3330-3320

Gold May Slightly Pull Back Around 3,350 USD📊 Market Overview
• Gold is currently trading around 3,340–3,345 USD/oz, supported by a weaker USD and lower U.S. yields, with 60 bps Fed rate cut expected by year-end, starting in September
• The Israel–Iran ceasefire has eased safe-haven demand, triggering a mild pullback, while support remains near 3,300 USD
📉 Technical Analysis
• Key resistance:
3,370 USD (short-term peak)
3,380–3,400 USD (prior highs)
• Nearest support:
3,300 (technical bounce zone)
Next at 3,275 (momentum weak)
• EMA:
Price trading below the 9-period EMA on H4, indicating a mild bearish/choppy short-term trend
• Candles/volume/momentum:
RSI & Stochastics near neutral suggest consolidation or minor retracement .
📌 Outlook
Gold may pull back to 3,300–3,320 if the USD rebounds or geopolitical tensions ease further. However, a Fed rate cut in September or renewed Middle East instability could drive prices back up to 3,370–3,400.
💡 Suggested Trade Plan
• SELL XAU/USD: at 3,365–3,370
o 🎯 TP: 3,345–3,340
o ❌ SL: 3,380
• BUY XAU/USD: at 3,300–3,310
o 🎯 TP: 3,320–3,330
o ❌ SL: 3,290

Gold fluctuated slightly, retreating to low-multiple operations
📌 Gold news
During the North American trading session on Wednesday, gold prices remained stable, rising by more than 0.30% as easing tensions between Israel and Iran boosted risk sentiment. Meanwhile, disappointing US housing data may prompt the Federal Reserve (Fed) to take action in the future. However, Fed Chairman Jerome Powell's continued tough stance has limited further upside for gold.
📊Comment analysis
Gold fluctuated in a small range yesterday, and the daily line closed with a positive cross star.
Daily support is around 3327-3324, and you can go long if you touch it.
Daily resistance is around 3368, and you can go short if you touch it.
If the market goes down to yesterday's low, the bottom continues to look near this week's low, and I am more inclined to be bullish
💰Gold operation strategy
If gold is close to 3327, you can go long, with a target of 3345.
Look for opportunities to short around 3350-3360, with a target around 3330.
I hope Labaron's article can help you with your investment. If you don't understand something, you can find me. I am not only a mentor, but also a friend worth making in your life.
⭐️ Note: Labaron hopes that traders can properly manage their funds
- Choose the number of lots that matches your funds

GOLD Trading: trategy: Look to SELL at resistance zone,downtrend🎯 Trade Setup:
Entry Zone (Sell Limit): 3,353 – 3,357 USD
Stop Loss (SL): 3,375 USD
Take Profit (TP): 3,280 – 3,283 USD
Risk-Reward Ratio: Approximately 1:3 → suitable for 2–4 session swing trades.
📊 Technical Analysis:
1. Overall Trend:
GOLD is clearly in a downtrend, confirmed by:
A descending trendline connecting recent lower highs.
Price consistently forming lower highs and lower lows.
2. Indicator-Based Analysis:
🔹 SMA 89 (Purple Line):
Price is trading below the 89-period SMA, confirming bearish momentum.
SMA89 acts as a dynamic resistance, and the 3,353–3,357 zone aligns with this resistance level.
🔹 BB20 (Bollinger Bands):
The upper band sits near 3,383, close to the SL zone → validating 3,375 as a proper stop.
Price is currently bouncing from the lower BB, so a rejection from the mid-to-upper band is likely, supporting a SELL setup.
🔹 Volume Analysis:
Volume is decreasing during this recent rebound, indicating:
Weak bullish pressure, typical of a corrective move.
The rally lacks conviction → strengthens the bearish case.

XAUUSD Technical Outlook – Rebound or Trap?1. Market Overview
After a sharp rejection near the 0.618 Fibonacci level, XAUUSD has pulled back and is now trading around 3,323 USD. Although price has stabilized somewhat, technical indicators suggest this is likely a corrective move within a prevailing downtrend.
2. Technical Analysis
Price Action
XAUUSD is currently hovering near 3,323 USD after a failed attempt to break above the resistance zone at 3,373–3,392 USD — an area marked by:
The 0.618 Fibonacci retracement from the recent downtrend
Repeated historical rejections.
The upper boundary of a sideways consolidation range from early June.
Recent candlesticks show indecision and rejection from higher levels, suggesting sellers are still in control.
Support Zone Behavior
The price recently bounced from the 3,294–3,317 USD range, where strong historical support and the 0.382 Fibonacci level align.
This zone continues to hold, but if broken, could open the door to deeper declines toward the 3,250 or even 3,224 USD levels.
RSI Indicator
RSI remains flat around the neutral zone, indicating a lack of bullish momentum.
No significant divergence or breakout signals are currently visible on the daily RSI chart.
3. Key Technical Levels
Resistance:
3,373 – 3,392 USD: Confluence resistance zone (0.618 Fib + historical supply).
3,435 – 3,453 USD: Previous swing high – key medium-term benchmark
Support:
3,294 – 3,317 USD: Immediate support, holding for now.
3,250 – 3,224 USD: Potential next target zone if bearish pressure resumes.
4. Trade Setup Scenarios.
Scenario 1 – Buy if support holds and bullish confirmation appears
Entry: 3,295 – 3,305 USD.
Stop-loss: Below 3,289 USD.
Take-profit: 3,340 – 3,355 – 3,370 USD.
Condition: Look for bullish reversal patterns (e.g., Bullish Engulfing, Pin Bar) on H1–H4.
Scenario 2 – Sell on rejection from resistance zone
Entry: 3,370 – 3,375 USD.
Stop-loss: Above 3,392 USD.
Take-profit: 3,330 – 3,310 – 3,290 USD.
Condition: Clear bearish rejection candlestick with diminishing volume
Note:
XAUUSD remains in a vulnerable state. The current move may be a technical rebound rather than a true reversal. Traders should watch closely how price behaves around the 3,373–3,392 USD zone in the coming sessions. A breakout could signal a new bullish leg, while another rejection would likely confirm a continuation of the bearish trend.
Continue to short gold!Gold prices rose modestly on Wednesday, mainly benefiting from the US dollar index hovering at a one-week low and the low US bond yields, which boosted the purchasing power of non-dollar investors. The market is closely watching the situation in the Middle East, and the fragile ceasefire between Israel and Iran is still uncertain. However, as the conflict between the two sides has temporarily eased, the geopolitical risk premium that had previously pushed up gold has gradually dissipated, and safe-haven funds have continued to flow out of the gold market, limiting the room for gold prices to rebound.
Technically, gold closed with a big negative line on the daily line, recording the seventh consecutive week of decline, which significantly undermined the recent bullish pattern. The current market sentiment is clearly bearish. After the sharp drop last night, there may be a technical adjustment today, but the 3347-level high point above has become a key resistance. If it cannot be broken, the short-term pressure situation will remain unchanged. The downward support focuses on the 3300-level area. If it is lost, it may further test the previous low of 3290, or even fall to the important turning point of 3274. Overall, the decline of the US dollar brings short-term respite, but the technical selling pressure and the fading of risk aversion continue to suppress the rebound momentum of gold. It is expected to maintain a weak and volatile trend in the short term.

Bearish direction remains unchanged, wait patiently
Since the sharp drop in gold last Monday (June 16), except for the correction of closing the cross positive line last Tuesday, the daily level has closed five consecutive negative lines since last Wednesday until now, fully demonstrating the weak characteristics of gold prices in recent trading.
From the technical indicators, the 5-day moving average and the 10-day moving average have formed a dead cross, which is an important signal of the weakening of the short-term market trend. The current gold price continues to run below these two moving averages, further verifying the current market situation where the shorts dominate. There is still no big fluctuation in the intraday, short positions are patiently waiting, and the operation still maintains our target of 3310-3305 unchanged.

The downward trend is strong.The easing of the situation in the Middle East weakens the demand for safe havens
The direct trigger for the decline in gold prices was the news that Israel and Iran announced a ceasefire. This news quickly cooled the market's risk aversion, and the attractiveness of gold as a traditional safe-haven asset weakened. In the past few weeks, the military confrontation between Israel and Iran once pushed up the safe-haven buying of gold, but with the conclusion of the ceasefire agreement, the market quickly turned to risk preference mode, global stock markets rose, and the US dollar fell. This change in market sentiment directly led to the decline in gold prices.
This decline will still intensify, pay attention to your trading orders, I will continue to update this article, I wish you a smooth trading.

GOLD/XAUUSD SellGold price is still bearish in the short term. The US dollar is currently being boosted. There are also geopolitical talks and indirect ceasefires. Therefore, the short-term risk aversion sentiment has declined. The gold price is now quoted at: 3323. We can focus on the lower target of 3300-3290.
