Gold 1M & 15M Bearish Breaker Block Setup, Targeting 3,202 ZoneI’ve marked a bearish breaker block on the 1-minute chart (3,316–3,319), also visible on the 15M timeframe.
✅ Last bullish push before the sharp downside breakout.
✅ Price retested this zone, wicked through it, and then sold off aggressively — reinforcing bearish order flow and the potential for deeper downside.
I’m tracking this move as the final C wave of an ABC corrective pattern.
✅ The C wave started from the 3,319 high and is unfolding in a 5-wave substructure.
✅ 1-Minute breaker block around 3,316–3,319 — I’m watching for rejection here, which aligns with the 0.618 Fib retracement as an estimated end of wave 2.
✅ My current expectation: wave (3) and (5) of C could extend lower to the 3,256–3,202 zone.
🧩 Key Confluences:
Bearish breaker block rejection
15M downtrend structure remains intact
#XAUUSD #gold #forex #elliottwave #bearishbreakerblock #orderflow #priceaction
Goldsell

Gold awaits tariff volatility!
📌 Driving Events
Gold rebounded from a weekly low near $3,245 and broke through the $3,300 mark on Thursday, boosted by optimism following a weaker-than-expected U.S. jobs report and a U.S. court ruling halting President Trump's proposed tariffs.
Gold fell on Friday as the dollar rose slightly, while investors await a U.S. inflation report that could provide further insights into the Fed's policy trajectory.
📊 Commentary Analysis
The market continued to fall for an hour, fluctuating back and forth, lacking continuity - it rose yesterday and fell today. Gold rebounded above $3,320 in early trading before retreating. On the weekly and daily charts, the trend is still dominated by range fluctuations rather than unilateral gains or losses.
I think shorting gold should be considered today, with support below at $3,280-3,270-3,260. However, prices may struggle to make new lows. As today is the monthly close, large fluctuations suggest that we should avoid chasing ups and downs.
💰Strategy plan
XAUUSD
Sell: 3330-3320-3310
tp: 3300-3290-3280

The end of the triple cycle faces a big test of data
Today is the closing of the monthly, weekly and daily lines, and the PCE data will be released, so the market volatility may increase. Looking at the four-hour level of gold, the downward trend line remains intact. As time goes by, the suppression level has also come to around 3345. In view of the fact that the rebound of 3245 at 3330 is blocked and moves downward, today's Asia-Europe session strategy focuses on the continuation of the downward trend; at the hourly level, the last high point of 3365 has been trading below the trend line since the decline. Yesterday's high broke the trend line, but today's opening fell below 3308, so the short-term trend has returned to the short position again. Therefore, today is still bearish, short-selling ideas.
The specific operation is to intervene in short positions below 3310, with a short-term target of around 3278; wait for a rebound near 3288 and short again to look at the target of 3245; mid-term operations can directly focus on the 3245 position, followed by the 3200 mark.

Gold May Undergo Short-Term Correction Amid Technical Resistance📊 Market Overview:
Gold is currently trading around $3,314/oz, slightly down after testing resistance near $3,350. The market faces pressure from a strengthening USD and inflation concerns. Investors are closely monitoring signals from the Federal Reserve regarding future monetary policy.
📉 Technical Analysis:
• Key Resistance: $3,350
• Nearest Support: $3,200
• EMA: Current price is near the 50-day EMA, indicating a potential trend reversal if resistance holds.
📌 Outlook:
Gold may decline in the short term if it fails to break above the $3,350 resistance and the USD continues to strengthen.
💡 Suggested Trading Strategy:
SELL XAU/USD at: $3330
o 🎯 TP: $3,310
o ❌ SL: $3,340
BUY XAU/USD at: $3,230
o 🎯 TP: $3,250
o ❌ SL: $3,220

The direction is reversed, let's go short together
Views on the trend of gold in the European session!
The view of continued retracement remains unchanged. Although the market fell sharply at the opening and quickly rebounded again, it is still suppressed by the short-selling pattern. Even if there is a large rebound and a break, it is only a lure to buy. In fact, it is a short-selling after the wash. In addition, it has been fluctuating and adjusting for several weeks, but we have been paying attention to the high-rising big positive line closing last week, but we did not expect it to continue to weaken this week.
This is just the beginning of the short-selling. 3280 is the previous low support of gold price. After testing the support, a short-term long-short reversal is formed. It retreats and breaks the low point. It is expected that it will continue to test the low point today. The gold price will be dominated by a short-selling decline. The current round of decline has not been reversed, and the short-selling target below is still the 3233 and 3209 levels!
Gold: Continue to short near 3280 after the second pullback, defend 8-10 US dollars, target 3233-30, break through and look down to 3209! On the contrary, you can enter long positions in the short term and bet on a rebound!

Gold: H&S with Break and Retest in a downtrendHead and Shoulders
Break and Retest
Downtrend
Entry at Retest
SL at Right Shoulder
TP at lower channel breaking point of support.

GOLD:The strategy of going short
Gold was stimulated by the news surface, out of a wave of accelerated decline, and then rebounded slightly into a small shock. Before around 3288 support long ideas have been perfect realization, at present 3288 this support has fallen below, so in the short term we can regard this position as pressure level, short term can be around this position to short mainly.
So the trading strategy :SELL@3288-94 TP@3260-50
↓↓↓ More detailed strategies and trading will be notified here →→→
↓↓↓ Keep updated, come to "get" →→→

Gold's rebound is weak and the bearish trend is dominant.The 1-hour gold chart shows that the Bollinger Bands open downward, and the gold price is running near the lower track, with a weak short-term trend. If it fails to rebound effectively and break through the 3290 line, the support below will focus on the 3240-3230 area. Overall, the gold price fluctuates downward, the moving average system is in a short position, and the downward pressure is further revealed. It is currently recommended to continue to maintain a high-altitude thinking and focus on short-selling opportunities after the rebound.
In the short-term operation of gold during the day, rebound short-selling is the main focus. Pay attention to the pressure level of the 3290-3280 area above, and the support level of the 3240-3230 area below. In terms of operation strategy, it is recommended to arrange short orders when the gold price rebounds to the 3280-3290 range. This is a key pressure area, and it is necessary to pay attention to the market reaction in this range.

The golden range strategy continues to workGold bottomed out and rebounded as expected today. Friends who follow me should be able to clearly feel that I have been insisting on analyzing the trend of "bottoming out and rebounding" recently. Today, gold opened at 3300, and rebounded after the lowest price fell to around 3291. So far, the highest price has reached 3325. Overall, the support below gold is still strong, but the suppression above cannot be ignored. Therefore, the market performance yesterday and today was relatively stable, with small fluctuations as the main trend.
In terms of operation ideas, continue to pay attention to the support level of 3290-3295. If it falls back and does not break, maintain a bullish mindset. At present, the long orders in the 3290-3295 range have been notified to enter the market as planned, and are currently in the profit stage. If you encounter difficulties in the current gold market operation, I hope my analysis can help you. Welcome to communicate at any time.
From the 4-hour cycle chart, the support below gold is around 3290-3295, and the pressure above is concentrated in the 3330-3340 range. In the short term, the watershed between long and short is around 3275-3283. Before the daily level effectively falls below the watershed, it is still in a long-short shock pattern, maintaining the main theme of "high-altitude and low-multiple" cycle participation.
Gold operation strategy: If gold falls back to the 3290-3295 line, you can try to go long. If it further falls back to the 3280-3285 line, you can consider covering long orders, and the target is around 3316-3320.

Gold Continues to Decline as USD Strengthens📊 Market Developments:
Gold prices continued to decline on May 29, reaching weekly lows below $3,250/oz. The primary driver is the strong recovery of the US Dollar following a US court's decision on tariffs and cautious FOMC minutes indicating the Fed remains vigilant about inflation, reducing gold's appeal as a safe-haven asset.
📉 Technical Analysis:
• Key Resistance: $3,285 – $3,300
• Nearest Support: $3,240 – $3,230
• EMA: Price is below the 09 EMA, indicating a short-term downtrend.
• Candlestick Patterns / Volume / Momentum: Price has broken below a short-term ascending trendline and is retesting the resistance area, confirming bearish signals.
📌 Outlook:
Gold may continue to decline in the short term if the USD maintains its recovery and the price fails to break above the $3,285 – $3,300 resistance zone.
________________________________________
💡 Suggested Trading Strategy:
SELL XAU/USD at: $3,275 – $3,285
o 🎯 TP: $3,240
o ❌ SL: $3,305
BUY XAU/USD at: $3,230
o 🎯 TP: $3,270
o ❌ SL: $3,215

XAUUSD Bearish Signal | Technical + Custom AlgoSmart Trend Signal | Technical Analysis + Custom Algorithm
This signal is the result of a combination of classic technical trend analysis and a proprietary software I personally developed.

GOLD TodayGOLD is still bearish.
For me are two potential setups.
On screen. If first not profitable I will looking next one.
This is just my view

Gold Technical Analysis - Potential Rising Wedge Signals CautionGold (XAU/USD) is trading around $3,340 - $3,350 area, exhibiting a bullish market structure characterized by higher highs and higher lows. The price has recently tested the resistance zone between $3,330 and $3,350, a level that has previously acted as a ceiling for upward movements. A decisive break above this resistance could pave the way for further gains, with potential targets at $3,371 and beyond. Conversely, failure to sustain above this level may lead to a pullback toward the support zone around $3,300.
The rising wedge on Gold signals caution for bulls. Unless there's a strong breakout above $3,365 , the pattern favors a bearish move toward $3,250 or lower.
✅ Long Bias – Bullish Outlook
Gold is currently trading in an uptrend , supported by:
Higher lows and higher highs structure.
Strong bullish momentum on the rebound from the recent dip around $3,120 .
Fundamentals like economic uncertainty, interest rate cut expectations, or geopolitical tension that often support gold prices.
If price breaks and holds above $3,350–$3,365 , it would confirm bullish continuation, and a long position targeting $3,400–$3,500 is valid.
🔻 Short Setup – Bearish Outlook
Consider a short trade only if:
Price gets rejected from $3,350–$3,365 .
A lower high is confirmed (on H4 or Daily TF).
Bearish candlestick patterns appear at resistance.
Break below $3,300 would open downside targets to $3,250 , and potentially $3,200 .
⚠️ Caution Zone – Potential Pullback
However, there are early signs of exhaustion:
Price is testing a descending trendline + previous weekly high (~$3,330–$3,350) – a key decision point.
If rejection is confirmed, we might see a retest of support near $3,300 or $3,250 .
📊 Current Market Structure
Chart Pattern : Rising Wedge
Timeframe : 4H and Daily
Resistance Trendline : Connecting recent highs around $3,320 → $3,350 → $3,365
Support Trendline : Connecting higher lows around $3,250 → $3,300 → $3,330
Note
Please risk management in trading is a Key so use your money accordingly. If you like the idea then please like and boost. Thank you and Good Luck!

Fed Uncertainty and Rejected Trendline ResistanceOANDA:XAUUSD TVC:GOLD Gold trades around $3,270 after rebounding from the $3,240 support zone, but remains capped below the $3,287–$3,290 resistance zone, which now acts as resistance after the breakdown. Technically, the price is struggling under a descending trendline (TL2), and the $3,287 zone also aligns with previous support turned resistance.
Fundamentally, the rejection of Trump's “Liberation Day” tariffs by the U.S. trade court helped ease risk sentiment, reducing safe-haven demand and pressuring gold. At the same time, market focus shifts to today’s U.S. GDP data and Friday’s Core PCE inflation report—both of which may sway Fed expectations and drive short-term volatility.
If XAU/USD fails to break back above $3,287, a renewed test of the $3,240 breakout zone is likely. Sustained downside may open the path to $3,207 or lower. On the upside, reclaiming $3,290 would weaken the bearish bias and challenge the TL2 trendline.
Resistance : $3,287 , $3,302
Support : $3,240, $3,207

XAUUSD | 30M | SELL NOW Hello, everyone,
My gold target level is 3,250,0
My friends, every single like from you is my biggest motivation to share my analysis.
Thank you very much to everyone who supports me with likes.

XAU/USD) Bearish trand analysis Read The ChaptianSMC trading point update
Technical analysis for Gold (XAU/USD) on the 4-hour timeframe. Here's a breakdown of the key ideas and strategy behind it:
---
Key Elements of the Chart:
1. Descending Channel Pattern:
Price is moving within a descending channel (downward sloping resistance and support lines).
The red arrows mark previous rejections from the upper boundary of the channel.
2. Supply Zone / Resistance Area:
Highlighted in yellow, the price has entered a supply zone (between 3,412.00 and 3,440.42), historically where selling pressure has emerged.
The analysis suggests sellers may dominate again in this zone.
3. Price Action Projection:
Expected to reject from the supply zone, possibly forming a lower high.
Price is projected to break the short-term upward trendline, then fall sharply.
4. Target Points:
First target: 3,206.96 – likely aligned with a minor support level or Fibonacci retracement.
Second target: 3,085.56 – near the lower boundary of the descending channel.
5. EMA 200 (3,238.55):
Price is currently above the 200 EMA, but the projection anticipates a breakdown below it, confirming further bearish sentiment.
6. RSI Indicator:
RSI is at 67.56, near overbought territory, suggesting limited upside and a possible correction.
---
Trade Idea Summary:
Bias: Bearish
Entry Zone: Between 3,412 – 3,440 (supply zone)
Confirmation: Rejection at the trendline + RSI divergence
Targets:
TP1: 3,206.96
TP2: 3,085.56
Invalidation: Break and hold above 3,440.42 (channel breakout)
Mr SMC Trading point
---
Risk Management Note:
Ensure stop-loss is placed above the resistance zone (e.g., around 3,450) to mitigate false breakouts. Monitor fundamentals like upcoming US economic data, as they can heavily impact gold.
Pales support boost 🚀 analysis follow)

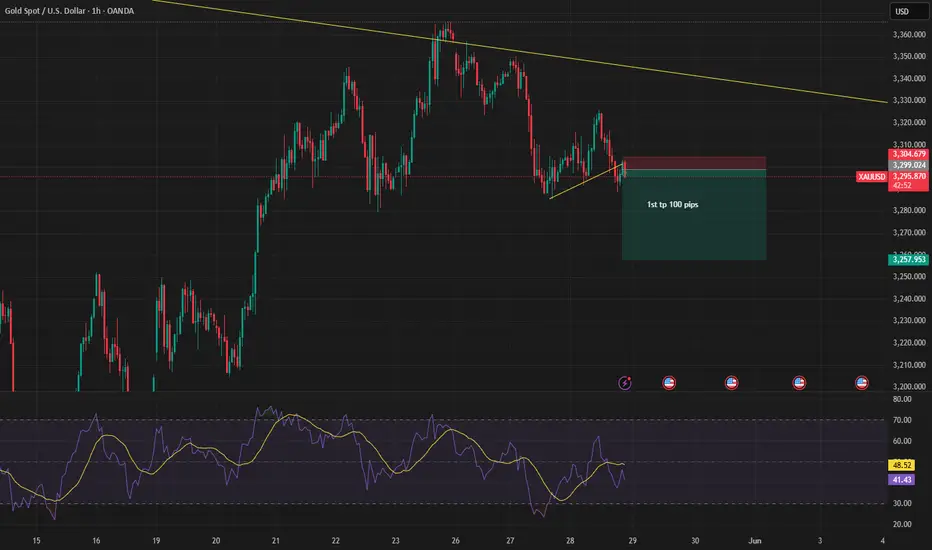
Sell On Gold I am seeing a sell opportunity On Gold as it broke the trend line and successfully retested it. the Next buying is @3270 because a 4hr unmitigated FVG is there.
3278-3320 key position is mainly high sell low buyAt present, gold rebounded after falling back to 3287, and fluctuated around 3300 in the short term. Pay attention to the support area of 3278-3283 below. If it does not break this area, you can still try to go long in the short term. After all, from a technical point of view, the decline during the day is a correction and adjustment to the previous rise.
From the 4-hour chart, the upper short-term focus is on the suppression of the 3316-3320 area, and the lower focus is on the support of 3278-3283. In terms of operation ideas, continue to maintain the interval strategy of "high-altitude and low-multiple", rely on key positions to sell high and buy low, and wait patiently for effective signals before entering the market. If the structure or rhythm of the market changes, the strategy will be adjusted in time and notified separately.

Gold May Undergo Short-Term Correction as USD Rebounds📊 Market Overview
Gold (XAU/USD) is trading around $3,309/oz after retreating from the $3,350 region during the Asian session today. Selling pressure emerged as U.S. Treasury yields rose and the USD rebounded slightly, despite expectations of potential Fed rate cuts in the near future.
📉 Technical Analysis
• Key Resistance: $3,350
• Nearest Support: $3,290
• EMA 09: Current price is below the EMA 09, indicating a short-term bearish trend.
• The downtrend is confirmed by bearish candlestick patterns and increasing trading volume in recent sessions.
📌 Outlook
Gold may continue its short-term correction if the USD continues to rebound and U.S. Treasury yields remain elevated. However, long-term support factors such as concerns over U.S. national debt and expectations of Fed rate cuts persist.

How will the short-term trend of gold develop?From a technical perspective, the overall volatility is limited. In the near future, the upper side is under pressure from the trend line, and the lower side is affected by the 4-hour middle track support. The overall trend is maintained in the range of 3365-3322. The current monthly line is approaching its closing, and the short-term market is temporarily in a high-level oscillation stage. In the 4-hour cycle, the price range is gradually narrowing, waiting for a directional breakthrough. The lower support focuses on the 3325-3320 middle track position and the previous top and bottom conversion support of the 3308 line; the upper pressure focuses on the 3352 and 3365 areas. After a slight high opening, it weakened. The overall idea is still to treat it as a wide range of fluctuations. It is recommended to be long and short in operation, and adjust the strategy after breaking through.
Operation suggestion: Go long near 3330-3323, and the target is 3340 and 3352;
If the pressure near 3352 is not broken, consider shorting, and the target is to fall back to the 3330 line.

GOLD increased in the short term: Break down expectedThe Gold market has been very strong for some time, but I don’t think this will continue to be the case going forward. As we’ve seen, the price has rallied a bit on Friday with Trump’s EU tariff threats.
Market structure starts to hint exhaustion, as such overbought conditions often lead to generous pullbacks, supporting needed corrections.
That being said I do think that on Monday we might see a short term pullback.
We can see that gold is currently being rejected just above the higher zone of the 4h ascending channel. The zone aligns with a low-volume node as well. Therefore, at this zone around the 3,350, I wouldn't recommend to chase high. Before this zone is clearly broken considering long entries here would be buying blindly.
Right now I think you have to look at this as a market that may just simply be a buy on the dip and hold till we get to the $3,500 level again type of situation.
The other scenario is that the market will consolidate for a while.
If we were to break down below the $3,290 level, then $3,200 is next support.
In the long run though the bias remains bullish with potential to challenge the 3,435 and as well as 3,500 in the big picture.
But if you're watching for buys:
wait to see how price behaves on Monday
watch for sustained bullish structure before getting involved
don’t chase, wait for a clean break + candle confirmation pattern
For sells:
Watch for bearish rejection in the next couple of candles (4H or Daily)
Don’t enter unless it’s confirmed!

Gold rejection (27MAY2025)The yellow trendline on 4hour for Gold got broken, and now more downside movement is coming.

Gold fluctuates at high levels, long and short profit ideas
📌 Driving events
On Sunday, U.S. President Donald Trump announced that plans to impose 50% tariffs on the European Union would be postponed until July 9, easing concerns about an imminent escalation in trade hostilities. This development reduced immediate risk aversion in the market, putting pressure on gold prices.
Nevertheless, investors' attention now turns to the FOMC minutes released on Wednesday, which may further clarify the Fed's monetary policy outlook. At the same time, market participants will continue to pay attention to trade negotiations between the United States and Japan and other major economies. Any new tensions or setbacks in these negotiations could quickly restore demand for gold as a protective hedge.
📊Comment Analysis
Gold prices fell slightly after the official announcement of the tariff extension and continued to climb
💰Strategy Package
🔥Selling area: 3388-3390 SL 3395
TP1: $3376
TP2: $3363
TP3: $3350
🔥Buying area: $3301-$3299 SL $3294
TP1: $3312
TP2: $3325
TP3: $3338
⭐️ Note: Labaron hopes that traders can properly manage their funds
- Choose the number of lots that matches your funds
- Profit is 4-7% of the capital account
- Stop loss is 1-3% of the capital account
