XAUUSD BEARISH Major bearish sentiment detected by my quantitative analysis mechanisms. Price should drop to 1800. This outcome is extremely likely.
Goldsell

Analysis of gold price trend next week!Market news:
Spot gold fell nearly 1% on Friday, closing at 3316. Although the price of gold closed above 3300 this week, the trend of London gold prices this week can be described as ups and downs. Intraday transactions have fluctuated by nearly $100 many times. Under the situation of trade tensions, the market has a high risk aversion sentiment, pushing the international gold price above 3500. The easing of global tensions, especially between the United States and China or in Eastern Europe, may significantly reduce the demand for safe havens. Although this is not the base case in 2025, it is still an unexpected risk that traders must consider. In fact, after US President Trump hinted that tariffs on my country may be reduced! The positive risk tone weakened the demand for safe-haven assets. In addition, optimistic US macroeconomic data on Thursday supported the US dollar, which also hit gold prices. Next week, the gold market will welcome the release of the World Gold Council's first quarter "Gold Demand Trends" report. In addition, Trump's 100th day rally on Tuesday may become an important window for gold prices to choose to test the 3,500 mark again or continue to fall from 3,300. In the short term, gold prices may face technical corrections and profit-taking pressures, and the $3,260-3,300 area will be the key battlefield for long and short tug-of-war.
Technical Review:
From the perspective of market sentiment, interest-free gold as a safe-haven asset has performed strongly this year, and its price has soared by nearly $700 and refreshed its historical high several times. However, the recent optimistic expectations of easing global economic and trade relations have boosted market risk appetite, and the equity market has generally performed positively. Some funds have flowed out of safe-haven assets such as gold and turned to risky assets, which is also the main psychological factor under pressure on gold prices. If the market risk appetite continues to improve, global economic and trade relations further ease, and the US dollar strengthens, gold prices may face greater downward pressure and will first test the $3,260 support. If it fails, it may drop to $3,225 or even challenge the $3,200 integer mark. In addition, if the US economic data performs strongly, the market's expectations for the Fed's interest rate cut may further cool, which will also put pressure on gold prices. From the performance of the daily chart, the recent trend of gold prices has shown a high consolidation trend, and there has been a significant correction from the high point near $3,500. After hitting the low point of the week, gold prices rebounded to a certain extent, but the rebound strength was blocked near the 23.6% Fibonacci retracement level (about $3,368-3,370), which has now become an important short-term resistance. The weekly gold line is also a shooting star with a long upper shadow line at a high level. If gold does not have the support of big bullish news in the short term, then gold will still be under pressure at a high level in the short term, and the daily line is also down from a high level without a strong counterattack. Overall, there is still room for adjustment in the short term for gold.
Analysis for next week:
In view of the important trend of gold prices breaking through key points, the subsequent market will most likely continue to sell. From the current market structure, the position of $3260 has become the focus of the market. Investors need to pay close attention to whether the gold price can reach or even fall below this point. Once it effectively falls below, the selling trend will be further strengthened, and the market may usher in a deeper adjustment. The gold 1-hour moving average continues to sell, but after gold bottomed out near the first-line support of 3265, gold rebounded by more than 50 US dollars. Is this rebound a reversal? Not necessarily, because now it basically fluctuates by about 100 US dollars every day, and it is difficult to say that a rebound of 50 US dollars is a reversal. The strength of next week is the key. If the rebound of gold next week is not very strong, then gold will still fluctuate and sell. The resistance of the gold 1-hour moving average is near 3354, and the top of the gold negative line on Friday is near 3352. If there is no effective breakthrough of these two positions next week, it will still fluctuate and sell.
Operation ideas:
Buy short-term gold at 3275-3278, stop loss at 3267, target at 3310-3330;
Sell short-term gold at 3363-3366, stop loss at 3375, target at 3300-3310;
Key points:
First support level: 3300, second support level: 3285, third support level: 3260
First resistance level: 3327, second resistance level: 3343, third resistance level: 3366

Gold Trend Weekly Review Operation strategy layout for next weekWhat news has recently affected the trend of gold and crude oil? How to judge the future market of gold bulls and bears?
Spot gold fell nearly 1% on Friday, closing at 3316.26. Although the price of gold finally closed above 3300 this week, the trend of gold prices this week can be described as ups and downs. The intraday transactions fluctuated by nearly $100 many times. Under the situation of trade tensions, the market was risk-averse, pushing the price of gold above 3500. After Trump's unilateral statement on tariffs eased, coupled with the 3500 mark, investors closed their long positions, and the lowest price of gold fell to around 3260 during the week. At the moment when tariffs were deadlocked, any remarks made by Trump on tariffs did not reduce the risk of the market, but increased the uncertainty of the market and the volatility of gold prices. So far this year, gold has risen by more than 25%. Trump's repeated changes in his criticism of Powell this week are also a major factor driving the sharp fluctuations in gold prices. U.S. President Trump said on Monday that the U.S. economy may slow down unless interest rates are lowered immediately, and criticized Federal Reserve Chairman Powell again. Powell said that interest rates should not be cut until it is clearer that Trump's tariff plan will not lead to a sustained surge in inflation.
The ADP employment report, known as the "small non-farm", will also be released next Wednesday, along with the latest PCE inflation and consumption data. The crucial core PCE price index is expected to rise 0.1% month-on-month in March, and the year-on-year growth rate will slow from the previous value of 2.8% to 2.5%; personal consumption is expected to maintain a month-on-month increase of 0.4%, indicating that US household consumption remains strong. However, the real focus will be the non-farm payrolls report scheduled for release next Friday, and speculation is currently very intense about when the Fed will cut interest rates. Non-farm payrolls growth is expected to slow from 228,000 in March to 130,000 in April, and the unemployment rate remains unchanged at 4.2%. Average wages may increase by 0.3% month-on-month in April. The disappointing non-farm payrolls, coupled with weak core PCE data, may reinforce expectations that the Fed will cut interest rates by 25 basis points in June rather than July, but for May, the market generally expects the Fed to remain on hold. From a macro-trend perspective, gold is still in an upward trend, as real yields may continue to fall against the backdrop of the Fed's accommodative policy. But in the short term, if positive news about tariffs continues to come, gold prices may fall further as the market is re-adjusting expectations. In the long run, structural positive factors still exist, and emerging markets have further room for adjustment in the composition of foreign exchange reserves, and may gradually move closer to the reserve structure of developed countries in the future. Fed officials said they are not in a hurry to adjust monetary policy, and further observation is still needed to determine how the Trump administration's tariff policy affects the US economy.
Analysis of gold market trends next Monday:
Gold technical analysis: From the performance of the daily chart, the recent trend of gold prices has shown a high consolidation trend, with a significant correction from the high point near $3,500. After hitting the low point of the week, the gold price rebounded to a certain extent, but the rebound strength was blocked near the 23.6% Fibonacci retracement level (about 3368-3370 US dollars), which has now become an important short-term resistance. The opening trend of the gold market on Friday was like yesterday. The upward mode started in the Asian session, rising all the way to around 3370 US dollars. However, it encountered strong resistance here and then turned downward and started to fall. It is worth noting that on Friday, the gold price not only failed to break through this key resistance level, but also fell below the low point hit by the European and American sessions yesterday, and rebounded after reaching the lowest point of 3265 US dollars.
From the current market structure, the position of 3260 US dollars has become the focus of the market. Investors need to pay close attention to whether the gold price can reach or even fall below this point. Once it effectively falls below, the short trend will be further strengthened, and the market may usher in a deeper adjustment. From the current situation, there are two Yins enclosing Yangs, so the adjustment will continue at the beginning of next week; of course, this adjustment can be replaced by sideways trading, which means that it is not ruled out that it will run back and forth in the 3260-3370 range. On the whole, the short-term operation strategy for gold next Monday is to focus on long positions on pullbacks and short positions on rebounds. The short-term focus on the upper side is 3368-3370 resistance, and the short-term focus on the lower side is 3265-3260 support. Friends must keep up with the rhythm. It is necessary to control the position and stop loss, set stop loss strictly, and do not resist single operations. The specific points are mainly based on real-time intraday trading. Welcome to experience and exchange real-time market conditions.

Gold ended successfully, Where will the market go next week?The idea of keeping gold short at a high level is that after the winning streak of gold ended, gold continued to fluctuate in a narrow range. If there is no opportunity, then it will end early and rest. After all, it is Friday. After a hard week, it is time to rest. The news on the weekend has changed a lot, and it is full of uncertainty. Gold rebounded again in the second half of the night, which seems to be strong, but has gold reversed? It is too early to say now.
The 1-hour moving average of gold continues to be short, but after gold bottomed out at the first-line support near 3265, gold rebounded by more than 50 US dollars. Is this rebound a reversal? Not necessarily, because now it basically fluctuates by about 100 US dollars every day, and it is hard to say that a rebound of 50 US dollars is a reversal. The strength of next week is the key. If the rebound of gold next week is not very strong, then gold will still fluctuate and be short. The resistance of the 1-hour moving average above gold is near 3354, and the top of the negative line of gold on Friday is near 3352. If there is no effective breakthrough of these two positions next week, it will still be a fluctuating and short trend.
The weekly line of gold is also a shooting star with a long upper shadow at a high level. If there is no big bullish news to support gold in the short term, gold will be under pressure at a high level in the short term, and the daily line is also down from a high level without a strong counterattack. On the whole, there is still room for adjustment in the short term for gold.
The market is changing rapidly and confusing. Sometimes we cannot be confused by the illusion in front of us. Only by not being afraid of the clouds blocking our eyes can we see clearly behind the market. Before gold reverses, it is still bearish in the short term. It is light to follow the trend and messy to go against the trend. The market is always right. Going against the market will eventually be taught a lesson by the market. Don't have any fluke mentality in the face of the trend. The market will not forgive your mistakes again and again.
Next week's operation ideas: short gold 3350-60, target 3310-3300;

Gold fluctuates in a range and corrects sideways! Trend AnalysisAnalysis of gold market trends next Monday:
Technical analysis of gold: From the performance of the daily chart, the recent trend of gold prices has shown a high consolidation trend, and there has been a significant correction from the high point near $3,500. After hitting the low point of the week, the gold price rebounded to a certain extent, but the rebound strength was blocked near the 23.6% Fibonacci retracement level (about $3,368-3,370), which has now become an important short-term resistance. The opening trend of the gold market on Friday was like Thursday, and the Asian session started to pull up and rise all the way to around $3,370. However, it encountered strong resistance here, and then turned downward and started to fall. It is worth noting that today's gold price not only failed to break through this key resistance level, but also fell below the low point hit by yesterday's European and American sessions, and rebounded after reaching a minimum of $3,265.
From the current market structure, the position of $3,260 has become the focus of the market, and investors need to pay close attention to whether the gold price can reach or even fall below this point. Once it effectively breaks, the bearish trend will be further strengthened, and the market may usher in a deeper adjustment. From the current form, there are two Yins enveloping Yangs, so the adjustment will continue at the beginning of next week; of course, this adjustment can be replaced by sideways trading, which means that it is not ruled out that it will run back and forth in the 3260-3380 range. On the whole, the short-term operation strategy for gold next Monday is recommended to be mainly long on pullbacks, supplemented by short on rebounds. The short-term focus on the upper resistance of 3368-3370, and the short-term focus on the lower support of 3265-3260. Friends must keep up with the rhythm. It is necessary to control the position and stop loss, set stop loss strictly, and do not resist single operation. The specific points are mainly based on real-time intraday trading. Welcome to experience and exchange real-time market conditions.
Reference for gold operation strategy next Monday: Strategy 1: Short gold rebounds near 3368-3370, target near 3300-3285, and look at the 3260 line when it breaks.
Strategy 2: Go long on gold when it pulls back to around 3265-3270, target around 3290-3330, and look at the 3370 line if it breaks.

Gold is under pressure and falls again Short again on rebound!Gold rebounded weakly during the European session, and fell twice during the US session, with the lowest price dropping to 3265. However, even though it is extremely weak at present, it is not recommended to blindly chase the short position. The support below is 3260, which is the previous low point and is close to the volatility limit. Instead, you can try short-term long positions with a light position. The short-term pressure above is maintained at 3306, and the breakthrough will gradually reach 3315 and 3328!
Operational suggestions: Gold is short near 3310-20, and look at 3300 and 3280! Long positions can be made if the support below 3260 is not broken!

Market trend analysis and unique operation layoutTechnical analysis of gold: From the performance of the daily chart, the recent trend of gold prices has shown a high consolidation trend, and there has been a significant correction from the high point near $3,500. After hitting the low point of the week, the gold price rebounded to a certain extent, but the rebound strength was blocked near the 23.6% Fibonacci retracement level (about $3,368-3,370), which has now become an important short-term resistance. Today's opening trend of the gold market is like yesterday. The upward mode started during the Asian session, rising all the way to around $3,370, but encountered strong resistance here, and then turned downward and started a decline. It is worth noting that today's gold price not only failed to break through this key resistance level, but also fell below the low point hit by yesterday's European and American sessions, and rebounded after the lowest point fell to $3,265.
In view of the important trend of gold prices breaking down key points, the subsequent market is likely to consider the idea of swinging and shorting. From the current market structure, the position of $3,260 has become the focus of the market, and investors need to pay close attention to whether the gold price can reach or even fall below this point. Once it effectively breaks, the bearish trend will be further strengthened, and the market may usher in a deeper adjustment. From the 4-hour chart, the intraday rebound is under pressure from the middle track downward. At present, the K-line has returned to run below the moving average. The short-term trend is bearish. The market may further test the support near the lower track 3260. The short-term upper pressure focuses on the pressure near 3315, which is near the ma5 moving average. Above it is the pressure near the middle track currently moving down to 3338. Relying on these two pressures, there is still room for further decline in the short term, pointing to the previous day's low of 3260, so you can try to buy the bottom with a light position for the first time. On the whole, today's short-term operation strategy for gold is to focus on long positions on pullbacks and short positions on rebounds. The upper short-term focus is on the 3315-3320 line of resistance, and the lower short-term focus is on the 3265-3260 line of support. Friends must keep up with the rhythm.

Gold price remains volatile at 3,300, short-term operation
💹Fundamental analysis
Fed officials have hinted at an openness to possible rate cuts, a stance that could limit further gains in the U.S. dollar (USD) and provide support for non-yielding gold prices. In addition, growing concerns about the economic impact of President Donald Trump's aggressive tariff measures, coupled with ongoing geopolitical instability, continue to enhance the appeal of safe-haven assets. In this environment, the overall trend of gold remains biased to the upside, prompting traders to remain cautious when considering bold shorts.
📊Comment Analysis
Continue to consolidate, the price range fluctuates around 3300
💰Strategy Package
Long position:
Actively participate at 3282 points, profit target around 3320 points
Short position:
Actively participate around 3320 points, profit target around 3300 points
⭐️ Note: Labaron hopes that traders can properly manage their funds
- Choose the number of lots that matches your funds
- Profit is 5-10% of the fund account
- Stop loss is 1-3% of the fund account

Oscillating downward! The bearish trend is beginning to emerge!【Gold Analysis】
Interpretation of news: The current market presents a "three-legged" pattern: First, the uncertainty of the trade war. If the US insists on imposing new tariffs, the gold price may hit the $3,500 mark again; second, the suspense of the Fed's policy. Whether the May meeting will release a signal of interest rate cuts will become a key turning point; finally, the trend of the US dollar. If subsequent economic data continues to deteriorate, the US dollar index may fall below the 99 integer mark. The current gold market is caught in a fierce game of long and short factors. In terms of the trade war, the situation is not as good as Trump's remarks. The Asian giant issued a solemn statement on Thursday, emphasizing that if the US is sincere about solving the problem, all unilateral tariffs should be immediately cancelled. This statement is in sharp contrast to the "negotiation signal" recently released by the White House, making the trade outlook more confusing.
The current market sentiment is cautiously optimistic. On the one hand, Finance Minister Bensont's statement that the trade confrontation may continue has triggered a rise in risk aversion; on the other hand, the expectation that the Fed may cut interest rates has provided fundamental support for gold. This complex psychology is the main reason why the price of gold fluctuates in the range of 3260-3500 US dollars. There is one last trading day this week. Let's see how this week ends.
From the daily chart of gold, after the exaggerated reversal in the middle of the week, the current price of gold has not only lost the important support of 3350, but also formed an obvious bearish evening star in terms of shape, which means that there may be further correction space in the future. In addition, at this stage, the short-term moving averages MA5 and MA10 have been broken one after another, so it is not ruled out that they will continue to move closer to MA20, but their position is still below 3200.
From the 4-hour chart of gold, although it once fell nearly 200 US dollars from the high, the price of gold gradually stood firm yesterday and began to fluctuate and rebound. It has now returned to above 3270. However, given that the moving average group is in a sticky state and the MACD indicator is adjusted to near the 0 axis, the short-term long and short competition may become more intense. Therefore, it is recommended to keep selling high and buying low as the main strategy, which is more stable. Pay attention to the resistance of 3370-3375 on the top and the support of 3285-3280 on the bottom;
Investment strategy: short gold at 3310-3320, target 3265.

Gold's decline under pressure is in line with expectations! Gold market trend analysis:
Gold technical analysis: This week, gold prices fluctuated, opening at 3332. So far, the high is 3500 US dollars and the low is 3260 US dollars. On Monday, it soared by 100 US dollars. On Tuesday, it continued to rise to 3500 highs in the Asian session and then fell back. On Tuesday and Wednesday, it plummeted by nearly 240 US dollars. The volatility slowed down on Thursday. The overall intraday fluctuations remained within 3367-3288. Today, the weekly line closed. The weekly line will compete for the closing of the Yin-Yang cross K line. The short-term is more intense. From the consolidation on Thursday, there is no further decline, which also leaves room and suspense for today's weekly closing. If the weekly line closes lower, it is expected to adjust further next week. Pay attention to the closing strength and weakness of the weekly K line this week.
Today's opening trend of the gold market is like yesterday. The Asian session started the upward mode, rising all the way to around 3370 US dollars. However, it encountered strong resistance here, and then turned downward and started a decline. It is worth noting that today's gold price not only failed to break through this key resistance level, but also fell below the low hit in yesterday's European and American sessions, falling to a low of US$3,287 before rebounding.
In view of the important trend of gold price breaking the key point, the market will most likely continue the short-selling idea in the future. From the current market structure, the position of $3260 has become the focus of the market. Investors need to pay close attention to whether the gold price can reach or even fall below this point. Once it effectively falls below, the short-selling trend will be further strengthened, and the market may usher in a deeper adjustment.
From the hourly level, yesterday's low was at $3306, and the rebound just now showed an obvious stop signal at this position. Based on this, the current short-term suppression level can refer to $3315, and the upper level is $3328. For short-term investors, you can consider waiting for the gold price to rebound to around $3315 to arrange a short order and continue to be bearish on the gold price. The first thing to pay attention to below is the support of the low point just touched at $3287. If this support level is lost, the next key support level will be $3260, the first low point on the previous downward journey. If $3260 is also effectively broken, the short-selling force will be further released, and the gold price may face a larger decline. On the whole, today's short-term operation strategy for gold is to short on rebound and long on pullback. The upper short-term focus is on the 3315-3320 resistance line, and the lower short-term focus is on the 3285-3260 support line. Friends must keep up with the rhythm.
Gold operation strategy reference: short gold rebound near 3310-3320, target near 3290-3285, break to see 3260 line.
Gold pullback near 3270-3260 long, target near 3290-3310, break to see 3330 line.

Analysis of the latest gold price trends!Market news:
In the early Asian session on Friday (April 25), spot gold showed a trend of rising and falling. The London gold price hit a high of $3,370/ounce and then fell back to around the 3,350 mark for consolidation. The international gold price soared by more than $60, shaking off the shadow of the previous day's nearly 3% collapse. The weaker dollar and bargain-hunting provided support, and investors still kept a close eye on the latest news of tariff negotiations. It is worth noting that on Tuesday, the price of gold once soared to a record high of $3,500, mainly due to the market panic caused by Trump's threat to remove Federal Reserve Chairman Powell. However, as Trump suddenly "softened" on Wednesday, not only withdrawing the threat of removal but also sending a signal to ease the trade dispute, the gold price quickly fell back. Subsequently, the Asian power fought back strongly, explicitly demanding that the United States cancel all tariffs and clarifying that trade negotiations had not yet begun. This statement once again ignited market risk aversion. Trade uncertainty and a weak dollar, gold prices ended their previous two-day decline on Thursday and climbed above $3,300/ounce. The sharp drop in U.S. Treasury yields also supports the rise in international gold prices. This trading day, we will continue to pay attention to the IMF-World Bank Spring Meeting attended by global financial leaders. In addition, we will pay attention to news related to the international trade situation and geopolitical situation. As a traditional safe-haven asset, the demand for gold has dropped sharply, and the price has lost support and started to fall. For participants in the gold market, the impact of this price plunge is self-evident. The stock prices of gold mining companies have fallen accordingly, and the production capacity that was expanded in the early stage due to the rise in gold prices may face the risk of shrinking profits; jewelry retailers are in a dilemma. The value of gold inventory purchased at high prices has dropped significantly. If the selling price is adjusted, they are worried about affecting sales performance. For ordinary investors, especially retail investors who have recently chased high prices to buy gold, they are under tremendous psychological pressure and asset losses.
Technical Review:
Gold 1-hour moving average is still in the form of dead cross selling arrangement, and gold fell back after rising, so gold is now beginning to fluctuate. Although gold broke through yesterday's high of 3367, gold did not rise directly after breaking through, but rose and fell, so gold buying may just be a false break of yesterday's high of 3367. For the time being, gold is still fluctuating in a large range!The hourly moving average is glued together, the RSI indicator is adjusted in the middle axis, and the price hourly chart is running strong in the middle and upper track of the Bollinger band. The gold price in the four-hour chart is still running in the middle and lower track of the Bollinger band, the middle track is suppressed at 3375, and the RSI indicator is also adjusted in the middle axis. In the short term, gold is likely to continue to fluctuate in a wide range, and the band still maintains the main layout of selling at high prices and buying at low prices.
Today's analysis:
The wave peaked at 3500 and hit a low of 3260 in the US market on Wednesday. It fell by 240 US dollars in two trading days this week. The force was very strong and the trend was very panic. However, the big cycle of gold this year is still a buying trend. Don't be affected by the adjustment of the small cycle. In the bullish rhythm, the adjustment is an opportunity to buy. Therefore, once the adjustment is over, you can start buying bullish.From a technical point of view, the daily line stands firmly above the 10-day moving average, which is an important reason for the current strong unilateral trend of gold. For the time being, the daily mid-term Bollinger has not closed. Don't guess the top when it rises. Look at 3400 first, then look at the gains and losses of 3500. Don't guess the high when it breaks. The performance of the H4 mid-term is obvious. The bottom is above the lower Bollinger track and the 60-day moving average, and the Bollinger just closes. This is a very obvious performance of stopping the decline and bottoming out. Now the Bollinger is closing. From 3260, it will take at least 3500 to the upper Bollinger, so this range is very large! If gold breaks through the 3370 level again, then gold will truly become strong. Even if it is a fluctuating rise, we must patiently wait for the opportunity to continue to fall. The market is changing rapidly, and the recent gold market is like this, with ups and downs, so it is not surprising. Therefore, don’t think that gold has reversed after a wave of increases.
Operation ideas:
Buy short-term gold at 3322-3325, stop loss at 3313, target at 3360-3380;
Sell short-term gold at 3383-3386, stop loss at 3395, target at 3320-3330;
Key points:
First support level: 3332, second support level: 3320, third support level: 3300
First resistance level: 3370, second resistance level: 3386, third resistance level: 3408

XAU/USD(20250425) Today's AnalysisTechnical analysis:
Today's buying and selling boundaries:
3334
Support and resistance levels:
3413
3384
3364
3304
3285
3255
Trading strategy:
If the price breaks through 3364, consider buying, the first target price is 3384
If the price breaks through 3334, consider selling, the first target price is 3304

Falling into range oscillation, just get the rhythm pointAnalysis of gold market trend
On Thursday, the gold price remained in the 4H channel, and the middle and lower tracks were in the range of 3370-3260, with overall resistance to decline and correction; this trend is also normal;
1: In the early stage, the market fluctuated rapidly with a hundred points rise and fall, and the kinetic energy consumption was large, so the short-term trend returned to the consolidation trend later;
2: The fundamentals stopped, the technical demand was corrected, and the two resonated, and the gold price could only fluctuate and consolidate in the range; the analysis framework given yesterday was treated according to two intervals; they were 3370-3260 and 3370-3480; the strong and weak dividing point was 3370 above and below;
We can also see that at the position of 3370, the gold price has been under pressure for 2 consecutive times and fell for 2 consecutive times; it can be seen that the strong and weak dividing point of the position above and below 3370!
At present, the market:
1: Trend: There is no trend for the time being, and the range is high, the large range is 3480-3260; the bull trend is stagnant, and the bear trend stops falling. The trend cannot be judged for the time being;
2: Fundamentals, the future fundamentals will focus on the US debt crisis, trade war tariffs, and subsequent war issues, two core things; and uncertain fundamentals
Today's market:
1: 4 hours, the stochastic indicator golden cross, the main long signal; in terms of form, slow bull rise; the current pressure position of the central axis is near 3370, and the probability of breaking upward is relatively high; therefore, the 4-hour can be treated as a shock rise; but the overall situation remains in the large range of 3480-3260!
2: In the daily K-line, the stochastic indicator diverges periodically, and the death cross is downward, which is a bearish signal; however, the high-level sell-off forms a sideways resistance to the decline, and the sideways support is in the range of 3280-3260; the MACD double-line golden cross is glued, and there is no death cross; the indicators in the daily K-line are contradictory, so the long and short trends are difficult to continue, and more range oscillations and high-level consolidation signals are given;
To sum up: Today's short message is still processed according to the 4-hour range; 3370-3260 range and 3370-3480 range; if it stabilizes at 3370, the range processing will be changed; you can take a pullback to do more, and bet on the 4-hour range oscillation upward, and gradually break through the position of 3370;

Gold remains volatile, good opportunity for two-way operation
💹Fundamental analysis
Recently, many Fed officials have called for patience.
Regarding tariffs, they have repeatedly emphasized that although the increase in import costs has pushed up prices, the high prices are caused by shrinking consumption, declining employment and shrinking family wealth.
The final inflation increase may be lower than market expectations.
Is the current Fed in a dilemma?
On the one hand, we need to guard against economic downturn, and on the other hand, we need to be vigilant about inflation caused by tariff policies.
📊Comment analysis
On Thursday, the gold price rose rapidly to $3,365 in the Asian session, and then the European and American sessions were dominated by fluctuations. The current market fluctuations are not large, mainly based on corrections. This is also a temporary rest since the gold price plummeted from $3,500, giving everyone the opportunity and time to reorganize their ideas.
In addition, gold hit $3,370 again in the Asian session today. Recently, the Asian session is obviously larger than the European and American sessions. The main fluctuations are collectively in the Asian session. Whether this rebound will form a reversal depends on the breakthrough of $3,385. The bull market in the big direction has not encountered a breakout. What we need to pay attention to every day is the current intraday fluctuations, not the medium- and long-term layout.
💰Strategy Package
Long position:
Actively participate at 3,300 points, with a profit target of around 3,340 points
Short position:
Actively participate at around 3,360 points, with a profit target of around 3,320 points
⭐️ Note: Labaron hopes that traders can properly manage their funds
- Choose the number of lots that matches your funds
- Profit is 5-10% of the fund account
- Stop loss is 1-3% of the fund account

How to break through the gold shock patternOperation suggestionsTechnical analysis of gold: The current gold price is in a stalemate stage of long-short game. On the one hand, the path of the Fed's easing policy has been basically clear, and the US dollar is facing correction pressure; on the other hand, the stable global risk sentiment and the strong performance of the stock market have weakened the attractiveness of gold as a safe-haven tool. The repeated signals of global trade negotiations have also made the market direction unclear. From a technical point of view, gold has received support after the correction to the 26.3% Fibonacci retracement level near 3317 this week, and has returned to above $3,300 in the short term. The upper resistance focuses on the position of 3380. Once it breaks through, it will open up the space leading to the 3400 mark.
From the daily chart of gold, yesterday's gold price fell sharply and recorded a large real body Yin line K-line pattern. The peak pattern of the previous price high is more obvious, suggesting that the upper pressure effect is strong. The MACD indicator double line began to turn downward, increasing the risk of further correction in the short term. However, the MA5 and MA10 moving averages have not turned downward yet. You can pay attention to the support and defense of the moving average. From the 4-hour gold chart, the gold price has been fluctuating and falling since it came under pressure at the 3500 level. The current price has fallen back to the 3260 level, with a short-term decline of 240 US dollars. Although there has been a rebound during the day, the upward trend has been destroyed. The MACD indicator has issued a dead cross signal, suggesting that the correction trend may have started.
Gold fell after rising in the Asian session, and fell below the support levels of 3351 and 3330. Now the market rebounded near 3314, which is also in line with our analysis of the long and short trends. In the big trend, the gold rally did not exceed 3380, so there is still a downward demand, that is to say, it can only be regarded as a rebound during the decline. In the short term, this wave of gains stopped at 3367. Now it broke through 3351 and pierced 3316 to rebound. The main focus on the upper side is the support-to-resistance level of 51, followed by 3342. Specifically, you can wait for the area near 3345 to go short and see the gold price break the previous rebound low of 3314 to 3300. If it breaks down effectively, you can move the protection loss down to see the position of the rebound turning point of 3283 and 3260. On the whole, the short-term operation strategy of gold today is to short on rebound and long on callback. The short-term focus on the upper side is 3350-3370 resistance, and the short-term focus on the lower side is 3300-3280 support.

Gold fluctuates and is under pressure, the trend is bearish!Gold market trend analysis:
Gold technical analysis: Gold fell by $240 in two trading days, but the rebound was also very strong, from yesterday's low of 3260 to 3367 in the early trading. The current volatility is still large, and the high and low points of $100 often appear. It is normal to fluctuate by dozens of dollars at random. So pay attention to the market. There is no shortage of opportunities. Just grab what you can grasp.
From a technical perspective, yesterday's closing was negative, slightly piercing the MA10 moving average, and losing the trend support line mentioned yesterday. Originally, today's technical theory should continue to be under pressure from the MA5-day, and the rebound confirmed that trend line, which can continue to be bearish, that is, 3338-40; but today's Asian session saw a strong wave of upward rush, reaching 3367 directly, which was quite unexpected. It was basically stimulated by short-term risk aversion news, and then it began to rise and fall, and then returned to below 3340; as long as the closing cannot break through and stand above the MA5-day resistance, it is still in a downward adjustment; today, it is still bearish, and the gold layout long orders were successfully harvested at 3316. Gold rebounded to 3343 and continued to be short. Gold fell again and harvested, and won two consecutive victories again. At present, the gold rebound is limited, and the US market rebound is still short.
Gold's 1-hour moving average has formed a dead cross, so the moving average has not turned upward, so there is still downward momentum, and the rebound can continue to be shorted. After the Asian session hit a high and fell, gold rebounded several times and fell back under pressure near 3345. The US session rebounded below 3345 and continued to be shorted. It can still be shorted near the rebound of 3340. At present, gold is just a rebound. If there is no special risk-averse news, it is still difficult to go up directly. At least it must fluctuate first, and it is still bearish and volatile now. On the whole, the short-term operation strategy for gold today is to short on rebounds and to go long on pullbacks. The short-term focus on the upper side is 3368-3370 resistance, and the short-term focus on the lower side is 3260-3285 support. Friends must keep up with the rhythm.

Gold still has the risk of adjustment in the short termAnalysis of gold market trend:
From the daily level, gold rose strongly during the trading session on Tuesday, touched the key price of 3500, then fell under pressure and finally closed with a negative line. This trend of rising and falling shows that the selling pressure from above is heavy, and the bulls are strongly blocked by the bears at high levels. Then, gold continued to fall on Wednesday and closed with a negative line again, forming a technical pattern of two consecutive negative lines. This continuous decline further confirms that the short-term bears are dominant.
From the 4-hour gold chart, the gold price has maintained a fluctuating decline since it was under pressure at the 3500 line. The current price has fallen back to the 3260 line at its lowest, and the short-term decline has reached 240 US dollars. Although there has been a rebound during the day, the upward trend has been destroyed. The MACD indicator double line has issued a dead cross change signal, suggesting that the callback trend may have started. Pay attention to the pressure effect of the 3368 line during the day. For the current market, the rebound is just a flash in the pan, and it rebounded sharply again, reaching the highest point near 3367 and then retreated. It is currently maintained near 3330. In fact, the market is actually at a loss for long and short positions, and is simply unable to withstand its huge shocks. For the Asian session's highs and falls, we support it according to the shock retracement. For example, if the European session rebounds again near 3358-60, we will continue to try to short, with the target at 3320-10, and a loss of 3370. The market amplitude is so drastic that I need to strictly implement good operating habits, try with a light position, strictly stop loss, and don't have a fluke mentality! On the whole, today's short-term operation strategy for gold is to rebound and short, supplemented by callbacks. The short-term focus on the upper side is 3368-3370, and the short-term focus on the lower side is 3260-3285. Friends must keep up with the rhythm.

US policy news triggers huge shock in gold Analytical StrategyThe short-term 4-hour middle track 3380 line has been lost, becoming a key counter-pressure point. As long as the price cannot stand on this position again, it will maintain a downward correction trend. If it falls below 3292, the gains and losses of the 66-day moving average 3260 will be concerned. The 1-hour level K line is under pressure from ma10 and ma5 and continues to fall. After last night's consolidation and pull-up, the current K line has re-run above ma10, and at the same time, macd forms a golden cross below the zero axis. This wave of 200 US dollars of rapid exploration has almost corrected most of the overbought situation. If the price continues to fall, or with the help of bottom divergence, it will slowly brew a short-term bottom. Today's gold rebound reminds that attention should be paid to the resistance below 3340, and the limit is below 3356. If it is not under pressure, it will still be bearish adjustment. Strong support is at 3260 or 3245. After the position stabilizes, it will begin to consider bottom-fishing. For today's short-term operation of gold, it is recommended to focus on rebound shorting and supplemented by callback longing. The short-term focus on the upper side is 3350-3370 first-line resistance, and the short-term focus on the lower side is 3300-3280 first-line support.

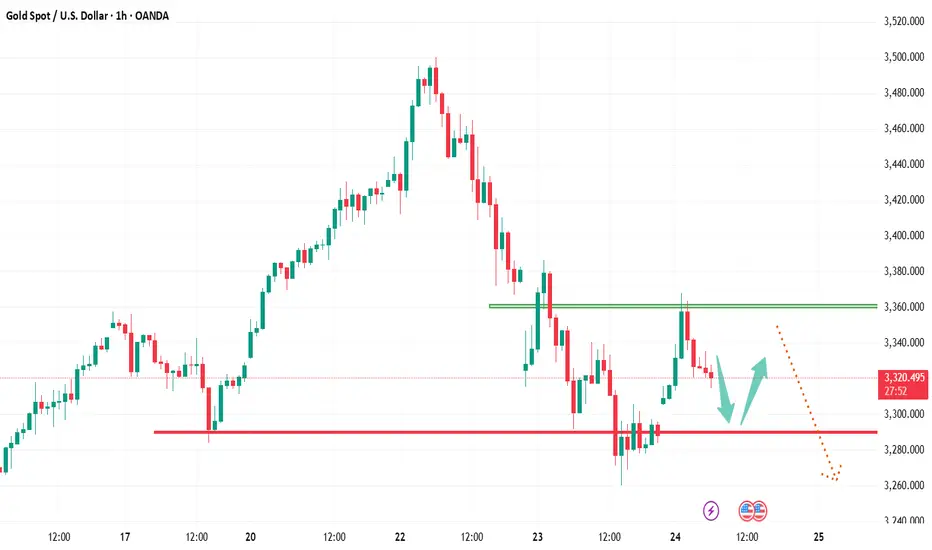
XAUUSD TRADE PLAN H1XAUUSD TF H1
SELL/SHORT PLAN (BASE AREA)
cancel if price break ma100(blue line) or break structure pattern
take profit max bos area (c) max correction wave price (3241-3200)

GOLD ( XAU:USD) : Potential Bearish Pennant + Correction WaveGood morning, traders.
Please note, this is Not Financial Advice (NFA) —always conduct your own research and risk management.
1. Technical Analysis
We are currently observing the formation of a potential bearish pennant, with price action consolidating between converging trendlines. This formation appears to align closely with the Elliott Wave correction structure, particularly within the A-B leg. The apex of the pennant lies just after wave (B), suggesting a potential breakdown into wave (C), completing the corrective sequence.
Should this pattern confirm, we could anticipate a continuation of the downward movement, targeting deeper support zones in line with previous wave (4) levels.
2. Trend Structure
Wave (5) appears to have completed, initiating the A-B-C correction.
The corrective leg A → B is now complete, with price action consolidating near the upper resistance of the pennant.
A breakdown below the lower support trendline could confirm wave C in motion, reinforcing the bearish outlook.
3.) Macro Environment & Market Sentiment
Recent developments from the U.S. administration have introduced uncertainty in macroeconomic policy:
Tariffs:
Former President Donald Trump has hinted at a potential rollback of the 145% tariffs on Chinese goods, acknowledging their long-term unsustainability. Treasury Secretary Scott Bessent clarified that any changes would be part of bilateral negotiations and not unilateral actions. Major U.S. retailers have raised concerns over ongoing supply chain disruptions, adding pressure to de-escalate trade tensions. However, Trump insists tariffs won’t be eliminated completely, signaling no immediate resolution.
Federal Reserve Leadership:
Trump also walked back earlier statements threatening to dismiss Federal Reserve Chair Jerome Powell, now affirming that Powell will serve out his term until May 2026 . While this move has slightly calmed markets, Trump continues to pressure the Fed to lower interest rates amid persistent inflationary concerns. Although this softening stance introduces a degree of stability, the underlying tension between fiscal and monetary authorities remains.

Gold may continue to fall in the short term
Trading sometimes does require some luck, but in the long run, good luck and bad luck will offset each other. To continue to succeed, you must rely on skills and apply good principles. Always remember; "Trading gold: half science, half art, all discipline."
📌 Driving events
The continued uncertainty of President Donald Trump's tariff policy and its broader impact on global economic growth have exacerbated market anxiety. These factors have triggered a new wave of safe-haven demand, pushing investors back into the gold market.
📊Commentary analysis
Gold prices are still facing selling pressure and are consolidating below the downward trend line. Trading prices are around 3,300 or lower.
💰Strategy Package
Short position:
Participate around 3320-30 points, profit target around 3290-80 points
⭐️ Note: Labaron hopes that traders can properly manage their funds
- Choose the number of lots that matches your funds
- Profit is 4-7% of the fund account
- Stop loss is 1-3% of the fund account
Thu 24th Apr 2025 XAU/USD Daily Forex Chart Sell SetupGood morning fellow traders. On my Daily Forex charts using the High Probability & Divergence trading methods from my books, I have identified a new trade setup this morning. As usual, you can read my notes on the chart for my thoughts on this setup. The trade being a XAU/USD Sell. Enjoy the day all. Cheers. Jim

Gold peaked and plummeted, entering a correction mode!Analysis of gold market trend:
Technical analysis of gold: Today, the highest price of gold is 3386, and the lowest price of US market is 3260, which is also a drop of 126 points. Although gold has continued its decline, it is not like yesterday. The decline is accompanied by a rebound. The trend of Asian market is a back and forth, and the trend of European market is also a back and forth. Needless to say, the US market fell after the opening and the current rebound, the overall rhythm is bearish, but it is not as clean as Tuesday. This trend reflects the opposition of market sentiment. After the risk aversion subsided, the gold price fell from the high of 3500, but after the long position was sold at a high level, some people still took over at a low level, so it led to a rebound trend after the decline.
Now from the daily chart, the daily K is likely to close with an upper shadow line as on Tuesday. Now the upper shadow line has been formed, so the closing price should be below the opening price of 3320. Now we need to pay attention to whether the lower shadow line can continue to spread downward. In other words, after this wave of rebound in the US market, there will be another wave of decline, and there will be a small rebound; returning to the short-term trend, in 1 hour, after the gold price fell below the two key positions of 3356 and 3285 today, the support moved down to around 3245. Although there was a rebound in the US market, it is likely to go to the range of 3228 to 3245 before rebounding, so the support references are 3260 and 3245; on the other hand, the resistance level, now the gold price pierces 3285 and then rebounds, and is now trading near this. The only reference is 3315 in the Asian session, and then up is the European session rebound high of 3340. If it is effectively crossed here, the bearish outlook will be suspended.
The direction of the end of the session is bearish. The steady operation is to intervene in short orders near 3320 to protect the area near 3330. Of course, you can intervene in short orders near 3310 to see if it can reach the range of 3260 to 3245. This is up to you. Even if it touches this range and rebounds later, I do not recommend participating in long orders. Overall, today's short-term operation strategy for gold is to focus on rebound shorting. The short-term focus on the upper side is 3315-3320 line resistance, and the short-term focus on the lower side is 3260-3245 line support. Friends must keep up with the rhythm.
