Gold price fluctuates! Gold operation guide!Market news:
In the early Asian session on Thursday (July 17), spot gold fluctuated in a narrow range and is currently trading around $3,341 per ounce. Rumors that Trump plans to fire Federal Reserve Chairman Powell caused violent market fluctuations. The US dollar once plummeted, and then narrowed the decline; while the London gold price gave up most of its gains after soaring. If Powell is fired in advance, it may be unfavorable to the US dollar, because it will shake the outside world's confidence in the US financial system and the safe-haven status of the US dollar.
Trump's repeated statements have caused the international gold price to experience violent fluctuations in a short period of time. The market's concerns about the independence of the Federal Reserve have become an important driving force for the rise in gold prices. However, geopolitical tensions still support gold prices. Israel launched an airstrike on Damascus, Syria on Wednesday, destroying the Ministry of Defense building, which is very close to the Syrian presidential palace. Trump's trade policy has further injected uncertainty into the gold market.
Technical Review:
The news that Trump's big mouth "considered replacing Federal Reserve Chairman Powell" caused violent fluctuations in the financial market. Although the storm subsided after Trump's denial, Wall Street has sounded the alarm. Rumors that Trump will fire Powell caused market volatility, and the US dollar index plunged and closed down 0.36% during the session. Spot gold was on a roller coaster ride, rising sharply from 3320 to 3377 in the late trading, then plunged back to 3336 and then rose again to 3357 before closing sideways around the 3350 mark.Technical daily chart structure alternates between positive and negative cycles to maintain the adjustment of the Bollinger band middle track, the indicator is neutral, the Bollinger band closes, and the RSI indicator is flat. The four-hour chart and hourly chart indicators are neutral. Affected by market news, the gold price alternates between long and short cycles and fluctuates widely, the moving average is glued, the RSI indicator middle axis is flat, and the Bollinger band is flat and closed. Gold maintains a wide range of fluctuations, selling at high prices and buying at low prices.
Today's analysis:
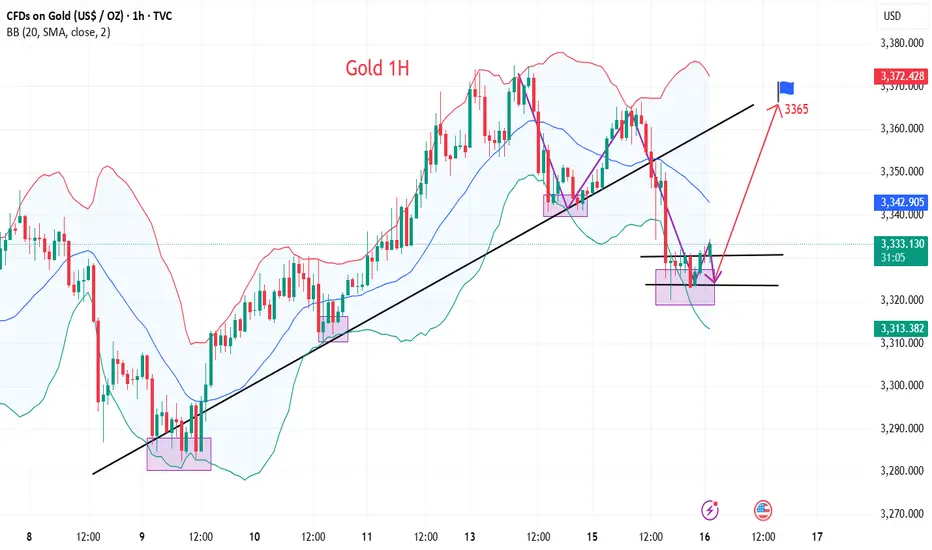
The gold market last night was quite exciting. In the middle of the night, Trump claimed that he would fire Powell. After the news came out, gold soared by more than 50 US dollars in a short period of time, but the market was only controlled by emotions in a short period of time. After all, the chairman of the Federal Reserve is independent, and Trump cannot have the right to fire Powell. Once the emotions passed, although gold fell sharply, it also pushed up the trend of gold prices to a certain extent! At present, after the strong rise of gold in 1 hour, it quickly fell back and closed with a long upper shadow line. The change in gold buying did not successfully stabilize. Then this market is actually a kind of catharsis of the news. The confidence of gold buying in directly rising again is not very sufficient. The gold 1-hour moving average is still in the form of dead cross selling. So gold rebounds or continues to sell.The gold 1-hour pattern excludes the influence of the upper shadow line stimulated by yesterday's news. In fact, the whole rhythm is still fluctuating and falling. The upper shadow time is not long, and it is probably just a temptation to buy. After the ups and downs of gold last night, it rebounded again to the 3360 line or continued to fall under pressure. So gold continued to rebound under pressure and continued to sell at high prices below 3360.
Operation ideas:
Buy short-term gold at 3325-3328, stop loss at 3317, target at 3350-3370;
Sell short-term gold at 3357-3360, stop loss at 3368, target at 3340-3320;
Key points:
First support level: 3330, second support level: 3319, third support level: 3303
First resistance level: 3358, second resistance level: 3370, third resistance level: 3386
Goldsell

XAU/USD(20250717) Today's AnalysisMarket news:
The annual rate of PPI in the United States in June was 2.3%, lower than the expected 2.5%, the lowest since September 2024, and the previous value was revised up from 2.6% to 2.7%. Federal Reserve Beige Book: The economic outlook is neutral to slightly pessimistic. Manufacturing activity declined slightly, and corporate recruitment remained cautious.
Technical analysis:
Today's buying and selling boundaries:
3348.05
Support and resistance levels:
3405
3383
3369
3326
3312
3290
Trading strategy:
If the rise breaks through 3348, consider entering the market to buy, the first target price is 3369
If the fall breaks through 3326, consider entering the market to sell, the first target price is 3312

GOLD BEARISH 90%Hello,
I see a very high probability that the gold market will fall in the short term.
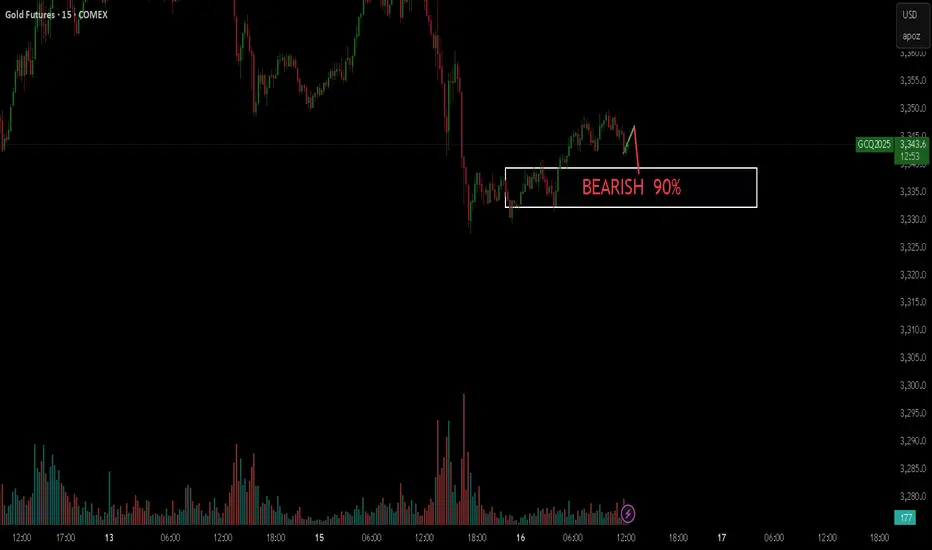
The rebound is not a reversal, continue to shortGold showed a trend of rising and falling back and closing low on Tuesday. The highest intraday rise was 3366, and the lowest fell to 3320. The daily line recorded a medium-sized Yin line with a long upper shadow. The K-line was negative, and the closing line broke the resonance support of the middle track and the short-term moving average, suggesting that the bullish momentum has slowed down and the bears are ready to move. Today, we need to pay attention to the further downward performance of gold. From the 4H level, the price stood firm at the four-hour resistance position last Thursday, and then rebounded upward in the short term. Yesterday, the price fell below the daily support level. Currently, the short-term market is bearish, and attention is paid to the resistance in the 3340-3345 range above. In the one-hour period, the price is in short-term shock adjustment. On the whole, it will be treated as a shock decline before breaking yesterday's low, and the lower side pays attention to the 3225-3320 area support. In the short term, you can consider shorting at 3340-3350 in the European session, and look towards 3330-3320
OANDA:XAUUSD
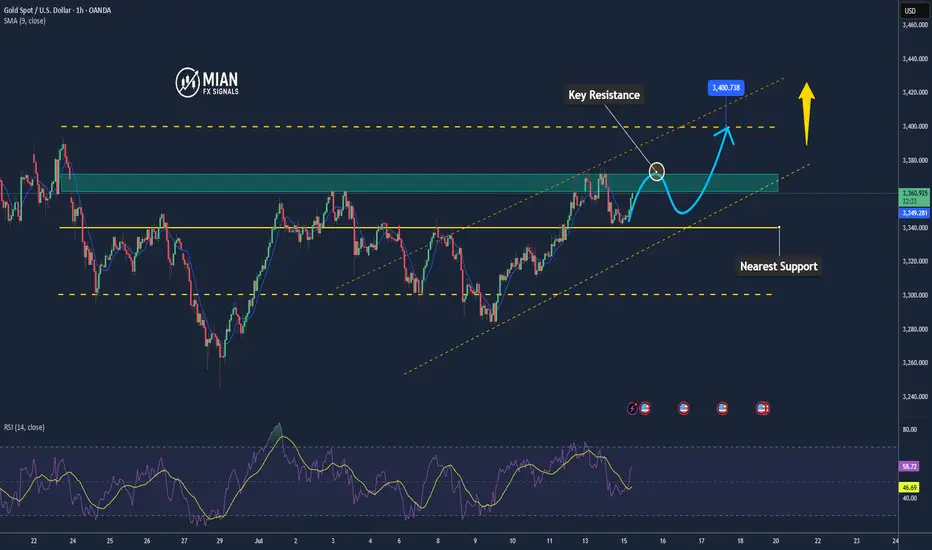
Gold Holds Key Support Zone📊 Market Summary
– Gold is currently trading at $3,338/oz, hovering near a key technical support level.
– US Treasury yields remain elevated and the USD is strong, both pressuring gold; however, ongoing concerns over US–EU/Mexico trade tensions continue to support safe-haven demand.
– The market is awaiting the upcoming US PPI data to determine the next directional move.
📉 Technical Analysis
• Key Resistance: $3,372 – $3,375 (23.6% Fibonacci zone – short-term ceiling)
• Nearest Support: $3,338 – $3,330 (tested and bounced at 3,338 per Oanda); deeper support at $3,325 – $3,320 if broken
• EMA 9: Price is below the MA20/50/100 but above MA200 (H1); EMA9 is flat, suggesting a sideways/consolidation trend
• Momentum / Indicators:
• RSI around 44–52 – neutral to slightly bullish
• MACD slightly positive; Stochastic above 50, hinting at short-term overbought conditions
📌 Outlook
– Gold is holding above the 3,338–3,330 support zone. If this level holds and rate-cut expectations strengthen, the price may rebound toward 3,372–3,375.
– However, if the USD continues to strengthen and PPI/CPI data surprises to the upside, gold could break support and head lower toward 3,325–3,320.
💡 Trade Strategy Proposal
🟣 SELL XAU/USD at 3,372 – 3,375
🎯 TP: ~ 40 / 80 / 200 pips
❌ SL: ~ 3,378
🟢 BUY XAU/USD at 3,330 – 3,333
🎯 TP: ~ 40 / 80 / 200 pips
❌ SL: ~ 3,327

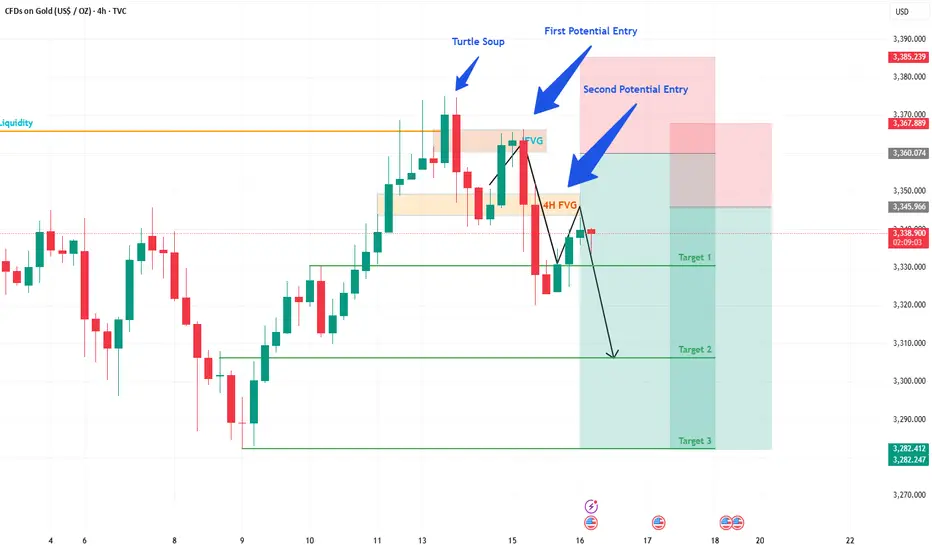
Gold Trade Update: Another Win & What's Next!Hey Fellow Traders! 👋
What a week for Gold! On Monday, I shared my Gold analysis and trade idea, pinpointing a key 1H FVG zone. And guess what? The trade played out perfectly! 🎉 The price dropped ~400 pips from our highlighted area with a tiny drawdown of just 30-40 pips. We smashed Target 1 (TP1), and the market even pushed beyond it! 🙌 Huge congrats to everyone who jumped on this trade! 💰
📈 What's Happening Now?
The price action is heating up! Gold has broken through the 4H FVG, which now acts as an IFVG. The price has retraced almost perfectly to this IFVG, triggering our second layer of entry. 🚦 This is a prime setup, and we’re eyeing TP1 again—and potentially beyond! 🌟
💡 What's the Plan?
Entry: Triggered at the IFVG retracement.
Target: Aiming for TP1, with room for more upside.
Stay sharp and manage your risk—let’s keep those drawdowns tight!
🗣️ Join the Conversation!
What did you think of this move? Did you catch the Gold trade? Drop a comment below, give this post a LIKE 👍, and FOLLOW for more trade ideas and updates! Let’s keep the momentum going and crush it together! 💪
#TradingView #Gold #PriceAction #TradingSuccess
Gold (XAU/USD) Trading Analysis for July 16Support Zone: The market has found support around the 0.5 Fibonacci retracement level at 3,333.58. This could be a potential entry point for a long trade if the price bounces here.
Resistance Zone: The price action is approaching the 3,345.18 level, with a strong resistance around that zone. If the price breaks above this resistance, we could see further upward movement.
Price Action: We can observe an initial bullish movement followed by a correction. The price is currently in an uptrend, forming a series of higher lows and higher highs.
Fibonacci Levels: The 0.5 level at 3,333.58 has already acted as a support zone, and if the price retraces back here, this could be a good opportunity to enter long positions. The 0.618 level at 3,336.32 serves as a key resistance point. If price breaks above this level, it could indicate a continuation of the bullish trend.
Bullish Scenario (Long Entry): If the price retraces back to the 3,333.58 area (0.5 Fibonacci level) and shows signs of support (such as bullish candlestick patterns), consider entering long with a target at 3,345.18.
Bearish Scenario (Short Entry): If the price fails to break above 3,345.18 and forms a reversal pattern, you could consider shorting with a target near 3,320.
Risk Management:
Stop Loss: Place a stop loss just below 3,330, allowing for a small margin of error in case the price breaks through the support level.
Take Profit: Consider setting a take-profit at 3,345.18 for short-term moves or look for further price action if you're aiming for a longer-term trend.
Reminder: Always monitor the price action closely and adjust stop losses accordingly. The market is subject to volatility, especially during high-impact news events, so make sure to stay updated.

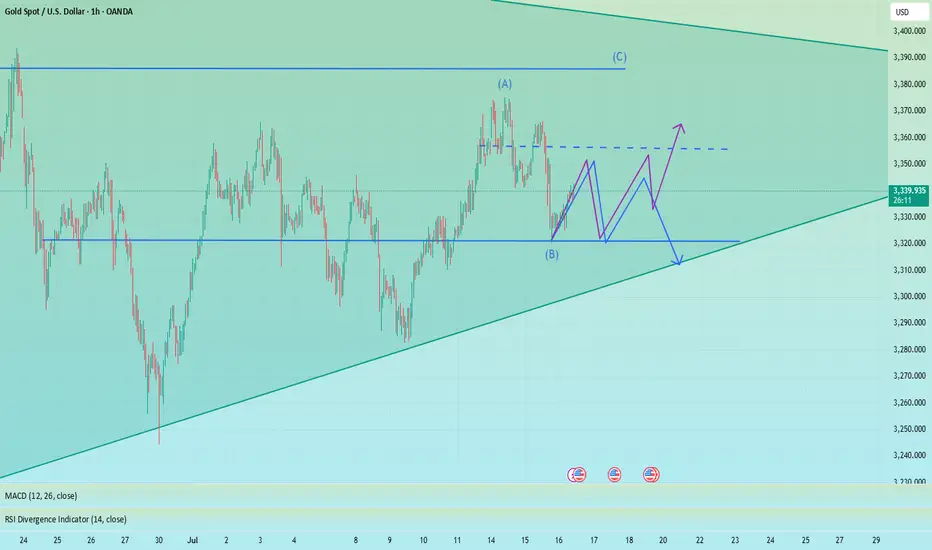
Gold Price Analysis Bullish Continuation PossibleBullish Trend Formation: We see a series of higher highs and higher lows forming on the chart, suggesting a potential continuation of the bullish trend. However, the market has recently pulled back from the previous peak at 3,340.69, which is now being tested as support.
Fibonacci Retracement Analysis:
The current pullback has reached the 0.5 level around 3,334.32, a strong support zone. This area could offer a potential long entry if the price reacts positively from here.
The 0.618 Fibonacci level at 3,335.82 is also significant, often acting as a final retracement level before the market continues its bullish move.
Support Testing: If the price holds above the 0.618 level, we could expect a price rally towards the resistance at 3,372.00, with possible extension above it.
Trend Continuation: If the price breaks below 3,335.82, consider watching for further downside potential with the next target being the 0.5 level, near 3,334.32.
Trade Strategy (Buy on Support):
Entry: Around 3,334.32 or 3,335.82 (depending on price action confirmation).
Target: 3,340.69 (next resistance zone).
Stop-Loss: Set just below the 0.5 Fibonacci level around 3,327.95 to manage risk effectively.
The current chart is showing a potential for a bullish continuation, with key support levels at 3,335.82 and 3,334.32, backed by Fibonacci retracement. Watching the price action around these levels will be crucial for entering a potential buy position.
Remember to adjust your strategy based on the actual market movements and confirm the trend with price action before making a trade.

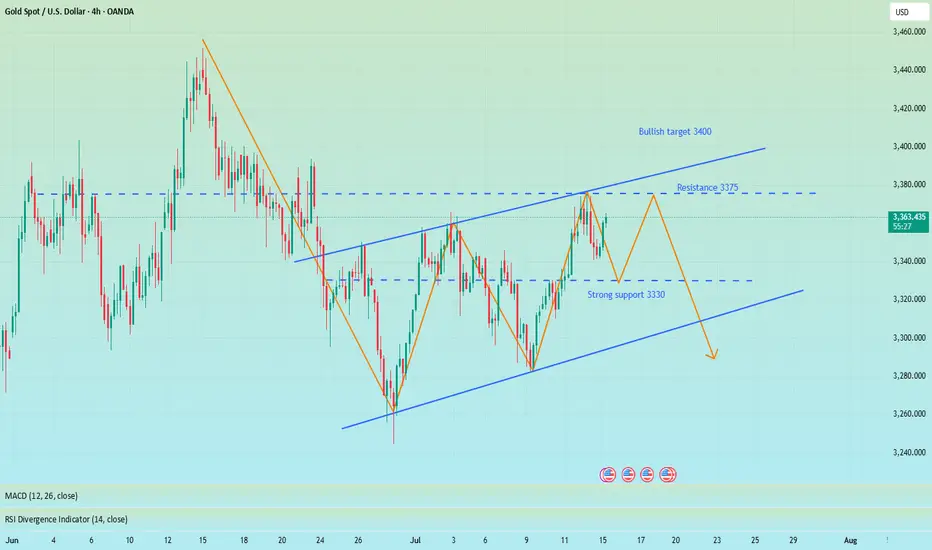
Gold fluctuates downward. Can it break through?The CPI data released is in line with expectations, the tariff storm is still continuing, inflation rebounds and the Fed's expectations of interest rate cuts have cooled. Gold rebounded to 3366 and then fell, and is currently fluctuating around 3330.
From the current trend, gold fell strongly and broke through the Bollinger middle rail and the moving average support. The daily line focuses on the Bollinger middle rail under pressure near 3340, and the short-term support is at 3310. At present, a staged top pattern has been formed and the K-line double top is around 3366. The Bollinger moves downward and the price is in a downward channel.
For short-term operations, Quaid believes that the strategy of rebound shorting can still be followed.
Short near 3345, stop loss 3355, profit range 3330-3310
Long near 3310, stop loss 3300, profit range 3330-3345
Gold fluctuates and moves lower! Gold price falls!Market news:
In the early Asian session on Wednesday (July 16), spot gold fluctuated slightly higher and is currently trading around $3,330/ounce. After the release of US inflation data, the market's focus shifted from macro data and interest rate prospects to policy risks again. The US dollar index strengthened by 0.6%, which also exacerbated the short-term pressure on London gold prices!
Although gold prices have shown a downward trend in the short term, market sentiment has not completely turned to pessimism. The uncertainty of tariff policies may provide support for gold prices. We are still optimistic about the long-term trend of gold, and the market's attention to tariffs will drive international gold prices to rebound in the future.
Next, investors will focus on the US Producer Price Index (PPI) to be released on Wednesday, as well as speeches by Fed officials to assess policy trends. Many institutions believe that in the context of intensified global policy games and increased volatility of the US dollar, the importance of international gold as a safe-haven and anti-inflation asset is still increasing.
Technical review:
Gold hit a high of 3,366 yesterday and was blocked and fell back. It broke down to 3,320 during the US trading session and closed with a long shadow on the daily line. Today, the trend is to continue to fluctuate, and there should not be much room below. The current support level is near the daily MA5 and the middle track. The next step is still the focus. If you want to rise, you can't go down here. If you go down, you will continue to sweep back to 3320 and 3300!
The daily line maintains a continuous negative structure. The further strengthening of the US index puts gold and silver under downward pressure. The gold price on the daily chart returns to below the MA10 daily moving average, the New York closing plus the 5/7-day moving average, the RSI indicator middle axis is flat, and the price is running in the middle and lower track of the Bollinger band. The four-hour chart and the hourly chart moving average cross open downward, the RSI indicator runs below the middle axis, and the Bollinger band hourly chart opens downward and runs in the middle and lower track of the price. The gold trading idea remains unchanged with the high-price selling layout as the main layout, and the low-price buying is auxiliary.
Today's analysis:
Gold has been very weak in the past two days, and it has been going up and down. Gold finally fell as expected yesterday. Gold won three consecutive victories yesterday. Gold bought at a high level and failed. Gold will be sold again next. Gold rebounded in the Asian session and continued to sell.
Gold's 1-hour moving average has also begun to turn downward from a high position. If the gold's 1-hour moving average forms a dead cross downward, the downward momentum of gold will increase, and gold still has room to fall. Gold fell below the previous double bottom support of 3346 in the US market yesterday. Now gold's 3346 short-term has begun to turn into resistance. Gold is under pressure at 3346 in the Asian market and continues to sell at high prices.
Operation ideas:
Short-term gold 3310-3313 buy, stop loss 3302, target 3340-3360;
Short-term gold 3346-3349 sell, stop loss 3358, target 3320-3300;
Key points:
First support level: 3320, second support level: 3308, third support level: 3292
First resistance level: 3346, second resistance level: 3360, third resistance level: 3376

Beware of false decline and real rise of gold
💡Message Strategy
On Tuesday, the dollar index continued to rise, eventually closing at a high of 98.68, after a mild inflation report sparked speculation that the Federal Reserve might keep interest rates unchanged for the time being.
Spot gold gave up its intraday gains after the release of CPI data, once touching the $3,320 mark, falling for the second consecutive trading day.
📊Technical aspects
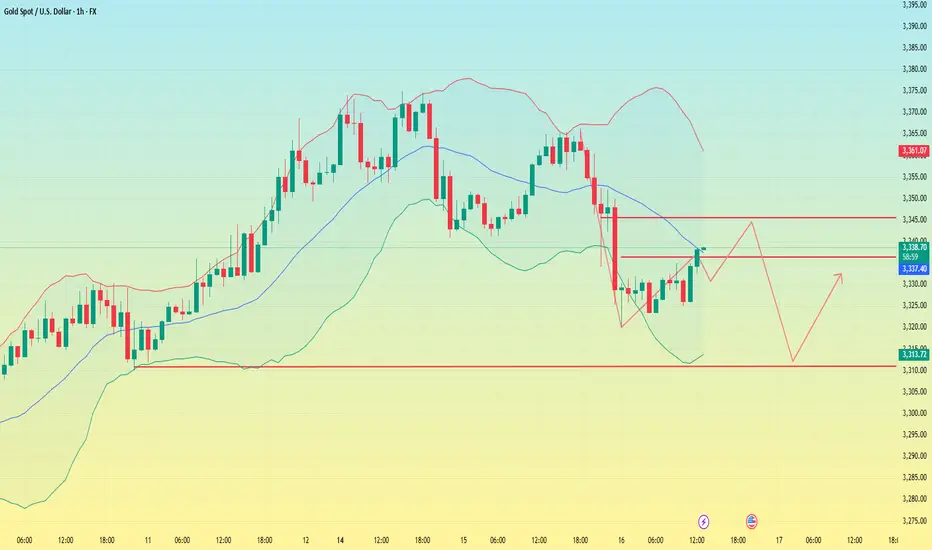
In the hourly chart, gold has already touched the support trend line overnight.
Therefore, at present, it may be inclined to rebound, and gold still maintains an upward trend as a whole.
However, the upper 3340-45 is a short-term suppression position. If it cannot stand firm and break through 3340-45 today, it is not ruled out that it will continue to maintain 3320-40 for consolidation.
On the contrary, as long as it can stand firm above 3345 today, then gold will really rise in the future.
It is very likely that the high point of 3375 at the beginning of this week may be refreshed.
Therefore, in terms of operation, I suggest paying more attention to 3320-30. After all, 3320 is the overnight low. As long as it is not broken again, the probability of gold rising is very high.
However, if it falls below 3320 again today, it is not ruled out that it will continue to refresh the low.
💰Strategy Package
Long Position:3320-3330,SL:3305,Target: 3365

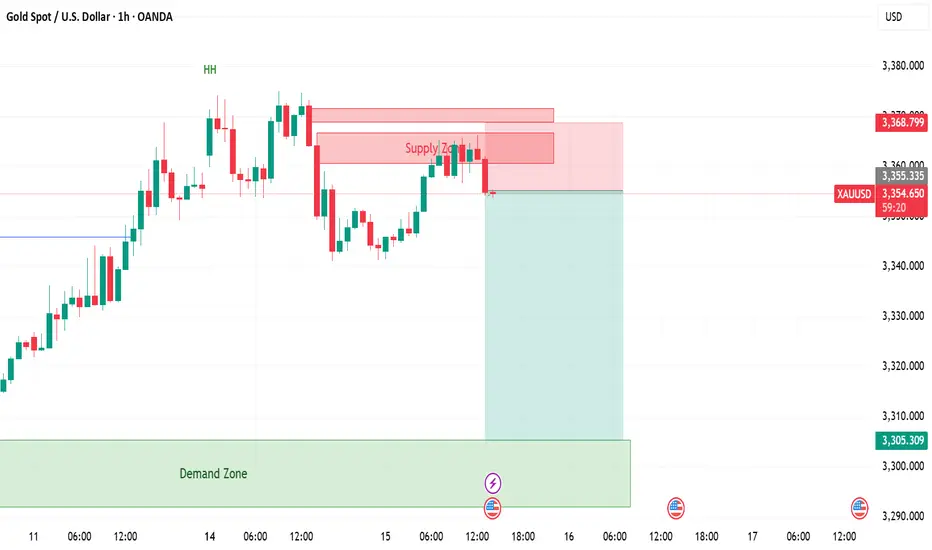
Gold Trading Update: What's Next for Gold This Week? Hello Traders! 👋
In my last post, I flagged two prime zones for selling Gold, and guess what? The first one has already delivered! 🎯 The Hourly IFVG (Inversion Fair Value Gap) between 3360-3365 triggered perfectly before today's CPI release, playing out like a charm. 💰
Now, all eyes are on the next level: the 4H FVG, which will act as an IFVG. This is our second potential entry point, and I’m targeting the Take Profit levels as outlined. Let’s see if this setup unfolds as beautifully as the first! 👀
What’s your take on Gold’s direction this week? Are you bullish, bearish, or sitting on the fence? 🧠 Drop your thoughts in the comments below, and let’s spark some lively discussion! 💬 Don’t forget to like, follow, and share your views to keep the trading community buzzing! 🚀

Gold Likely to Extend Gains as USD Weakens, but Faces Resistance📊 Market Move:
Gold surged to a three-week high near $3,370/oz, driven by safe-haven demand amid renewed trade tensions between the U.S. and EU/Mexico and threats of a 100% tariff on Russian imports.
Investors are now focused on upcoming U.S. CPI data, which could trigger sharp moves if inflation comes in below expectations.
📉 Technical Analysis:
• Key Resistance: ~$3,365–$3,372; a breakout could open the way to $3,400–$3,440
• Nearest Support: ~$3,340 (S1), then ~$3,326 (SMA50), and deeper at $3,300–$3,320 (Fibonacci zone)
• EMA: Price remains above short-term EMAs (20/50/100), suggesting a continuing bullish bias
• Candlesticks / Volume / Momentum:
• RSI is neutral-to-bullish around 54; MACD shows strengthening bullish momentum
• Bollinger Bands are narrowing, signaling potential for a breakout
📌 Outlook:
Gold may continue edging higher or consolidate around the $3,365–$3,372 resistance zone if no new geopolitical shocks occur. However, if U.S. CPI comes in below expectations or if USD/Yields weaken, gold could rally further toward $3,400–$3,440.
________________________________________
💡 Suggested Trading Strategy
🔻 SELL XAU/USD at: $3,370–3,373
🎯 TP: 40/80/200 pips
❌ SL: $3,376
🔺 BUY XAU/USD at: $3,340–3,337
🎯 TP: 40/80/200 pips
❌ SL: $3,334
XAUUSD | GOLD | SellGot the confirmation from 15 minute timeframe.
Sell Gold till demand zone.
R:R 1:3,8
Gold to continue downward trendXAUUSD 1H chart post-CPI data: Current trend suggests a drop to 3,282 from 3,349.54. Watch support at 3,341-3,349; a break below could confirm. #Gold #Trading #XAUUSD #CPI

It is expected to fluctuate and fall before CPI data📰 News information:
1. Focus on tomorrow's CPI data
2. Bowman's speech at the Federal Reserve
3. Tariff information outflows and countries' responses to tariff issues
📈 Technical Analysis:
The 1H chart shows that the gold price continued to pull back last night and then fluctuated at the bottom, and continued the rebound trend this morning. The key pressure level is the top and bottom conversion level. The current rebound in gold is only a secondary confirmation of the top structure at the 30-minute level. After reaching 3365, it has shown signs of short-term pressure. In a volatile market, if the price begins to consolidate horizontally, it may indicate the end of this round of volatile upward trend, and it will enter a downward phase later. Considering the market sensitivity before the release of CPI data, it is recommended to focus on the volatile decline trend. After today's rebound, it is necessary to focus on the 3365-3368 area as a short-selling range, and the long-short defense position is set at yesterday's intraday high of 3375. The support below focuses on the 3350-3340 range.
🎯 Trading Points:
SELL 3358-3368
TP 3345-3333
In addition to investment, life also includes poetry, distant places, and Allen. Facing the market is actually facing yourself, correcting your shortcomings, facing your mistakes, and exercising strict self-discipline. I share free trading strategies and analysis ideas every day for reference by brothers. I hope my analysis can help you.
FXOPEN:XAUUSD TVC:GOLD FX:XAUUSD FOREXCOM:XAUUSD PEPPERSTONE:XAUUSD OANDA:XAUUSD
Gold – M15 Downtrend in Play | July 15 Analysis🔻 Gold (XAUUSD) – July 15 Analysis | Bearish Bias Until Proven Otherwise
The market has entered a pullback phase on H4, and we’re expecting a potential retest of the 3320 Order Block before any continuation of the broader uptrend resumes.
🔍 M15 Market Structure:
✅ ChoCH followed by BoS confirms a downtrend on M15
🎯 Current short-term objective: Retest of H4 OB (3320)
📍 Price Action Context:
Price is now revisiting the same M15 POI where yesterday’s short setup originated.
Last session, this POI was respected, but instead of creating a new Lower Low, price is trading inside the same zone again.
This signals indecision — so we let price reveal its intent
🧭 Trade Planning Scenarios:
Scenario 1 – Bearish Continuation:
→ If the POI is respected again with clear M1 confirmation ( Micro-ChoCH + BoS ), we will plan for a short setup toward 3320
Scenario 2 – POI Breaks:
→ If price breaks above this POI zone, the next key level to observe is the 3355–3359 supply zone
→ We’ll reassess from there based on new confirmation
📌 Bias for Today:
🔻 Bearish bias remains intact as long as M15 structure does not shift back to bullish.
All setups must align with structure — we are short-biased only until the market proves otherwise
📖 Structure before emotion. Let the market invite you — not the other way around.
📘 Shared by @ChartIsMirror

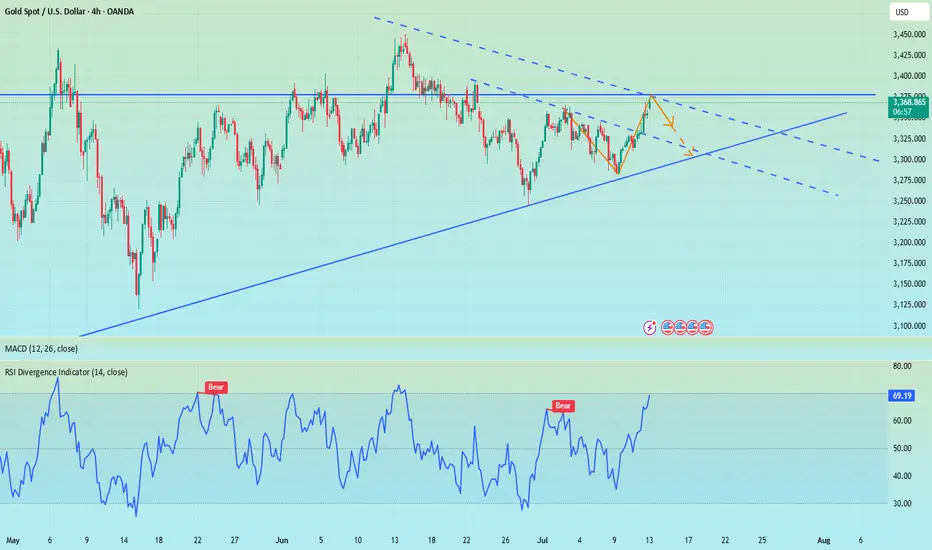
Beware of the market's trap of luring more investors, short 3335Regarding recent trading strategies, I believe you have also seen my trading win rate. I often inform the future trend of gold several hours or even days in advance, because my many years of trading experience have made me an excellent poisonous wolf in the trading market. Now I see a lot of bullish voices in the market, but my wolf’s sense of smell has discovered danger signals. In the short term, I think that without the influence of news, the market needs to digest the overbought momentum of the bulls. From the 4H chart, the middle track of the Bollinger Band is at 3332, which is very close to the strong support of 3330 given by us during the day. Therefore, I think that at least within 4 hours, gold will fall back to test the support below 3340-3330, or even 3320. Since most people want to follow the crowd, let them go. They will only fall into the trap set by the market. Let's prove with facts whether following the wolf pack will make you hungry or well fed.
OANDA:XAUUSD

Gold May Temporarily Correct Under Resistance Pressure📊 Market Overview:
• Gold reached resistance around $3,365–$3,370/oz before showing signs of cooling due to mild profit-taking.
• Ongoing trade tensions and geopolitical risks — such as President Trump’s tariff plan — continue to support safe-haven demand, driving gold close to a three-week high.
• Strong central bank purchases reinforce the long-term bullish outlook.
📉 Technical Analysis:
• Key Resistance: $3,365–$3,370
• Nearest Support: $3,300–$3,320
• EMA 09: Price is currently below the EMA 09, suggesting a potential short-term pullback. (Price is still above the EMA50, supporting the recent uptrend.)
• Candlestick patterns / Volume / Momentum:
o RSI near 57 – neutral but slightly declining.
o MACD and ADX remain bullish, indicating underlying strength but with possible short-term consolidation ahead.
📌 Outlook:
Gold may experience a short-term pullback if it fails to break through the $3,365–$3,370 zone and geopolitical tensions ease.
However, the medium-to-long-term trend remains bullish, especially as central banks continue to accumulate gold and global risks persist.
💡 Suggested Trading Strategy:
SELL XAU/USD: $3,363–$3,366
🎯 Take Profit: 40/80/200 pips
❌ Stop Loss: $3,369
BUY XAU/USD : $3,317–$3,320
🎯 Take Profit: 40/80/200 pips
❌ Stop Loss: $3,214
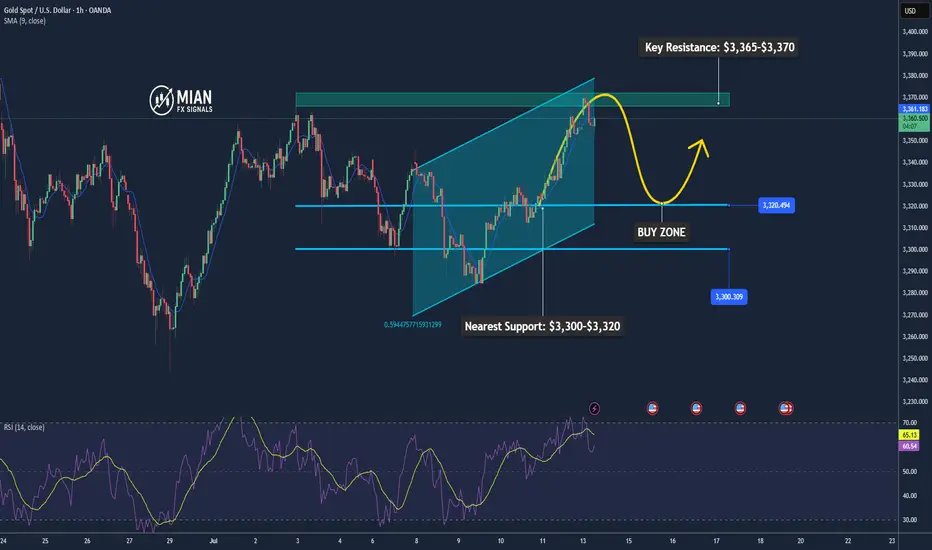
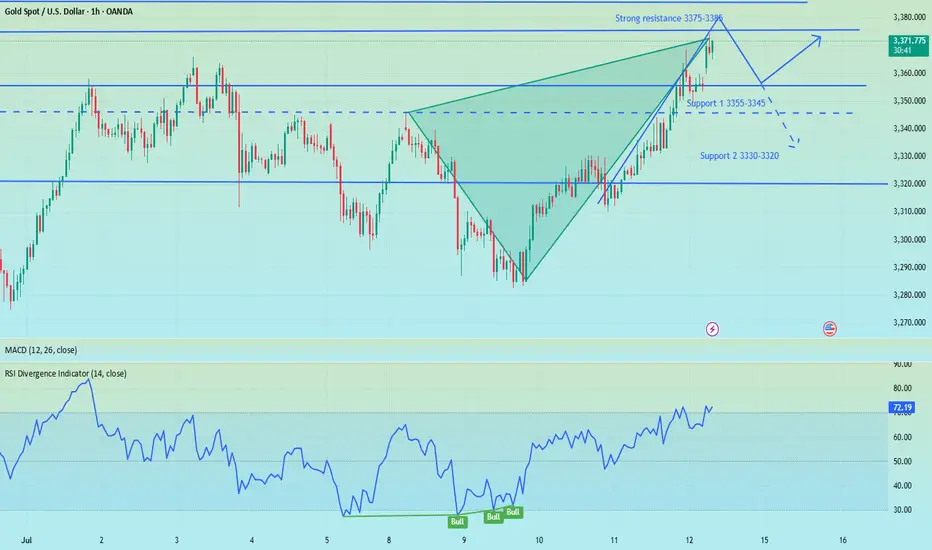
Gold gaps up and open higher,beware of going long at high levelsBros, the Asian session opened higher in the morning. Currently, gold is falling back to the SMA1O moving average. We will continue to be bullish after it falls back and stabilizes. At present, it has broken through the key resistance level of 3360. The daily line has shown a strong pattern of three consecutive positives. The gold price remains in the rising channel, and the bullish trend is obvious. As the gold price moves up, the short-term moving average moves up with it. At present, 3355-3345 constitutes an important support in the short term, and 3375-3385 above constitutes a short-term resistance area. Whether it can stand firmly above 3360 this week is the key.
Severe overbought in the short term, there are trading risks for long positions at high levels. Short-term operation suggestions for the Asian and European sessions: consider shorting when it touches 3365-3375, and stop loss when it breaks 3375. The target focuses on 3355-3345, and the breakout looks at 3330-3320. On the contrary, if it stabilizes at 3355-3345, you can consider going long.
The impact of tariffs continues, shorting is expected to retrace📰 News information:
1. Focus on tomorrow's CPI data
2. Bowman's speech at the Federal Reserve
3. Tariff information outflows and countries' responses to tariff issues
📈 Technical Analysis:
During the weekend, the Trump administration's tariff information continued to come out, causing a large amount of funds to flow into the safe-haven market, triggering an escalation of market risk aversion. Although the collapse in the previous tariff remarks did hit the market's buying enthusiasm to a certain extent, the strong rise on Friday also stimulated the market's buying enthusiasm again. This, whether it is on the way down or on the way up, has attracted retail investors to a certain extent. As we judged on gold on Friday and the weekend, short-term bulls are undoubtedly strong. However, I think it is very dangerous to continue to chase long positions at high levels. Therefore, I tend to short-term and then consider continuing to chase long positions after the market retreats to the support level.
First of all, the CPI data will be released tomorrow. With inflation in the United States currently heating up, the Federal Reserve is undoubtedly resisting a rate cut in July. This has, to some extent, dampened the enthusiasm of bulls. Secondly, it is necessary to pay attention to the response of Europe and Japan to the tariff issue. Due to the timeliness, the current market expectations are undoubtedly limited.
In the short term, the RSI indicator is already seriously overbought. For today's operation arrangement, it is recommended to short at the rebound of 3365-3375. If the gold price continues to maintain a strong trend in the short term and breaks through this resistance area, it is time to stop loss. First of all, we should pay attention to whether 3355-3345 can be broken. Once it falls below the support of 3355-3345, we will need to see the 3330 line below, and it may even fall below 3300. Therefore, we also need to take precautions and follow up.
🎯 Trading Points:
SELL 3365-3375
TP 3355-3345
In addition to investment, life also includes poetry, distant places, and Allen. Facing the market is actually facing yourself, correcting your shortcomings, facing your mistakes, and exercising strict self-discipline. I share free trading strategies and analysis ideas every day for reference by brothers. I hope my analysis can help you.
FXOPEN:XAUUSD TVC:GOLD FX:XAUUSD FOREXCOM:XAUUSD PEPPERSTONE:XAUUSD OANDA:XAUUSD
Gold is in the Bearish DirectionHello Traders
In This Chart GOLD HOURLY Forex Forecast By FOREX PLANET
today Gold analysis 👆
🟢This Chart includes_ (GOLD market update)
🟢What is The Next Opportunity on GOLD Market
🟢how to Enter to the Valid Entry With Assurance Profit
This CHART is For Trader's that Want to Improve Their Technical Analysis Skills and Their Trading By Understanding How To Analyze The Market Using Multiple Timeframes and Understanding The Bigger Picture on the Charts
