NordKern - XAUUSD InsightNordKern | Simplified Insight OANDA:XAUUSD – Short Opportunity Ahead
Gold is now near our important level at 3370, offering a shorting opportunity considering recent events and technical action.
Gold Price Decline – What's Behind It?
In the last two sessions (July 23–24), gold has retreated strongly owing to a set of global as well as market-specific circumstances:
1. Trade Deal Optimism
Advances in U.S.–Japan and U.S.–EU trade discussions lessened worldwide uncertainty, decreasing demand for gold as a safe-haven.
2. Higher U.S. Yields
Higher Treasury yields are rendering non-yielding assets such as gold less appealing, adding to downward pressure.
3. Technical & Profit-Taking
Following a recent rally, gold was exposed to selling. Stop-loss and profit-taking triggers hastened the fall.
Summary of Key Drivers
U.S. Trade Deals: Reduced geopolitical risk
Higher Treasury Yields: Decreased gold's relative attractiveness
Technical Selling: Enhanced the downward trend
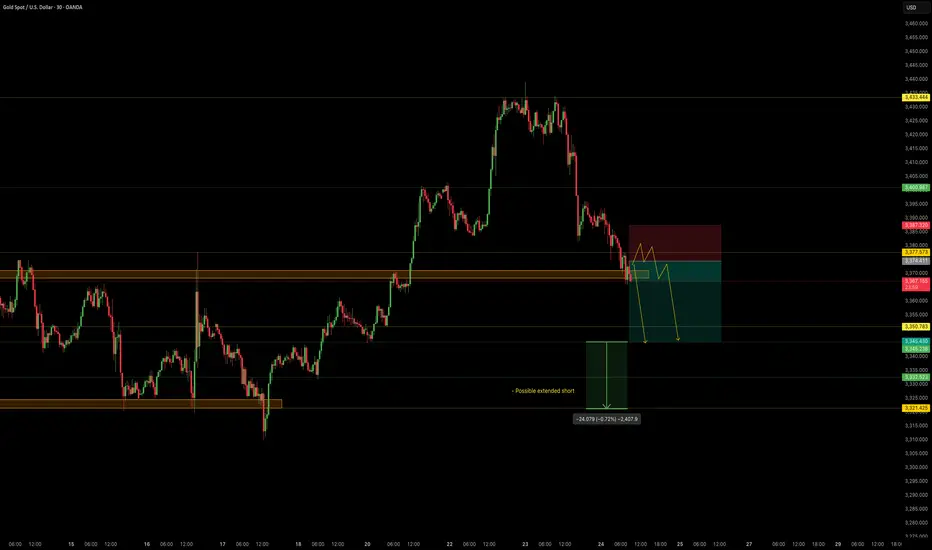
Trade Setup – Bearish Bias
Entry : 3374.4
Stop Loss : 3387.3
Take Profit : 3345.4
Extended Target : 3322
Key Notes:
- Trade Deal Optimism: U.S.–Japan and U.S.–EU agreements eased global tensions, reducing demand for gold as a safe-haven asset.
- Yield Pressure: Rising U.S. Treasury yields made gold less attractive compared to interest-bearing alternatives.
- Technical Selling: Profit-taking and stop-loss triggers accelerated the decline after gold’s recent rally.
This setup remains tactically driven. Manage risk carefully and monitor for any renewed political shifts.
Goldsell
BULLISH REVERSAL SIGNAL FROM 3,350 SUPPORTOn the 15-minute chart (M15), XAUUSD is showing early signs of recovery after a sharp decline that found support around the key 3,350 USD level. This area has been tested multiple times with increasing volume, suggesting potential buyer accumulation.
Technical Analysis: Downtrend Line: A descending trendline (yellow) from the July 23 high has acted as dynamic resistance. Price is now approaching this line again.
Fibonacci Retracement: The recent rebound from 3,350.11 to 3,373.52 shows key resistance zones at the 0.5 (3,361.82) and 0.618 (3,364.58) Fibonacci levels.
Volume Spike: Notable volume surges at the bottom suggest increased buyer interest near support.
Key Price Levels for Today: Technical Zone Role 3,350 – 3,353
Strong short-term support 3,361 – 3,365
Fibonacci 0.5–0.618 resistance 3,373.5
Previous swing high 3,400 – 3,434
Fibonacci 3.618 extension target
Trading Strategies: Scenario 1: Bullish Breakout Above Trendline Entry: Buy stop above 3,366 with increasing volume.
TP1: 3,373.5
TP2: 3,400
TP3: 3,434 (Fibonacci 3.618 extension)
SL: 3,348 (below recent low)
Scenario 2: Trendline Rejection – Bearish Continuation Entry: Sell limit at 3,364–3,366 if bearish pin bar / engulfing pattern appears
TP1: 3,350
TP2: 3,338
SL: 3,375
Additional Confirmation Signals: Closely watch price action near the trendline and Fibonacci zone (3,361–3,364).
RSI is not yet oversold, so a short-term technical rebound remains possible.
Conclusion: Gold is currently testing a significant support zone around 3,350 USD. If price successfully breaks above the descending trendline and holds, we may see a bullish impulse targeting as high as 3,434 USD. However, failure at this resistance may trigger another leg down.

Trend corrected, long funds reduced, sellers returned#XAUUSD
The current moving average is still spreading downward, and the 4-hour chart closed with a large negative line. The market has not yet given a clear feedback on the current trend. However, after a large amount of buying funds intervened, the gold price hit a high of around 3377 and then stagnated. The short-term bullish momentum has weakened, and there is a certain risk of a correction and decline. Sellers are beginning to return📉.
Currently, you can consider participating in short selling at 3370-3377💡. If it rebounds directly to 3400-3405, you can still short if it does not break🔍. The target is 3360 below, and 3350 or even 3330 if it breaks🎯.
🚀 SELL 3370-3377
🚀 TP 3360-3350
Gold-----sell near 3373. Target 3350-3320Gold market analysis:
Yesterday's gold shorts were very obvious. Yesterday in the Asian session, we arranged shorts at 3380 and 3386, and at night we arranged shorts at 3373. Now everyone is going to look at these positions. In fact, one-sided market requires bold pursuit, and volatile market requires careful waiting. It has been one-sided for two days. Today we estimate that it will be volatile and repaired. Today's idea is still to sell. The daily line has a big negative and a tail. The short selling trend has not changed. The daily line 3350 is a strong support. Above this position, it will continue to fall after the Asian session repair today, and it is not yet certain that 3350 is the low point of this wave of decline, so selling is still the main course. Gold 3343 is the trend watershed of this wave of sharp rise. This position is the position of bullish counterattack, and it also needs to be sold and avoided. In terms of trend, we cannot judge the space and end point of this wave of decline, but we can be sure of its trend, which investors need to follow. The idea of gold in Asian session is very simple. Consider selling opportunities near 3374-3377. Another suppression position is near 3383. If these two positions are not broken, basically sell short. If the Asian session runs to 3350, you can sell directly after a small rebound. Don’t consider buying first. Just sell without buying. Today is Friday. Even if gold rebounds, it will be in the European and American sessions.
Suppression 3373-3377, strong pressure 3383, support 3350, and the watershed of strength and weakness of the market is 3373.
Fundamental analysis:
There are basically no big data and big fundamentals this week. The US tariffs support gold buying, but there is no news about this week’s tariffs.
Operation suggestions:
Gold-----sell near 3373. Target 3350-3320

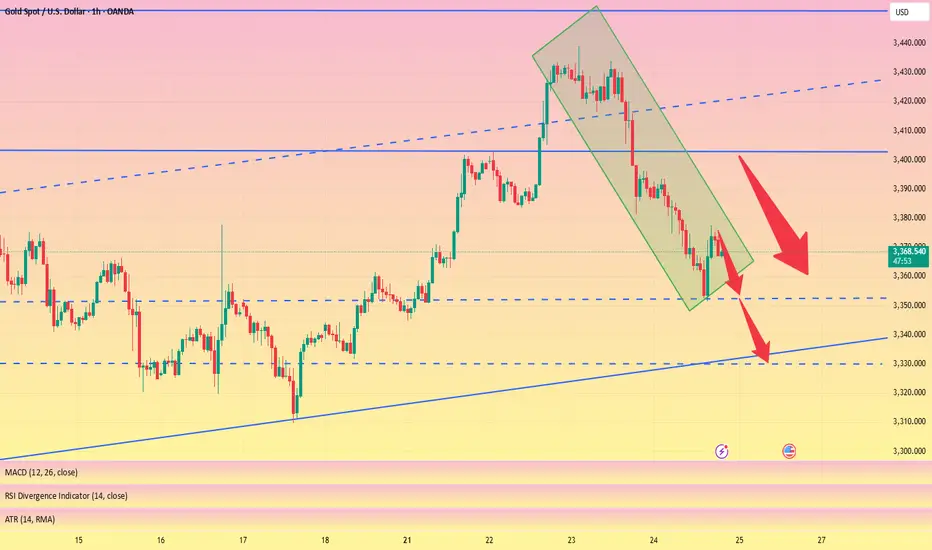
Gold technical outlook – Signs of exhaustion at channel topOANDA:XAUUSD is climbing within a well-defined ascending channel, and price is now brushing up against the upper boundary, a dynamic resistance zone that has historically triggered pullbacks. If price gets rejected here, we may see a healthy correction toward the key support at 3,350, offering a potential reload point for bulls.
Should buyers step in and defend this level, the bullish structure remains intact, setting the stage for a renewed push higher. On the other hand, a clean break below 3,350 could open the door for a deeper retracement toward the lower edge of the channel, where more significant demand may lie.
All eyes should be on price action and volume in this regio, watch for reversal patterns like bullish pin bars or engulfing candles to confirm entries. As always, risk management comes first. Don't trade assumptions, trade confirmations.
What’s your take on this setup? Drop your thoughts below and let’s discuss!

The callback is coming to an end, don't chase the short easily#XAUUSD
The long positions held last night have already left the market at a loss😔. After the Asian session opened, I continued to watch the trend of gold, but it did not effectively rebound to the ideal target area. After repeatedly testing around 3393, I chose to manually exit the market📀.
Gold is currently somewhat overcorrected, with the hourly line falling into severe oversold territory📉. But the market will eventually return to the bullish trend🐂. Why do I say that? First, there are less than 8 days left before the final deadline for tariffs. Second, the Federal Reserve’s interest rate cut is also approaching. In the medium and long term, there is definitely no problem with being bullish. There will be initial jobless claims data later, which will affect the trend of gold today. We need to pay some attention to it👀.
From the daily line, the current Bollinger Band middle track is near the 3343 line, and the SMA60 moving average is near the 3330 below. In the short term, the downward momentum of gold is released, and it is expected to test the 3343 mid-line support below💪.
📊Therefore, we can consider going long again at 3360-3343 below and look towards 3375-3385. Short-term losses don’t mean anything. With the recent frequent news fluctuations, we still have a good chance to turn losses into profits🚀.
🚀BUY 3360-3350
🚀TP 3375-3385
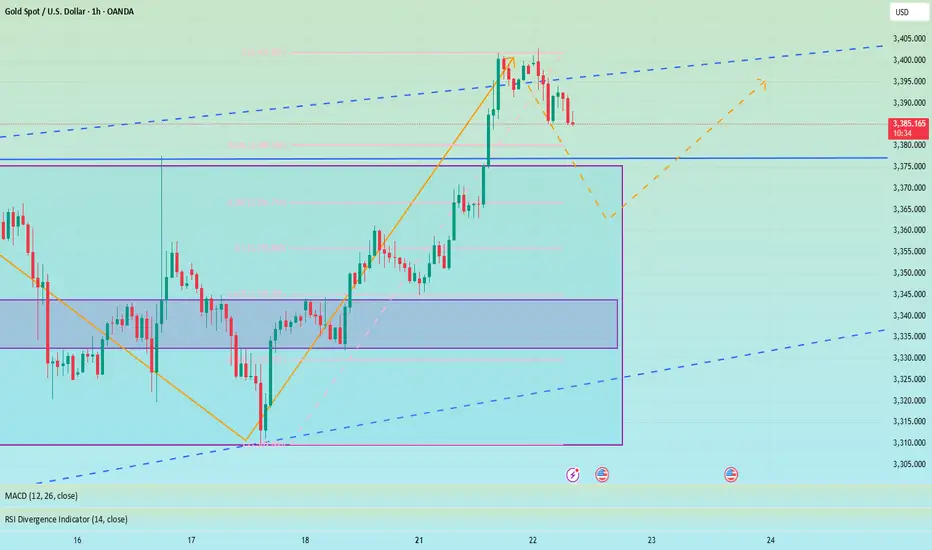
XAUUSD 24/07 Bullish Reversal Potential from Falling Channel1. Price Overview & Trendline Context
Gold (XAUUSD) is currently trading around 3,369.67 USD after a notable pullback from the recent high near 3,428. A clear descending channel has formed, marking a short-term corrective move within a larger bullish trend. Price action suggests a potential reversal setup as price approaches a strong support zone around 3,340 – 3,350 USD, previously acted as demand in the breakout on July 22.
2. Fibonacci & Structure Analysis
The Fibonacci retracement drawn from the recent swing low to the top at ~3,428 reveals that the pullback has reached the 0.9 level, often seen as an exhaustion point for corrections in strong bullish trends. This area aligns with:
Key horizontal support: 3,340 – 3,350
Previous breakout zone
Volume spike at base (20.6K vs avg.)
This convergence suggests a high-probability bullish reversal setup.
3. EMA & Momentum Indicators
Although the chart primarily uses SMA 9, the structure suggests price is extended from shorter EMAs. A break above the upper boundary of the falling channel may trigger EMA crossovers, further confirming reversal momentum.
4. Trading Strategy Suggestion
Setup
Description
Buy Zone: 3,350 – 3,365 USD
Take Profit 1: 3,385 USD (short-term supply zone)
Take Profit 2: 3,428 USD (recent swing high)
Stop Loss: Below 3,340 USD
This trade follows the "Buy the Dip in Uptrend" strategy, aligning with trendline, fib support, and volume confirmation.
5. Key Resistance & Support Levels
Resistance: 3,385 – 3,428 USD
Support: 3,340 – 3,350 USD
Breakout Confirmation Level: 3,375 (channel breakout)
6. Final Insights
Gold remains in a broader bullish structure. Today’s chart shows strong technical confluence for a short-term reversal. Traders should monitor closely for breakout candles from the falling wedge/channel, preferably with volume confirmation.

XAUUSD Top-down analysis Hello traders, this is a complete multiple timeframe analysis of this pair. We see could find significant trading opportunities as per analysis upon price action confirmation we may take this trade. Smash the like button if you find value in this analysis and drop a comment if you have any questions or let me know which pair to cover in my next analysis.

Gold Pulls Back to Support Zone📊 Market Overview:
• Gold price fell sharply to $3,385/oz, after previously testing the $3,430 zone.
• Short-term profit-taking and anticipation of upcoming U.S. economic data (PMI, durable goods orders) caused a mild USD rebound, pressuring gold lower.
• Overall sentiment remains cautious as the Fed has yet to clearly signal a rate cut path.
📉 Technical Analysis:
• Key Resistance: $3,430 – $3,445
• Nearest Support: $3,382 – $3,368
• EMA 09: Price just broke below the 9 EMA, suggesting a potential deeper correction unless it rebounds quickly.
• Candlestick/Volume/Momentum: Bearish engulfing candle with rising volume – indicates strong selling pressure and momentum currently favoring the bears.
📌 Outlook:
Gold is undergoing a short-term correction, currently testing the strong technical support zone at $3,382 – $3,385. If this zone holds, we may see a rebound toward $3,410 – $3,420. If it fails, gold could slide further toward $3,368 – $3,350.
💡 Suggested Trade Strategies:
🔻 SELL XAU/USD at: 3,395 – 3,400
🎯 TP: 3,375
❌ SL: 3,405

Gold------sell near 3392, target 3370-3350Gold market analysis:
Yesterday, gold in the European and American markets plunged directly. It is cold at high places. Gold has already experienced four big plunges above 3435. From the perspective of form, there is a super pressure there. We also reminded in the analysis yesterday that the rhythm of gold daily lines in the past two days has changed very quickly, and it is all shocks and then quickly pulls up and ends directly. It is basically difficult to follow its rhythm without direct pursuit. The big negative line of the daily line has destroyed the strong support near 3402-3404. This position has been converted into a new strong pressure. Today's idea is to adjust the bearish trend and continue to sell on the rebound. The adjustment of the daily line is not sure whether it is an adjustment of the wave structure, but it can be determined to sell in the short term. We are just a trend follower. Today, gold will not rebound above 3402 and is basically weak.
Gold plunged directly in the Asian session, and the selling force is still relatively strong. At present, the new low strong support of the daily line has not appeared. The next moving average support of the daily line is around 3366. I estimate that there will be a rebound at this position. If the hourly Asian session does not fall and rebounds first, consider continuing to sell it at 3395 and 3402. Gold likes to convert quickly recently. If it stands on 3404, it will be reconsidered.
Support 3374, 3366 and 3350, suppress 3395 and 3402, and the weak watershed before the market is 3395.
Fundamental analysis:
Tariffs have not affected the market recently, and there is no major news released. The market is relatively calm.
Operation suggestion:
Gold------sell near 3392, target 3370-3350

Gold prices plunge in the short term!Market news:
In the early Asian session on Thursday (July 24), spot gold fluctuated in a narrow range and is currently trading around $3,388 per ounce. International gold suffered a fierce sell-off after a sharp rise in the previous two trading days. Media reports said that the United States and the European Union were getting closer to reaching a tariff agreement, and the news hit safe-haven demand. The decline in London gold prices was mainly due to the dual pressure of easing macro-geopolitical tensions and the recovery of risk appetite.Although the Federal Reserve is expected to keep interest rates unchanged, the controversy surrounding the independence of the Federal Reserve is heating up. According to a recent Reuters survey, most economists believe that the Federal Reserve is currently facing unprecedented political pressure, which provides potential medium- and long-term support for gold. However, in the short term, as the resilience of US economic data emerges and market risk sentiment improves, investors are cautious about the Federal Reserve's expectations of a sharp interest rate cut this year, and gold has lost the momentum to further attack.The current market focuses on the progress of trade negotiations between major economies in the world and the upcoming Federal Reserve interest rate meeting. Against the backdrop of the implementation of the US-EU and US-Japan agreements, the short-term safe-haven properties of gold may continue to weaken. In addition, this trading day will usher in the July PMI data of European and American countries, the change in the number of initial jobless claims in the United States, the annualized total number of new home sales in the United States in June, and the interest rate decision of the European Central Bank!
Technical Review:
Affected by Trump's speech, the United States reached an agreement with more trading partners, and the market risk aversion cooled down. Gold plunged sharply to a new low of 3381 in the late trading. The technical daily structure closed with a single negative line, ending the strong form of the continuous positive structure. However, the daily MA10/7-day moving average still maintained a golden cross opening upward, moving up to 3378/67. The price is currently adjusted at the 5-day moving average of 3390, and the RSI indicator is running above the middle axis. The price is in the upper and middle track of the Bollinger band.
The short-term four-hour chart retreated to the middle track of the Bollinger band at 3380 and stopped falling, and the RSI indicator adjusted its middle axis. The moving average high at 3410 opened downward in a dead cross, and the short-term gold price fell into a wide range of shocks. Today's trading strategy is to sell at high prices and buy at low prices. The strategy layout is based on fluctuations. Let's look at the 3366/3416 range first.
Today's analysis:
Yesterday, gold fell straight in the European and American trading hours, with a drop of more than 50 US dollars. The main reason is the impact of European and American tariffs. Last night, the European and American trade negotiations determined a 15% tariff. The market's risk aversion sentiment subsided, causing the gold price to fall. The gold daily line finally closed with a big negative line, and the gold daily line was covered with dark clouds! The rebound during the day is mainly sold at high prices!The high level of the gold 1-hour moving average has begun to turn around. The buying power of gold has obviously suffered a heavy blow under the influence of the news. The short-term high level of gold 1 has also formed a head and shoulders top structure. As long as the gold rebound does not break through 3400, the right shoulder of gold will be completed. Then gold will complete the short-term top structure of the head and shoulders top in the short term, and gold selling will begin to work.
Operation ideas:
Short-term gold 3366-3369 buy, stop loss 3358, target 3390-3410;
Short-term gold 3400-3403 sell, stop loss 3412, target 3380-3360;
Key points:
First support level: 3380, second support level: 3367, third support level: 3353
First resistance level: 3403, second resistance level: 3410, third resistance level: 3420

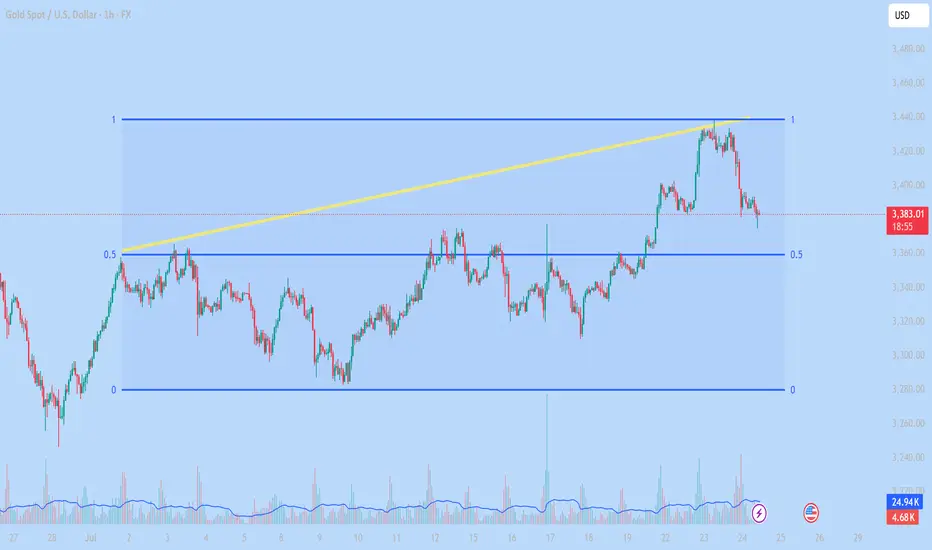
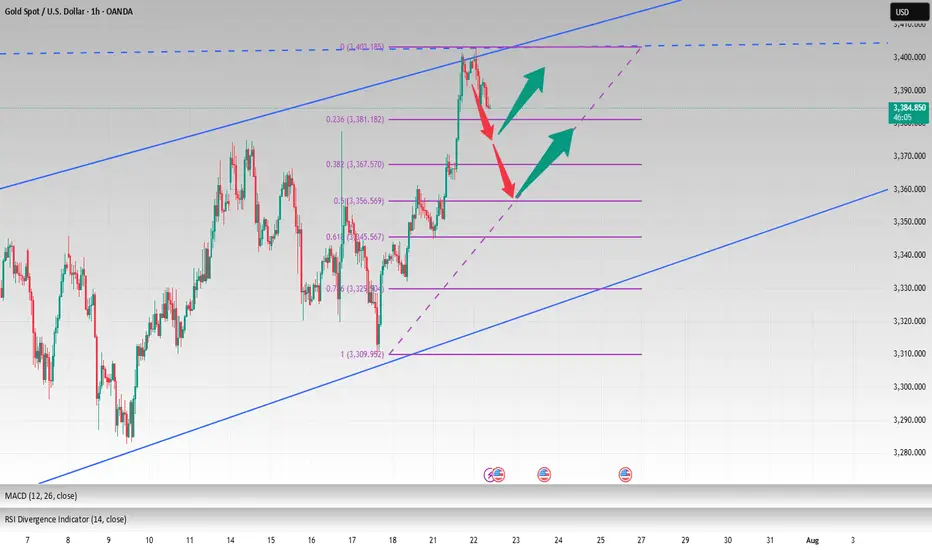
Technical Analysis of XAUUSD – 1H July 24, 20251. Fibonacci Levels
The chart uses a Fibonacci range from 0 to 1, likely drawn from a significant low to a recent high.
The 0.5 Fibonacci level (around $3,360) is acting as a major support zone and price is currently testing this level.
2. Short-term Trend
Price broke above the previous high and formed a new high near $3,440, but then reversed sharply.
Now it’s pulling back toward a key support zone between $3,360 – $3,380.
3. Volume Analysis
Volume spiked at the top near $3,440, suggesting strong selling pressure or profit-taking.
Volume slightly increases again as price reaches support → possible buying interest at the current level.
4. Trendline (Yellow Line)
The ascending yellow trendline has been broken to the downside, signaling a break in short-term bullish momentum.
Possible Scenarios
Scenario 1 – Bullish Rebound from Support:
If price holds above the $3,360 zone and forms bullish candles, we could see a recovery toward $3,400–$3,420.
That area can act as a short-term profit-taking zone.
Scenario 2 – Bearish Breakdown Below 0.5 Level:
If price breaks below the $3,360 support with strong bearish candles, it may drop further toward the Fibonacci 0 level (~$3,280).
Conclusion
Gold is at a critical decision point. Holding the $3,360 support could lead to a bullish bounce. Breaking it would likely confirm a short-term downtrend. Monitor the next few candles closely for confirmation.
Would you like a trade plan or entry/exit suggestion based on this chart?
The callback continuity is poor, and the bulls are still strong📰 News information:
1. Geopolitical situation
2. Tariff retaliation
📈 Technical Analysis:
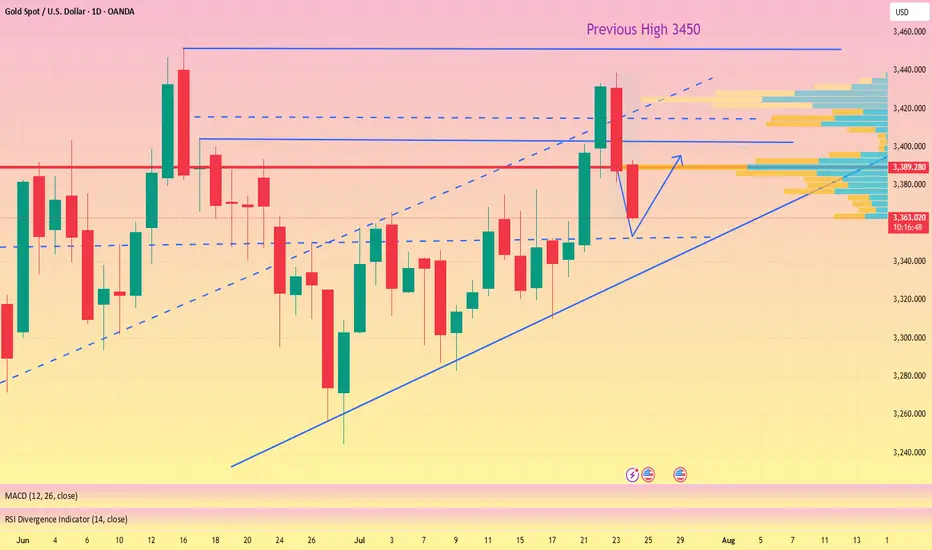
Trump continued to lash out at the Fed, but seemed to have backed off on whether to remove Fed Chairman Powell. The continuous rise of the gold index, once close to 3440, also ushered in a new high in more than a month. Next, we need to pay attention to whether gold can reach the 3450 mark.
Judging from the daily chart, there were three times when it touched around 3450 and then fell back. If it breaks through and stabilizes above 3450 this time, the historical high of 3500 may be refreshed. If it cannot effectively break through 3450, the probability of subsequent retracement is still very high.
From the hourly chart, the bottom support is almost at 3405-3400. However, the recent rhythm belongs to the consolidation of the Asian and European sessions, the US session has begun to rise, and the risk of serious overbought data indicators is still there. This is why I told everyone in the morning that we need to be vigilant about the current rise. Waiting for a pullback to go long is relatively more stable. I also explained in the morning that if it falls below 3405-3400, the decline may continue to around 3385. After all, the fundamental purpose of our trading is to make a profit, so we must minimize the foreseeable risks to the greatest extent possible.
On the whole, if there is an obvious stop-loss signal at 3405-3400, you can consider going long and looking at 3450. Once it falls below 3400, don't chase it easily, and pay attention to the possibility of a retracement below 3385.
🎯 Trading Points:
BUY 3405-3400
TP 3440-3450
In addition to investment, life also includes poetry, distant places, and Allen. Facing the market is actually facing yourself, correcting your shortcomings, facing your mistakes, and exercising strict self-discipline. I share free trading strategies and analysis ideas every day for reference by brothers. I hope my analysis can help you.
FXOPEN:XAUUSD OANDA:XAUUSD FX:XAUUSD FOREXCOM:XAUUSD PEPPERSTONE:XAUUSD TVC:GOLD
Gold is often bullish and bearish, with a focus on the 3411 wate
Gold prices hit a five-week high of $3,439 an ounce on Wednesday before turning lower on profit-taking and a rebound in the dollar. However, from a technical perspective, the path of least resistance for gold prices still appears to be to the upside. Looking ahead, trade and political developments will continue to play a key role in gold price movements, while traders will also be keeping a close eye on the feud between Trump and Fed Chairman Powell.
Why did gold return to $3,400? Reasons explained!
1 As investors continue to focus on U.S. President Trump's August 1 tariff deadline, trade uncertainty and weaker U.S. Treasury yields have pushed gold prices to a five-week high. At the same time, trade uncertainty is also triggering some safe-haven demand.
2 Meanwhile, investors are also preparing for the Fed meeting next week. Although the Fed is expected to keep interest rates unchanged, the market expects that the Fed may cut interest rates in October. Gold is traditionally seen as a hedge in uncertain times and tends to perform well in a low-interest rate environment.
What do you think of today's gold trend!
Today, gold rose to 3439 and then continued to fluctuate sideways. At present, gold has been fluctuating and weakening near 3420. Relatively speaking, the trend is still strong, but the trend has not continued to break through the high point. In this trend, it is actually unwise to chase the rise. At present, we still have to wait for the market sentiment to be fully mobilized before continuing to operate!
The hourly line is still the view of the previous post. Near 3411 is the key position for the second bullish today. Unfortunately, the fluctuation has been fluctuating around 15 points today, and the amplitude of the fluctuation has slowed down. It is still necessary to wait quietly. After all, under the current situation of large repetitiveness, it is not easy to enter the market at a good point and there is a high probability that there will be no good profit margin. If there are other changes later, I will give them in real-time guidance!
Gold: More near 3411, defend below 3403, and the target is 3440-50!

3400 has been reached, wait patiently for a pullback to go longGold opened on Monday with a volatile rise. After breaking through the 3360-65 area, the bulls turned strong. After breaking through the 3375~80 area in the evening, the bulls accelerated their rise, reaching the highest point of 3402. It fluctuated sideways in the late trading, and the daily line closed at around 3397 with a big positive line! Gold temporarily broke the small range oscillation pattern, but the bulls were not strong, and it still fluctuated upward.
From the perspective of the intraday cycle, after yesterday's rapid rise, the market fell into a serious overbought state; however, yesterday's $60 big positive line supported the bulls, and it is expected that the market will fluctuate; the next focus is still the 3400 mark area. The pressure in the 3400~05 area was dense last night, and adjustments may be made at any time before the breakthrough; and since the rise of 3282, it has just touched the upper edge of the parallel channel. The big sweep will continue, but the range is constantly changing!
So although gold broke the recent volatility yesterday and hit the 3400 mark with a big positive line; however, if it cannot stand above it, then it will continue to fall; recently we have repeatedly and many times emphasized the importance of the 3400 mark. If it stands here, the market will gradually rise to 3420~25 and break through to the 3450 area before looking for a decline.
Today we will continue to focus on the 3400 mark area. First, we will rush to the high altitude, with the goal of retracement to the 3375 and 3356 regional support platforms, and then pay attention to long opportunities; if the bulls stand above the 3400 mark, they will further bullishly impact 3420~25 and break through the 3450 area before falling back.
OANDA:XAUUSD
XAUUSD: Fluctuation of $30/ounce. Do you want to know?Yesterday, I frantically notified followers to buy around 3366-3375, and the market finally rose to 3430. This is a huge profit. I will continue to update it in the Band Trading Center Research Institute later. If you don’t want to miss it, follow me. If you see it but are still not sure how to trade. Then you can leave me a message at the Swing Trading Center Research Institute. I will reply to you one by one when I see it.
This week, some followers have achieved weekly profits of 50%-268%. If your profit is not ideal. Or don’t know how to trade. Remember to like and follow. I will lead everyone to victory.
Buy around 3400-3410. When will it close? I will post the results on the Swing Trading Center. Stay tuned.

XAUUSD:3450-3500The probability of the same direction of the two histories is 95% similar. This shows one thing. The market may repeat history again.
So buy with me. The next target is 3450-3500

Bulls are still the main theme, 3400 is not the high point📰 News information:
1. Fed Chairman Powell delivers a welcome speech at a regulatory conference
2. The tariff deadline is approaching
📈 Technical Analysis:
Today's opening high reached around 3402, and did not effectively break through the upper resistance of 3405-3415. As I said yesterday, a decline and return to the moving average is an inevitable result. The tariff issue is still there, with the deadline on August 1, and the daily MACD indicator still shows a golden cross. The general direction of short-term bullishness has not changed, but from a technical point of view, gold still has room to fall to correct the overbought part.
Below the day, we first focus on the top and bottom conversion position of 3377-3375. As time goes by, the 4H middle track will probably resonate with the 50% position of the Fibonacci line at 3355, which is also a good long position I expect. Therefore, if the price falls back to 3380-3375 for the first time during the day, you can consider going long. If the price continues to fall, pay attention to the second opportunity to go long at 3355, with the target at 3390-3410.
🎯 Trading Points:
BUY 3380-3375
TP 3390-3410
BUY 3360-3350
TP 3370-3380
In addition to investment, life also includes poetry, distant places, and Allen. Facing the market is actually facing yourself, correcting your shortcomings, facing your mistakes, and exercising strict self-discipline. I share free trading strategies and analysis ideas every day for reference by brothers. I hope my analysis can help you.
TVC:GOLD PEPPERSTONE:XAUUSD FOREXCOM:XAUUSD FX:XAUUSD OANDA:XAUUSD FXOPEN:XAUUSD
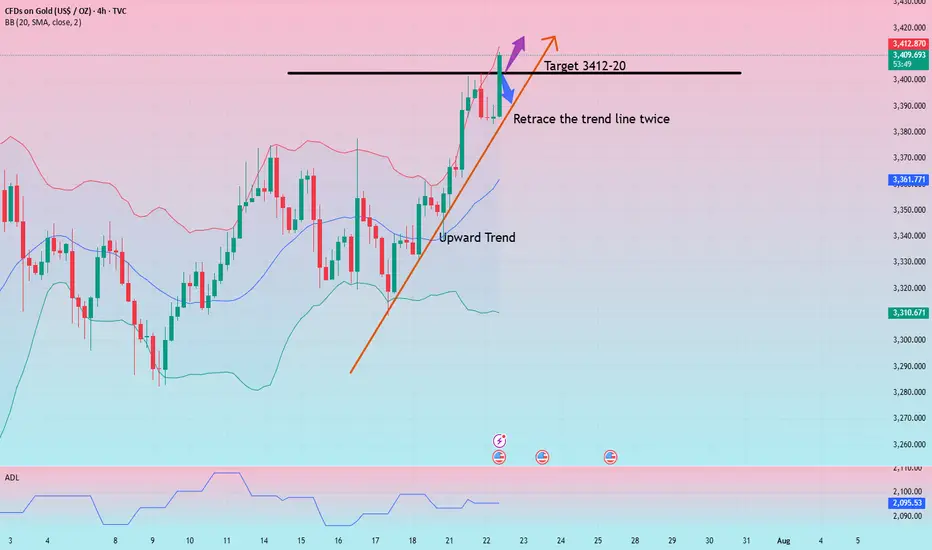
Gold breaks and turns upward! Will it break through 3403? Or wil
Gold fluctuated sideways for another day in this transaction, and only showed signs of further upward attack near the US market. The current gold price is around $3,400/ounce. The gold price is falling from the more than one-month high of $3,403/ounce hit in the early Asian session on Tuesday, and fell to the lowest level of 3,383 before turning around again. So how will the trend be today? Let me explain it to you below!
Why did gold rise across the board this week?
1 On Monday, the uncertainty surrounding the trade agreement between the United States, Japan and the European Union increased, raising concerns about the prospects for US economic growth and suppressing the US dollar. The fate of gold is still closely tied to the trend of the US dollar, which is currently under pressure from US President Trump's tariff negotiations.
2 In addition, Trump has repeatedly called on Federal Reserve Chairman Powell to resign, raising concerns about the independence of the Federal Reserve, causing US bond yields to continue to decline, and also putting pressure on the US dollar. The record rise in Wall Street stock indexes has weakened the safe-haven appeal of the US dollar and the attractiveness of yields, thereby helping gold prices to continue their gains since Friday.
What do you think of the future trend of gold!
From the current market situation, the trend is still in a very strong market, and the current high point of 3403 is in danger. It can only be said that if it breaks through again today, the upper pressure needs to see the 3420 line. This week's trend has not given any chance to step back. It is either a slow rise or a sudden strength in the sideways market. There is basically no chance to enter the market at a suitable position!
From the current 4-hour trend, there is basically no escape from today's strength, and the current problem is actually whether there is a suitable entry opportunity. Prepare for both hands. One is to look at the previous high of 3403. If it breaks through strongly, go long directly, and look at the 3412-20 line. If it retreats first, then look at the vicinity of 3385 and see the second rise in the US market!
Gold: Long near 3385-87, let go of 75, and the target is 3412-20! If it rises directly and breaks through 3403, you can try to break through long with a light position, and still look at the 3412-20 line above!
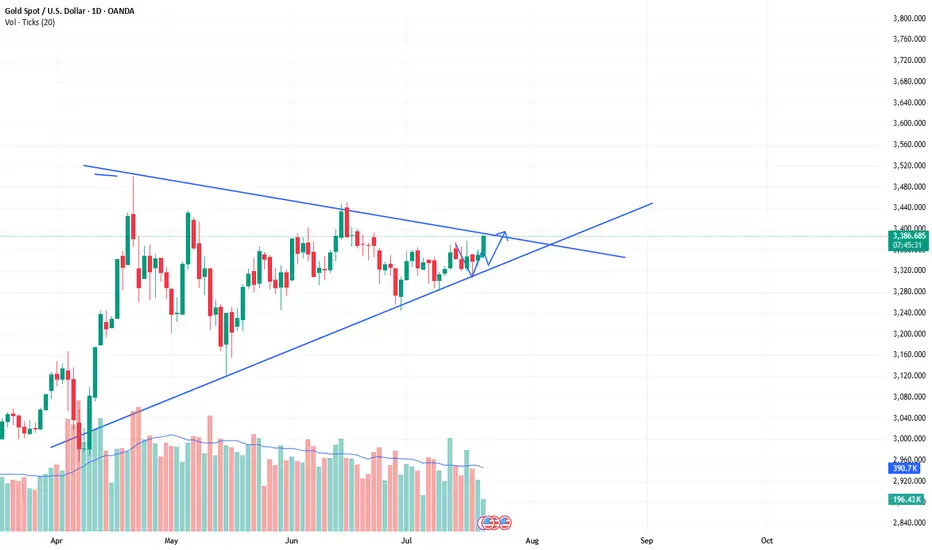
The bull market of xauusd continues, buy and wait for the rise.As predicted in the band trading center in advance over the weekend. The daily level trend is still very stable, and the breakthrough trend has been perfectly carried out. The current quotation is 3388. It is only a matter of time before it rises wildly to the position of 3430. The short-term will definitely break through. The current bull market is clear and has huge potential. The limit of the triangle consolidation phase is about to be broken. Then the bulls will continue to rise. Therefore, buying is the key operation plan.
XAUUSD:Retracement is a buying opportunityAfter the Asian market hit the highest position of 3403, there was some decline. The current gold price is 3386. From the short-term trend of the hourly level. It is still fluctuating at a high level. Combined with the trend of the daily level, there are signs of retracement and counterattack. There is no news dominance. It is purely a technical repair after hitting the high. This retracement can pay attention to the support near 3382-3378. The London and New York markets are still based on buying and profit.

XAUUSD SEEMS BEARISHAs we can see gold has created Descending triangle pattern which lead the gold in more bearish momentum.

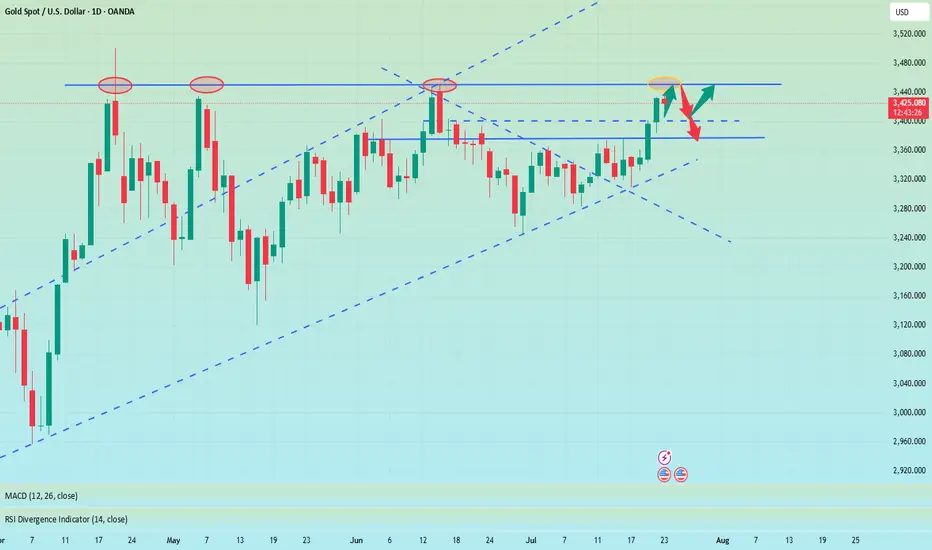
XAUUSD Analysis : From Ellipse Demand to Reversal Zone – Target Hello traders!
Let’s decode today’s GOLD setup using the MMC (Mirror Market Concepts) strategy. This is a clean and textbook example of how institutional price delivery works – from demand creation to reversal zones. Let’s go step by step👇
🔵 Previous Ellipse Full Demand – The Accumulation Phase:
The market initially formed an Ellipse structure, which you’ve rightly marked as the Previous Full Demand Zone. This is where smart money started to accumulate long positions after pushing the market into a discounted area.
Price remained inside this ellipse zone for a while, showing slow and controlled price action with multiple rejections from the bottom. This type of price behavior is usually a trap zone, where retail traders are shaken out, and institutions silently build their positions.
💥 FMFR Zone – Where Momentum Begins:
On July 18, a clear FMFR (Fresh Money Flow Reversal) took place. This is the moment where price broke out of the ellipse demand zone with strength.
This FMFR marks the transition from accumulation to markup phase. It signals that the market makers have done their job in collecting liquidity and are now ready to drive price upward.
From this FMFR, the market respected a curved path — a classic MMC parabolic build-up, showing buyer dominance throughout.
📈 One-Time Delivery (OTD) – Clean Impulse:
Following the FMFR, price followed a One-Time Delivery (OTD) move. You’ve marked this beautifully with the vertical box showing the aggressive bullish impulse.
The candles are strong, consecutive, and with minimal pullbacks — a sign that the market is being delivered efficiently by the institutions toward their target.
🟩 Reversal Area – Target Reached:
Price has now entered the Reversal Area (Supply Zone), which was expected based on previous structure and imbalance. The market is reacting to this area already — giving signs of exhaustion.
From an MMC perspective, this is a potential “sell to buy” or “buy to sell” trap zone, where the market could either reverse completely or engineer liquidity before moving again.
⚖️ Central Zone – Balance Area:
Below the current price lies the Central Zone, which is a neutral area where the market may consolidate if it fails to hold higher or reject immediately. This area usually acts as a pause or buffer zone, often seen before the market decides the next leg (up or down).
🔄 Next Reversal Area – Demand Reload Zone:
If price drops, the Next Reversal Area marked below (around the 3,345–3,355 range) will be crucial. This is the zone where you should watch for:
Bullish rejections
FMFR signals
Trap candles (like liquidity wicks)
Expect this area to act as the next “Buy Program”, where institutions might step back in to reload longs.
🧠 Conclusion & Trader Mindset:
✅ Market respected MMC phases: Accumulation ➝ FMFR ➝ Delivery ➝ Reversal
🛑 Currently in a high-probability reaction zone – wait for confirmation before trading.
👁️ Watch how price behaves in the Reversal Area — rejection or continuation?
🔁 If market retraces, Next Reversal Area is your prime hunting zone for long setups.
🔔 Stay Patient – React, Don’t Predict.
Let the market reveal its next move. Whether it’s a pullback to reload longs or a deeper retracement, MMC logic will guide you to stay on the right side.
