Gold Poised to Continue Rising If Supports Hold📊 Market Overview:
Gold remains on the rise amid expectations of further Fed rate cuts, a weakening U.S. dollar, and persistent tariff-related uncertainty. Citi has raised its 3-month forecast to $3,500–3,600/oz
📉 Technical Analysis:
• Current Resistance Levels:
o Near-term: $3,408–3,412
o Extended: $3,421 and $3,442
• Key Support Levels:
o Immediate: $3,375, then $3,355 and $3,343
o Deeper: $3,312–3,300 demand zone on TradingView, and April low at $3,170
• Technical Trend:
Gold continues to receive strong bullish signals across multiple moving averages, and FXEmpire indicators show “Strong Buy” across most timeframes
📌 Outlook:
The short-term bias is clearly bullish. As long as gold holds above the $3,375 support and breaks through the $3,408 resistance, it is likely to rally toward the $3,420–3,440 area.
💡 Suggested Trading Strategy:
BUY XAU/USD : $3,375–3,378
🎯 TP: 40/80/200 pips
❌ SL: $3,370
Goldsetup

Gold Continues to Attract Safe-Haven Flows📊 Market Brief
Gold prices remain firm above the 20-day EMA and 50-day MA, reflecting increased safe-haven demand amid ongoing trade tensions and growing expectations of a Fed rate cut.
The price is currently testing the resistance area around $3,400/oz, while immediate support lies in the $3,320–$3,330/oz range.
📉 Technical Analysis
• Key Resistance:
- $3,400
- Followed by: $3,420–$3,435
• Nearest Support:
$3,320–$3,330
- If broken, next levels are $3,300–$3,268
• EMA Position:
- Gold remains above both the 20-day EMA and 50-day MA, indicating a short-term uptrend
• Patterns & Momentum:
- RSI ~54 (neutral), MACD positive – indicating underlying bullish momentum
- EMA 8/21 crossover is turning upward, signaling short-term bullish reversal potential
📌 Outlook
Gold may continue rising modestly if it holds above the $3,320–$3,330 support zone and successfully breaches the $3,400 resistance. However, a break below $3,320 could lead to a test of $3,300 or even $3,268.
💡 Suggested Trading Strategy
SELL XAU/USD : $3,395–$3,3400
o 🎯 TP: 40/80/200 pips
o ❌ SL: ~$3,405
BUY XAU/USD :$3,325–$3,330
o 🎯 TP: 40/80/200 pips
o ❌ SL: ~$3,320

Gold May Correct Short-TermMarket Overview:
• Gold trading around $3,366–3,371 USD/oz, easing from two-week highs.
• Pressure from firmer US yields and USD recovery.
• Weak US jobs data boosted Fed rate cut expectations to ~90%.
• Still supported by global economic/political uncertainties and safe haven demand.
Technical Analysis:
• Resistance: ~$3,385–3,390, near psychological $3,400.
• Support: ~$3,345–3,350; break could target ~$3,310.
• Trading above EMA50, EMA9 direction still bullish short-term.
• RSI and MACD momentum fading; July monthly candle formed bearish “shooting star” near $3,431—invalidated only if price closes above that level.
Outlook
Gold may dip if USD and yields recover; but may rally if macro data deteriorate further. The $3,385–3,390 zone is pivotal.
Trading Strategy:
• Sell 3,392–3,395
TP ~40/80/200 pips
SL ~3,397
• Buy 3,345–3,348
TP ~40/80/200 pips
SL ~3,342

Gold Slightly Pulls Back – Awaiting Fed & Dollar Direction📊 Market Drivers:
Spot gold slipped ~0.1% to $3,376/oz, pressured by a firmer USD and caution ahead of Trump’s Fed chair and governor appointments
📉 Technical Analysis
• Key resistance levels:
o $3,390: previous session high – near-term ceiling
o $3,410: weekly high – stronger upside barrier
o $3,435: medium-term resistance – break above confirms strong bullish continuation
• Nearest support levels:
o $3,365: current Asian session low
o $3,345: strong support zone – EMA50 on H4 chart
o $3,305: last week's low – breakdown here may trigger deeper pullback
• EMA: Price remains above EMA09 and EMA50, suggesting a short-term bullish bias, though momentum is slowing.
• Candlestick / Volume / Momentum: Low volume in Asian session; H1 candles show indecision (doji with long wicks), signaling a tug-of-war between buyers and sellers.
📌 Outlook:
Gold may consolidate or dip slightly short-term unless it decisively breaks above $3,395 to confirm a new bullish leg.
________________________________________
💡 Suggested Trading Strategy:
SELL XAU/USD: ~3,392– 3,395
🎯 TP: 40/80/200 pips
❌ SL: ~3,398
BUY XAU/USD : ~3,366 - 3363
🎯 TP: 40/80/200 pips
❌ SL: ~3,360

Gold Breaks Support – Risk of Pullback Toward $3,310📊 Market Summary:
Gold prices initially rose on weaker-than-expected U.S. jobs data, which lowered Treasury yields and weakened the U.S. dollar. However, after breaking the key support at $3,365, gold continued to decline toward $3,354, and briefly touched $3,352, signaling rising technical selling pressure. Despite a 92% market expectation for a Fed rate cut in September, the technical breach increases the risk of a deeper correction.
📉 Technical Analysis:
• Key Resistance: Around $3,365–$3,370 – this zone now acts as short-term resistance; stronger resistance lies at $3,375–$3,380 if prices recover.
• Nearest Support:
The $3,365 level was broken.
New support is seen at $3,352–$3,350; a continued drop may bring prices to $3,335, and possibly toward $3,310–$3,300.
• EMA 09: Price is now below the 9-day EMA, suggesting a short-term bearish trend.
• Momentum / Volume / Candlestick:
RSI is near 50, slightly bearish; volume is tapering on the downside, indicating distribution.
Early signs of a head-and-shoulders (H&S) pattern are developing.
📌 Outlook:
Gold may continue declining in the short term if it stays below the $3,350–$3,352 zone.
A further drop toward the $3,335 – $3,310 region is possible.
If price rebounds and closes above $3,365, the bearish momentum could be neutralized.
💡 Suggested Trade Strategy:
🔻 SELL XAU/USD : $3,355–$3,358
🎯 TP: 40/80/200 pips
❌ SL: ~$3,361
🔺 BUY XAU/USD : $3,305–$3,302 (if price pulls back deeper)
🎯 TP: 40/80/200 pips
❌ SL: ~$3,299

Gold Extends Gains as USD Weakens📊 Market Overview:
Gold prices are extending their gains during the Asian and European sessions today, as the US dollar weakens following weaker-than-expected US jobs data. Rising unemployment and a softer Non-Farm Payroll report boosted expectations that the Fed may cut interest rates in September. The US 10-year Treasury yield also dipped slightly, supporting gold's safe-haven appeal.
📉 Technical Analysis:
• Key Resistance: $3,385 – $3,390
• Nearest Support: $3,365 – $3,370
• EMA: Price is trading above the EMA 09, indicating a short-term bullish trend
• Candles / Volume / Momentum: H1 candles show steady buying pressure with stable volume, but we should monitor potential profit-taking if price nears the $3,390–$3,400 zone.
📌 Outlook:
Gold may continue to rise in the short term if USD weakness persists and bond yields stay low. However, failure to break above $3,390 could lead to a pullback toward support levels.
💡 Suggested Trading Strategy:
🔺 BUY XAU/USD: $3,365 – $3,368
🎯 TP: 40/80/200 pips
❌ SL: $3,362
🔻 SELL XAU/USD : $3,392 – $3,395 (if reversal signal appears)
🎯 TP: 40/80/200 pips
❌ SL: $3,398

Gold Breaks Resistance – May Target $3400 Next📊 Market Overview:
• Gold continues to rally in early U.S. session as September rate cut expectations by the Fed rise due to weak jobs data.
• U.S. Dollar weakens and 10Y Treasury yield falls, supporting gold.
• Risk-off flows and long-term inflation concerns push safe-haven demand for gold.
📉 Technical Analysis:
• Key Resistance: $3,390–$3,400 (short-term breakout zone)
• Nearest Support: $3,365–$3,370
• EMA: Price is trading above EMA09 and EMA50, confirming bullish momentum
• Candles / Volume / Momentum: Consecutive bullish H1 & H4 candles above $3,375 confirm breakout. Volume increasing, suggesting strong buying pressure.
📌 Outlook:
Gold may continue rising toward $3,400 if current bullish momentum holds. However, short-term pullback or profit-taking near $3,395–$3,400 is possible after a rapid $50+ rally.
💡 Suggested Trade Setups:
🔺 BUY XAU/USD : $3,375–$3,378 (pullback buy)
🎯 TP: $3,395–$3,400
❌ SL: $3,372
🔻 SELL XAU/USD: $3,397–$3,400 (countertrend short)
🎯 TP: $3,375–$3,380
❌ SL: $3,403

Gold Continues Its Upward Momentum Despite Short-Term Pullback📊 Market Summary
• Spot gold slipped slightly by ~0.1% to around $3,354–$3,361/oz due to profit-taking after last week’s sharp rally following weaker-than-expected U.S. job data
• The U.S. added only 73,000 jobs in July, boosting expectations of a Federal Reserve rate cut in September, with a current market probability of around 81%
• Ongoing geopolitical risks, trade tensions, and robust central bank and ETF gold demand continue to support the long-term bullish outlook
________________________________________
📉 Technical Analysis
• Key resistance: ~$3,360–$3,370/oz (short-term highs, potential profit-taking zone).
• Nearest support: ~$3,330/oz (watch for buying interest on pullbacks).
• EMA09: Price is currently hovering around the short-term EMA (~EMA09), still below EMA50, indicating a mild sideways bias. According to Economies.com, gold hasn’t confirmed a stable uptrend above EMA50 yet
• Candlestick / volume / momentum:
o Today's candle shows mild profit-taking, but momentum remains bullish from the prior session. Volume shows light distribution, not strong selling.
________________________________________
📌 Outlook
• Gold may continue rising slightly in the short term if the upcoming U.S. inflation data (due August 12) remains soft, reinforcing the likelihood of a Fed rate cut
• Conversely, if the U.S. dollar strengthens unexpectedly or new data comes out more robust, gold could retreat back to the $3,330 zone.
________________________________________
💡 Suggested Trading Strategy
SELL XAU/USD : $3,370–$3,373
🎯 TP: 40/80/200 pips
❌ SL: $3,377
BUY XAU/USD : $3,330–$3,333
🎯 TP:40/80/200 pips
❌ SL: $3,327

GOLD REMAINS UNDER PRESSURE AFTER U.S. INFLATION DATA📊 Market Overview:
Gold is trading around $3294, down from $3311 earlier after U.S. Core PCE and Employment Cost Index came in as expected — reinforcing the Fed's hawkish stance. A stronger dollar and rising Treasury yields continue to weigh on gold.
📉 Technical Analysis:
• Key resistance: $3302 – $3305
• Nearest support: $3285 – $3275
• EMA09 (H1): Price is below the 9-period EMA → short-term trend remains bearish
• Candlestick / volume / momentum: After the sharp drop, price is consolidating between $3293–$3298 with low volume. Failure to break above $3302 may trigger further downside. RSI near 45 suggests room for more selling.
📌 Outlook:
Gold may continue to decline in the short term if it fails to reclaim $3302 and the dollar remains strong through the Asian and European sessions.
💡 Suggested Trade Setup:
🔻 SELL XAU/USD: $3296 – $3298
🎯 TP: $3280 / $3275
❌ SL: $3305
🔺 BUY XAU/USD: $3275 – $3278 (if reversal candle appears)
🎯 TP: $3295
❌ SL: $3270

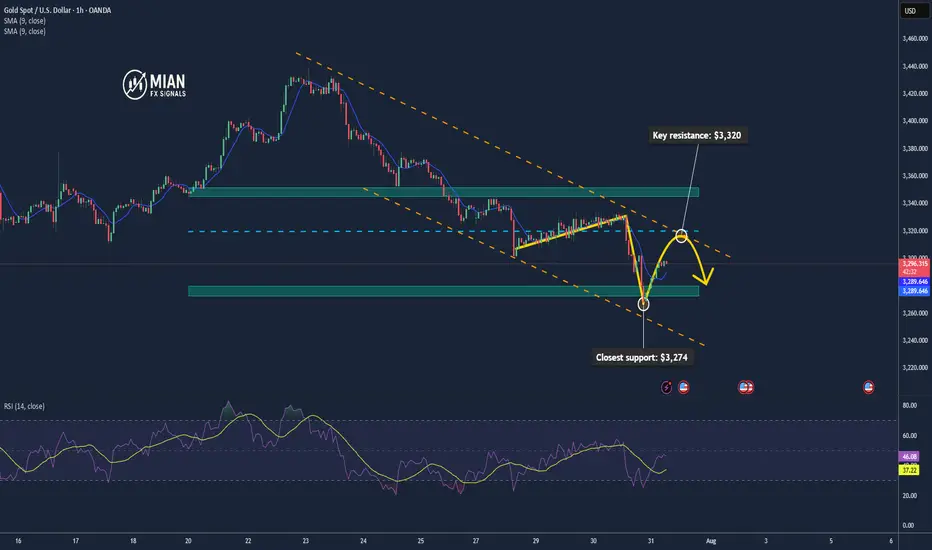
Gold May Rise Technically after Testing the $3,300 Zone📊 Market Overview:
Spot gold is trading around $3,295–$3,301/oz, influenced by slightly lower U.S. Treasury yields and a softer dollar tone. Analyst consensus from Reuters projects gold likely to stay above $3,220/oz through 2025 and possibly hit $3,400 in 2026 amid continued safe-haven demand
📉 Technical Analysis:
• Key resistance: $3,320 / $3,345
• Closest support: $3,274 – $3,280
• EMA09: Price is currently below the 9 period EMA on H1, indicating a short-term bearish bias.
• Candlestick / volume / momentum: There was a minor bounce from the support zone around $3,274, but volume remains low. RSI isn't oversold, suggesting room for technical pullback.
📌 Outlook:
Gold may experience a technical rebound if it holds above $3,280. A breakout above $3,320 would likely require clear catalyst—such as weak U.S. data or a dovish Fed tone.
💡 Suggested Trading Strategy:
SELL XAU/USD: $3,320 – $3,323
🎯 TP: 40/80/200 pips
❌ SL: $3,326
BUY XAU/USD: $3,279 – $3,282
🎯 TP: 40/80/200 pips
❌ SL: $3376
Gold May Dip Mildly Before US Data📊 Market Overview:
Spot gold is trading around $3,329/oz, up ~0.1%, supported by falling U.S. Treasury yields and a slightly weaker dollar, while investors await potential Fed dovish signals or rate cut in September . Meanwhile, easing U.S.–EU trade tensions weighed on safe-haven demand for gold.
📉 Technical Analysis:
• Key Resistance: ~$3,335–3,350 (recent highs and potential test zone)
• Nearest Support: ~$3,310 (previous stable support)
• EMA09 position: Price is above EMA9, indicating a mild bullish bias in the short term
• Momentum/Volume: RSI ~53 (neutral), MACD & StochRSI showing small buy signals. However, bullish momentum is fading, suggesting a possible mild pullback
📌 Conclusion:
Gold may dip modestly toward $3,310 if the dollar strengthens or if Fed rate-cut expectations recede. A break above $3,335–3,350 could pave the way for further gains, though current momentum remains insufficient to confirm a breakout.
💡 Suggested Trade Strategy:
SELL XAU/USD: $3,333–3,336
🎯 Take Profit: 40/80/200 pips
❌ Stop Loss: $3339
BUY XAU/USD: $3,310–3,308
🎯 Take Profit: 40/80/200 pips
❌ Stop Loss: $3305

Gold Buy SetupHi everyone
Hope you all had a good trading week so far, this is our buy setup we looking to see for Wednesday
Let us know in the comments what you think.

Gold Recovers After Sharp Drop – Trend Not Yet Reversed📊 Market Overview:
Gold rebounded from a sharp fall earlier in the session, rising from $3301 to around $3315 as the U.S. dollar weakened slightly and sellers took partial profit. However, no strong fundamental catalyst confirms a trend reversal yet.
________________________________________
📉 Technical Analysis:
• Key Resistance: $3315 – $3322
• Nearest Support: $3300 – $3295
• EMA 09 (H1): Price is currently just below EMA09, indicating a slight bearish bias
• Candlestick / Volume / Momentum:
• H1 candle shows a long lower wick at $3301 → some buying interest
• No H1 candle has closed above $3315 yet → no confirmed reversal
• Volume remains weak, RSI still under 50 → limited bullish momentum
________________________________________
📌 Outlook:
Gold may continue to consolidate between $3300 and $3315 in the short term. If it fails to close above $3315, bearish pressure could return toward $3295–$3288.
________________________________________
💡 Suggested Trade Setups:
🔻 SELL XAU/USD: $3315 – $3318
🎯 TP: 40/80/200 pips
❌ SL: $3323
🔺 BUY XAU/USD: $3295 – $3300
🎯 TP: 40/80/200 pips
❌ SL: $3285
Gold Continues Mild Uptrend – Watching for Reaction at $3351📊 Market Overview:
Gold maintained its bullish momentum during the Asian–European session, rising from $3330 to $3344. A slightly weaker USD and safe-haven demand supported prices. However, price is now approaching a key resistance zone, where technical rejection may occur in the U.S. session.
________________________________________
📉 Technical Analysis:
• Key near-term resistance: $3345 – $3351
• Stronger resistance (higher zone): $3360 – $3366 and $3374
• Nearest support: $3335 – $3332
• Stronger support (lower zone): $3322 – $3315
• EMA 09 (H1): Price is above EMA09 → confirms short-term uptrend
• Candlestick / Volume / Momentum:
• Price is consolidating in an ascending triangle
• A breakout above $3345 may target $3360+
• RSI remains below overbought; volume is stable → room for continuation
________________________________________
📌 Outlook:
If gold holds above $3335 and breaks above $3351, the uptrend could extend toward the $3366–$3374 zone. However, failure to break $3351 followed by a drop below $3332 could lead to a deeper pullback toward $3315.
💡 Recommended Trading Strategies:
BUY XAU/USD: $3318 – $3315
🎯 TP: 40/80/200 PIPS
❌ SL: $3321
SELL XAU/USD: $3360 – $3363
🎯 TP: 40/80/200 PIPS
❌ SL: $3357

Gold Bounces Back After Testing Key Support📊 Market Drivers
• Gold dropped to around $3,352, touching a key support zone, then quickly rebounded to $3,373, gaining over +20 points.
• The rebound is supported by continued weakness in the US Dollar and slight easing in Treasury yields, keeping gold attractive as a safe haven.
• Although some optimism around US-Japan trade negotiations slightly reduced risk aversion, it wasn’t enough to push gold below support.
📉 Technical Analysis
• Key Resistance:
o $3,397 – $3,400: psychological resistance and near the next bullish breakout zone.
o If breached, next target lies around $3,420–3,445.
• Nearest Support:
o $3,356 – $3,364: recently confirmed support zone that triggered the current rebound.
o Deeper support at $3,326 – $3,320 if the rebound fails.
• EMA (EMA50):
o Price remains above the 50-period EMA, indicating bullish momentum in the short term.
• Patterns & Momentum:
o Market structure shows a "rising low" pattern — a bullish signal that buyers are stepping in at higher levels.
o RSI was briefly in oversold territory and now supports a recovery bounce.
o If $3,356 holds, the upside targets remain valid toward $3,397 → $3,439.
📌 Assessment
• Gold has confirmed strong support at $3,356–3,364, with the rebound from $3,352 as proof.
• Short-term uptrend remains intact, unless the USD strengthens sharply or unexpected macro news hits.
• If gold breaks below $3,356, it may retrace toward $3,326–3,320, but the upside potential is currently favored.
💡 Suggested Trade Setups
BUY XAU/USD: $3,356–3,364
🎯 Take Profit: 40/80/200 pips
❌ Stop Loss: $3,346
SELL XAU/USD: $3,397–3,400
🎯 Take Profit: 40/80/200 pips
❌ Stop Loss: $3,407

Gold Pulls Back to Support Zone📊 Market Overview:
• Gold price fell sharply to $3,385/oz, after previously testing the $3,430 zone.
• Short-term profit-taking and anticipation of upcoming U.S. economic data (PMI, durable goods orders) caused a mild USD rebound, pressuring gold lower.
• Overall sentiment remains cautious as the Fed has yet to clearly signal a rate cut path.
📉 Technical Analysis:
• Key Resistance: $3,430 – $3,445
• Nearest Support: $3,382 – $3,368
• EMA 09: Price just broke below the 9 EMA, suggesting a potential deeper correction unless it rebounds quickly.
• Candlestick/Volume/Momentum: Bearish engulfing candle with rising volume – indicates strong selling pressure and momentum currently favoring the bears.
📌 Outlook:
Gold is undergoing a short-term correction, currently testing the strong technical support zone at $3,382 – $3,385. If this zone holds, we may see a rebound toward $3,410 – $3,420. If it fails, gold could slide further toward $3,368 – $3,350.
💡 Suggested Trade Strategies:
🔻 SELL XAU/USD at: 3,395 – 3,400
🎯 TP: 3,375
❌ SL: 3,405

Gold Likely to Rise as USD Weakens📊 Market Overview
Spot gold (XAU/USD) is trading around $3,423–$3,427/oz, down ~0.2% after news of a US–Japan trade deal boosted risk sentiment. However, a weaker USD and lower US bond yields continue to support safe-haven demand.
📉 Technical Analysis
• Resistance: $3,447 – $3,464 – $3,496
• Support: $3,399 – $3,367
• EMA9: Price is below EMA9 → short-term bearish; medium-term outlook remains bullish if price reclaims EMA20.
• Momentum indicators: RSI ~69; MACD & ADX favor buyers.
📌 Outlook
Gold may move sideways or edge higher if USD weakness persists. A rise in risk appetite (e.g. from trade deals) could pressure prices short term.
💡 Suggested Trading Strategy
🔻 SELL XAU/USD: $3,442–$3,445
🎯 TP: 40/80/200 pips | ❌ SL: $3,449
🔺 BUY XAU/USD: $3,402–$3,405
🎯 TP: 40/80/200 pips | ❌ SL: $3,399

GOLD Rejected from Reversal Zone – Retest + Bounced & Major High📌 1. Major High & Liquidity Grab
The chart starts by showing a strong impulsive move toward the upside that taps into a Major High zone (highlighted at the top). This is a classic MMC "liquidity grab" where price sweeps the previous high to trigger stop losses and collect orders before reversing. This is a common trap zone where retail traders get caught in FOMO buys.
📌 2. Reversal Area Identified
The price entered a clearly marked Reversal Area between $3,430 – $3,445. This zone acted as:
Historical supply area
Psychological resistance
Liquidity hunt zone
Upon entry, strong rejection candles formed, signaling institutional sell pressure. This reaction aligns with MMC principles where reversal is expected post-liquidity collection from major highs.
📌 3. Parabolic Curve Formation – Bullish Impulse
A beautifully formed parabolic curve (Black Mind Curve) supported the bullish rally from around $3,310 up toward the high. This shows accumulation → breakout → expansion. However, the curve has now been broken, suggesting that bullish momentum is weakening.
⚠️ This break of curve support is critical — it often leads to a corrective phase or a deeper retracement.
📌 4. Mini Reversal Zone + SR Interchange Zone
Price has now pulled back to a very important area: the Mini Reversal Zone + SR Flip Zone around $3,400. This zone previously acted as resistance and now has the potential to act as support (classic SR interchange).
According to MMC concepts:
If this zone holds → we may see a bullish bounce and potential re-test of the upper reversal area.
If this zone breaks → bears will likely push price toward the next demand level around $3,350 – $3,340.
This is the decision point — a “battlefield” zone where market direction can be decided.
📌 5. Potential Scenarios Ahead:
✅ Bullish Scenario:
Price respects the SR zone ($3,400)
Forms bullish engulfing / continuation pattern
Likely target: re-test of reversal zone ($3,430–$3,445)
Beyond that: breakout possible if volume supports it
❌ Bearish Scenario:
Price breaks below $3,395 with strong bearish candles
Could confirm the rejection from the major high and trigger a full retracement
Downside targets: $3,360 → $3,340 range
🔑 Final Thoughts:
This GOLD setup is a perfect case of MMC theory in action — liquidity grab at the top, rejection at reversal zone, curve break, and now testing critical SR flip area.
Keep an eye on:
Candlestick behavior at the SR zone
Volume confirmation
Momentum indicators (if using)
Wait for confirmation before jumping in — let the market reveal its hand at the decision zone.

Gold Maintains Strong Momentum, Eyes 3435+📊 Market Drivers:
• Gold prices surged as the USD weakened further and U.S. bond yields dropped.
• Investors are increasingly betting that the Fed may cut interest rates in 2025, boosting demand for gold.
• Ongoing trade tensions and expectations of comments from Fed officials are adding to bullish momentum.
📉 Technical Analysis:
• Key Resistance: 3435 – 3440
• Nearest Support: 3410 – 3415
• EMA09: Price is above the EMA09 → confirms short-term uptrend
• Pattern & Momentum: Clean breakout from the 3383–3390 range with strong volume, bullish momentum continues
📌 Outlook:
Gold may continue rising in the short term if it holds above 3415. A pullback could offer a chance to re-enter long positions near new support levels.
________________________________________
💡 Suggested Trade Setup:
🔺 BUY XAU/USD: 3415 – 3418 (on pullback)
🎯 TP: 40/80/200 pips
❌ SL: 3412
🔻 SELL XAU/USD: 3435 – 3438 (key resistance)
🎯 TP: 40/80/200 pips
❌ SL: 3442

Gold Could Extend Rally if Breaks 3,400📊 Market Overview
Gold is currently trading around 3,400 USD/oz, up approximately +1.41% over the past 24 hours.
The upward momentum is supported by a weakening US Dollar following dovish-leaning remarks from the Fed, along with growing demand for safe-haven assets amid trade uncertainties.
📉 Technical Analysis
• Key Resistance: ~3,400–3,405 USD (psychological zone; a break above could open the path for further gains).
• Nearest Support: ~3,370–3,375 USD, followed by 3,345–3,350 USD, which marks today’s low.
• EMA 09/20: Price is currently trading above both EMA 9 and EMA 20, confirming a short-term uptrend.
• Momentum / Oscillators: RSI is in the overbought zone; MACD and ADX still show a “buy” signal → bullish trend continues, but watch for possible technical pullbacks.
📌 Opinion
The price may continue to rise if it breaks above the 3,400 USD/oz level, especially if the USD remains weak and safe-haven flows continue to support gold. However, if there’s short-term selling pressure or a USD rebound, gold may pull back toward the 3,370–3,375 USD support zone.
💡 Trade Setup
SELL XAU/USD at: 3,400–3,405 USD
🎯 TP: 3,380 USD
❌ SL: 3,410 USD
BUY XAU/USD at: 3,370–3,375 USD
🎯 TP: 3,390–3,395 USD
❌ SL: 3,360 USD
Gold Approaches New Resistance – Potential Short-Term Pullback📊 Market Update
Gold is currently trading around $3,368–$3,370/oz, up approximately 0.5% today, supported by a weaker USD and slightly declining US Treasury yields. This comes amid global trade concerns and expectations that the Fed may adjust policy in upcoming meetings.
📉 Technical Analysis
•Key Resistance: $3,375–$3,380 (pivot R2: $3,374.9, R3: $3,389.6)
•Nearest Support: $3,360 (S1: $3,335.8)
•EMA: Price is trading above the EMA9 / EMA20 / EMA50 / EMA200, confirming a strong uptrend
•Candlestick / Volume / Momentum:
o MACD & ADX still confirm strong bullish momentum
o Price consolidating in a rectangle range of $3,352–$3,366 → watch for breakout or rejection at resistance
📌 Outlook
Gold may pull back slightly if it fails to break through the $3,375–$3,380 resistance area and RSI continues hovering near overbought levels.
💡 Suggested Trade Strategy
🔻 SELL XAU/USD at: $3,375–$3,380
🎯 TP: 40/80/200 pips
❌ SL: $3,385
🔺 BUY XAU/USD at: $3,345–$3,348
🎯 TP: 40/80/200 pips
❌ SL: $3,339

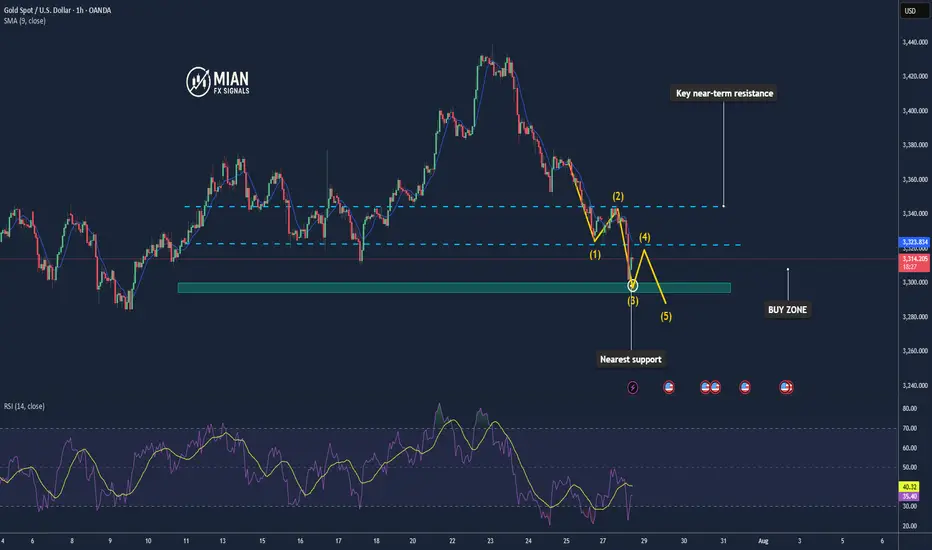
Gold SELL SetupHi everyone
This is our out look for Monday trading day. We have completed a second wave retracement & can sell off from 3354 to 3328 possible.
Always remember to apply proper risk management.
Let us know in the comments what you think of the setup & where you see gold go.

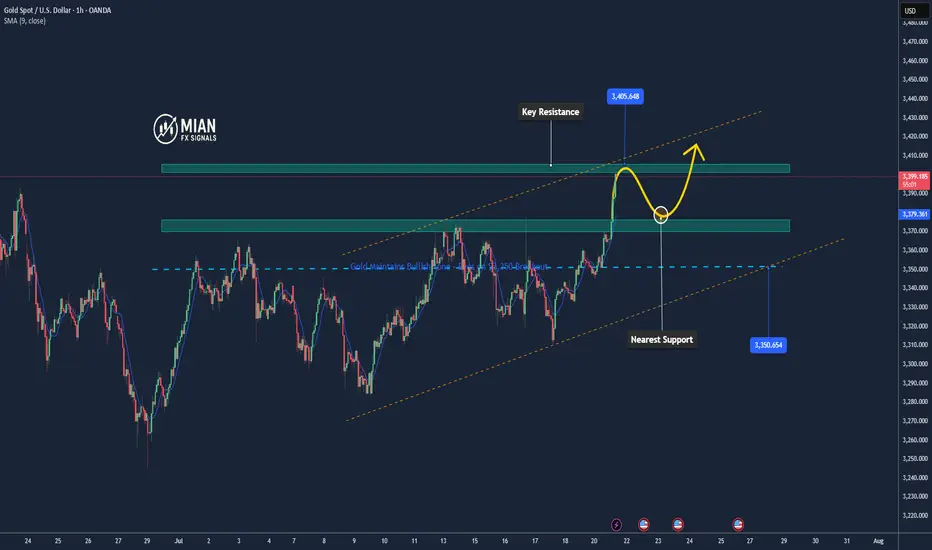
Gold Maintains Bullish Tone – Eyes on $3,350 Breakout📊 Market Overview
• Gold is trading around $3,339 – $3,340, after rebounding from the session low at $3,332.
• The USD is temporarily weakening, and safe-haven flows remain steady — key factors supporting gold.
• Markets are awaiting fresh U.S. economic data for clearer directional cues.
📉 Technical Analysis
• Key Resistance Levels:
– Near-term: $3,344 – $3,345
– Extended: $3,352 – $3,356 (weekly highs)
• Key Support Levels:
– Near-term: $3,332 – $3,335
– Extended: $3,320 – $3,325 (MA confluence + technical base)
• EMA: Price remains above EMA 09, confirming a short-term uptrend.
• Candle Pattern / Volume / Momentum: RSI is around 54–56; momentum remains positive but has cooled — suggesting potential consolidation.
📌 Outlook
Gold is maintaining a bullish technical structure — if it breaks above $3,345, a move toward $3,352 – $3,356 is likely. On the downside, a drop below $3,332 could trigger a retest of $3,325 – $3,320.
💡 Suggested Trading Strategy
🔺 BUY XAU/USD: $3,324 – $3,327
• 🎯 TP: 40/80/100 pips
• ❌ SL: $3,320
🔻 SELL XAU/USD :$3,352 – $3,355
• 🎯 TP: 40/80/100 pips
• ❌ SL: $3,359
