XAUUSD - 4H Bearish Rejection from Supply Zone | SMC AnalysisGold is showing signs of weakness after reacting strongly from a 4H Supply Zone around the 3331.72 level. Price tapped into the red supply zone, failed to break above, and is now forming lower highs — suggesting bearish momentum is building.
🔍 Key SMC Observations:
Supply Zone: Price rejected the 3331.72 level, which acted as a clear supply area based on past liquidity grabs and bearish institutional moves.
Change of Character (CHoCH): We saw a CHoCH around July 5th–6th, indicating a shift from bullish to bearish order flow.
Lower High Formation: Price failed to make a new high after tapping supply, showing signs of distribution.
Imbalance + Target Zone: Clean imbalance exists down to 3288.73 and potentially to the green demand zone around 3260–3270.
📍Trade Setup Idea:
Sell Opportunity: If price continues to reject the supply zone, look for bearish confirmation on the lower timeframes (e.g., 1H) to enter.
Target 1 (TP1): 3288.73 (near-term liquidity level)
Target 2 (TP2): 3260–3270 demand zone
Invalidation: A break and close above 3331.72 would invalidate the short-term bearish bias.
🔴 Watch for reaction around 3288.73 – if it holds, expect a possible bounce. If broken, further downside is likely.
Goldshort

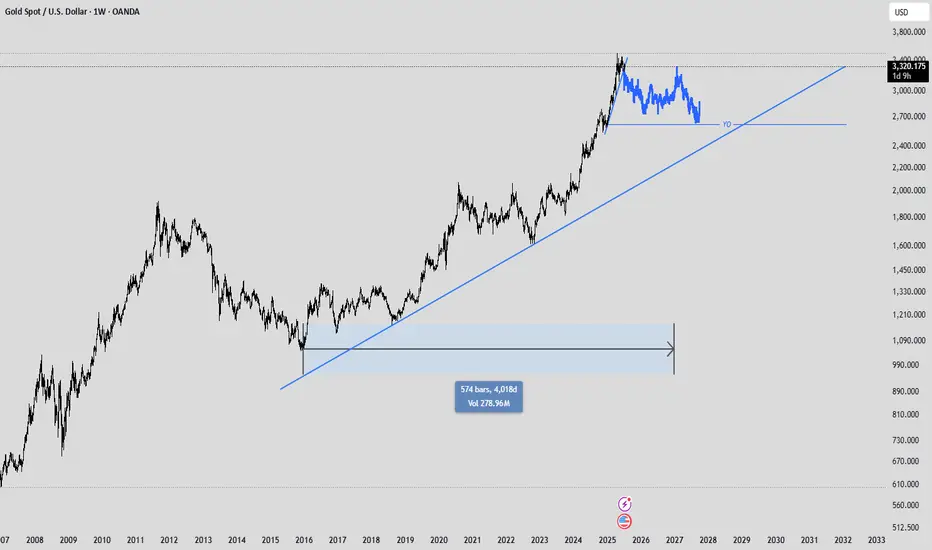
GOLDI believe gold will slowly retreat over the next two years, with a long-term price movement, to around 2625, the opening price of 2025. This movement may be similar to the movement between 2020 and 2022.
Gold Drops to 3,284 – Short-Term Support at Risk📊 Market Overview
Gold fell sharply this morning to $3,284/oz amid a modest USD rebound and profit-taking pressure following several range-bound sessions. The lack of fresh catalysts also contributed to weaker momentum.
📉 Technical Analysis
• Key Resistance: 3,315 – 3,330
• Nearest Support: 3,280 – 3,275
• EMA 09: Price is currently trading below the EMA 09 on both the H1 and H4 timeframes → short-term bearish signal
• Candle Patterns & Momentum:
– H1 candle shows a bearish engulfing pattern near the 3,305 area → confirms downward pressure
– RSI is below 45, MACD has crossed below its signal line → bearish momentum dominant
– If the 3,275 level is breached, gold could continue to fall toward 3,260
📌 Outlook
Gold is leaning toward further downside unless it can hold above the 3,280 support level during today’s session.
💡 Trade Strategy
🔻 SELL XAU/USD at: 3,295 – 3,398
🎯 TP: 40/80/200 PIPS
❌ SL: 3,305
🔺 BUY XAU/USD at: 3,275 – 3,278
🎯 TP: 40/80/200 PIPS
❌ SL: 3,269

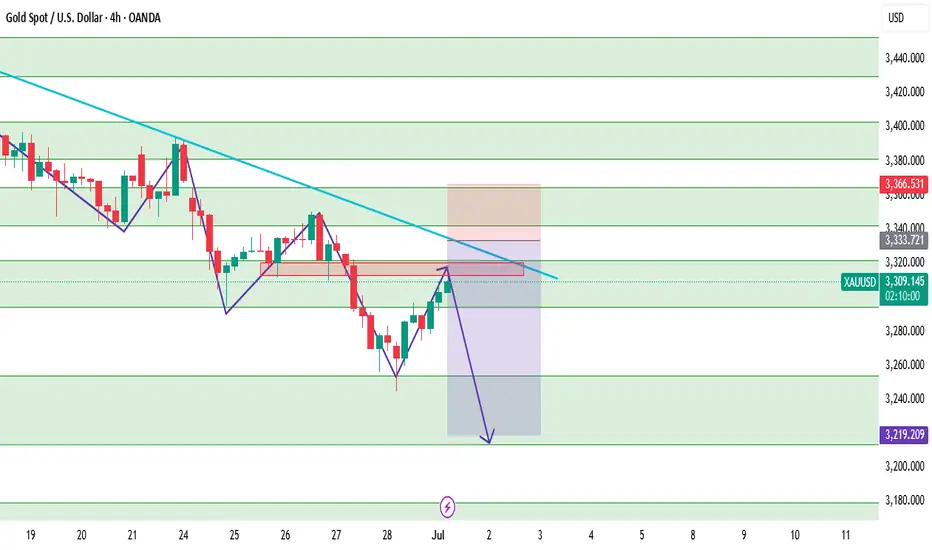
Gold Under Pressure as Dollar Strengthens – Watch Below 3297FX:XAUUSD – Technical & Fundamental Outlook
Gold prices declined on Monday, pressured by a stronger U.S. dollar following President Trump’s announcement of a potential 10% tariff on BRICS-aligned countries. The news supported the dollar and weakened demand for gold as a safe-haven asset.
Although uncertainty remains around U.S. trade negotiations ahead of the July 9 tariff deadline, signals of possible extensions and staggered implementation have further reduced short-term haven flows into gold.
Technical View:
Gold remains under bearish pressure while trading below 3320.
As long as the price stays under this level, we expect sideways consolidation between 3297 and 3320 until a breakout occurs.
A 1H close below 3297 would confirm bearish continuation, targeting 3281 and 3255.
A break above 3320 would invalidate the bearish outlook and shift momentum toward 3342.
Pivot: 3297
Support Levels: 3281 / 3255 / 3239
Resistance Levels: 3314 / 3320 / 3342
Previous idea: Click Here...

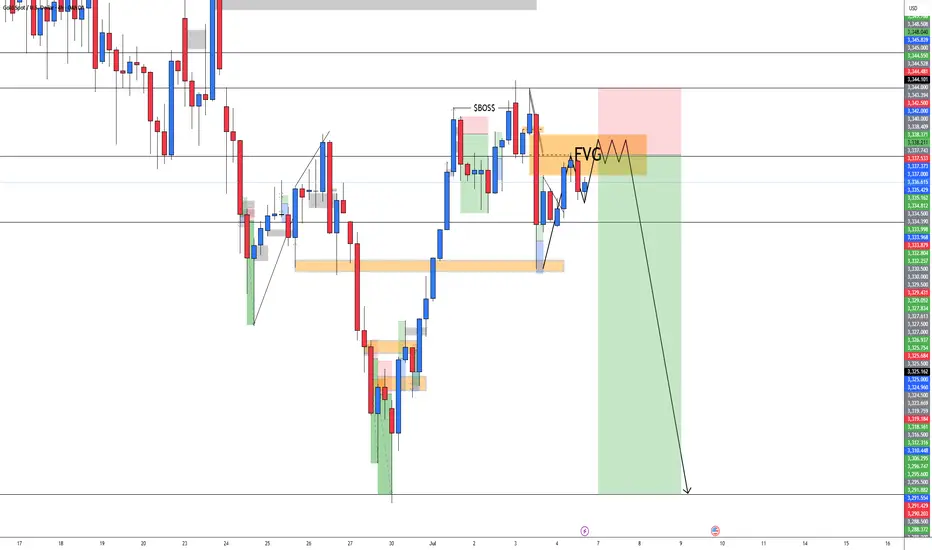
GOLD SHORT TRADE Gold Short Trade Setup !
Gold Sweep Liquidity And Make A Market Structure MSS + LIQUIDITY + FVG !
Se We Are Selling Gold At FVG Area
Giving You Signal Guys !
Gold Sell FVG ( 3315 - 3325 )
Stoploss : ( 3331 )
Target Level : 3310, 3305, 3300, 3290, 3280
Hop You Got The Signal Enjoy it See You In Another Setup !

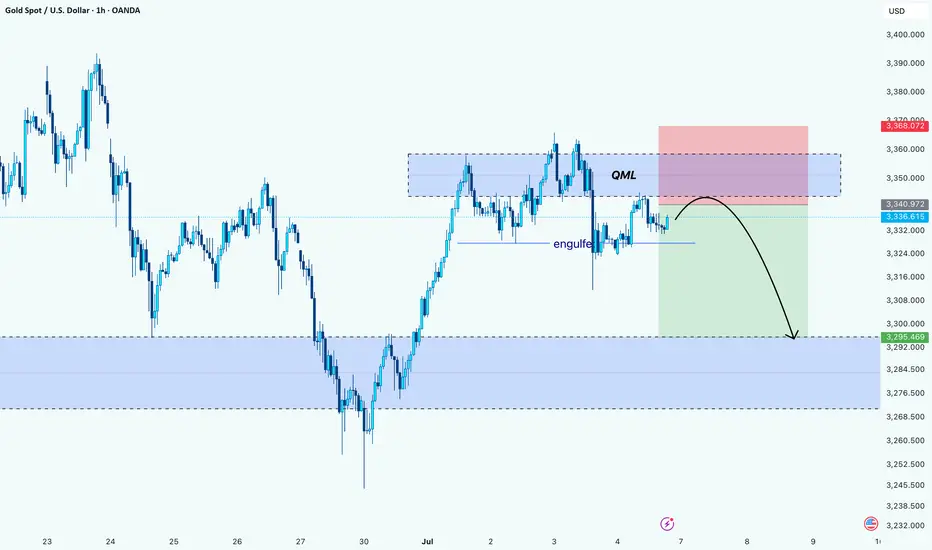
Gold’s Trap Above QML: Bearish Play UnfoldingHello Guys!
Gold appears to be forming a textbook Quasimodo reversal setup after printing a lower high into a key supply zone. Price aggressively tapped into the QML area (around 3,350–3,360), where sellers previously stepped in, and we’re now seeing signs of rejection.
The engulf zone marked earlier confirms bearish intent. It broke structure and flipped momentum. Price is currently retesting below that engulf level, likely as a last attempt to grab liquidity before heading down.
The projected move suggests a drop toward the next significant demand zone around 3,295–3,285, where the price previously found a strong bullish reaction.
Bias: Bearish below QML
Target: 3,295 zone
Invalidation: Above 3,368 (high of supply zone)
Gold (XAU/USD): Playbook in ActionHello guys!
We’ve seen a textbook QML (Quasimodo Level) setup play out beautifully on gold. Price pushed into a key supply zone and formed a QML structure, followed by a clean engulfing of the previous demand. confirming smart money involvement. As expected, the target of that QML has now been hit, tapping into the major demand zone below.
After the deep sweep and reaction from demand, price retraced upward into a potential lower high area. Based on structure and liquidity dynamics, two potential scenarios are in play:
We’re executing a two-step plan here:
Step 1: Short position from the QML + supply area, aiming for the next blue demand zone. Liquidity has been taken above the high, confirming the setup.
If we get a clean reaction near the blue area, that’s our signal to flip long. We expect a pullback toward $3310 area.

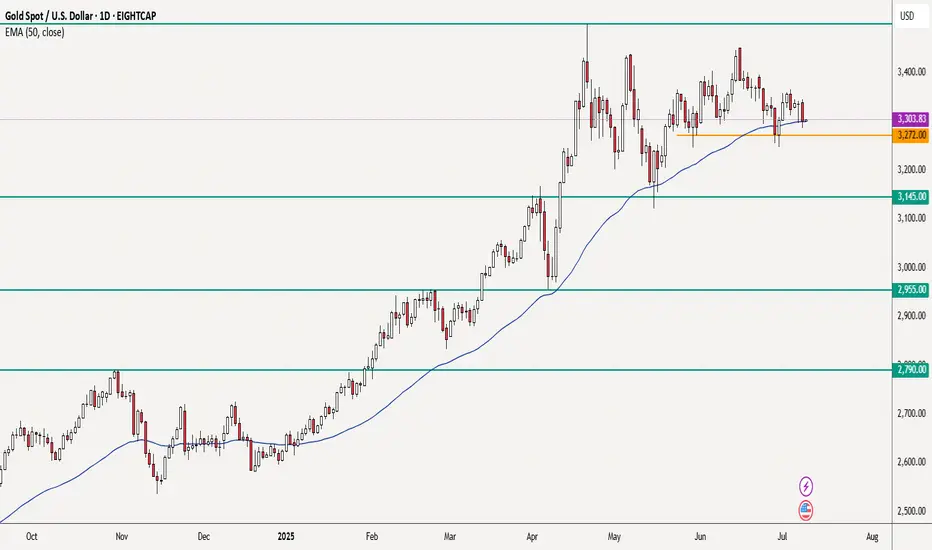
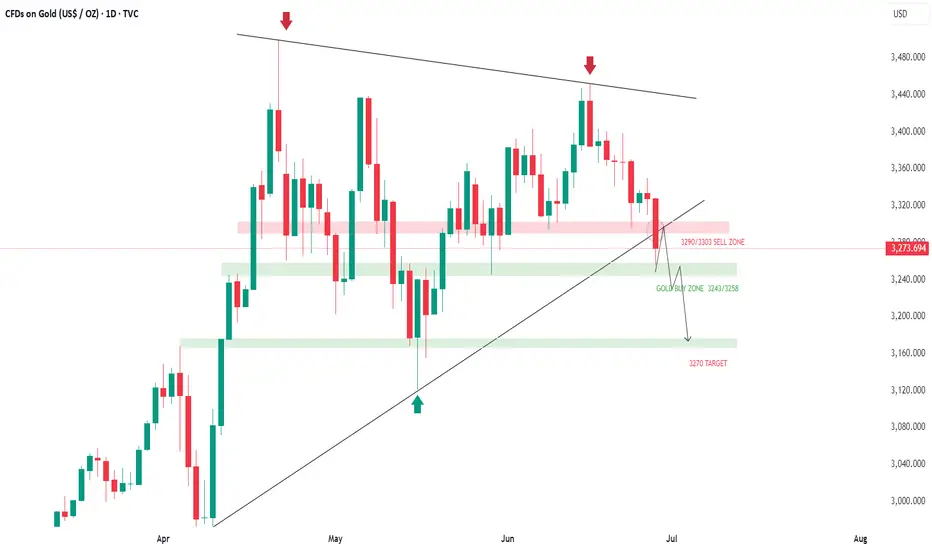
Gold - Time to short XAUUSDIt may be difficult to have a bearish bias on gold, but the chart is saying sell!
After a prolonged bull run, you can see how price got rejected at $3,500. Subsequent bullish moves became weaker and weaker, you may even see a H&S pattern but more importantly the latest weaker bounce seems to indicate that the local support at 3272 may soon break.
If this plays out as I think, a nice trade will setup. I also took a quick look at the H1 chart and noted that we already have lower daily central pivots. Looking forward to see how PA in the next couple of days develops.
This is not a trade recommendation; it’s merely my own analysis. Trading carries a high level of risk so carefully managing your capital and risk is important. If you like my idea, please give a “boost” and follow me to get even more.
GOLD1! Best Key Level !!This is the 1 hour Chart of Gold!.
Gold is forming a bearish structure and is consistently respecting the resistance zone, leading to a downward move. The key resistance area is between 97,800 and 97,400..
Gold is finding support in the 96,250 – 96,330 zone on the short time frame.
A breakdown below this level may trigger aggressive selling pressure.
Thank you !!

XAUUSD BEARISHAccording to the SMC and FVG concept, I am seeing bearish momentum in Gold. We have to wait for the proper rejection from FVG to sell the GOLD.
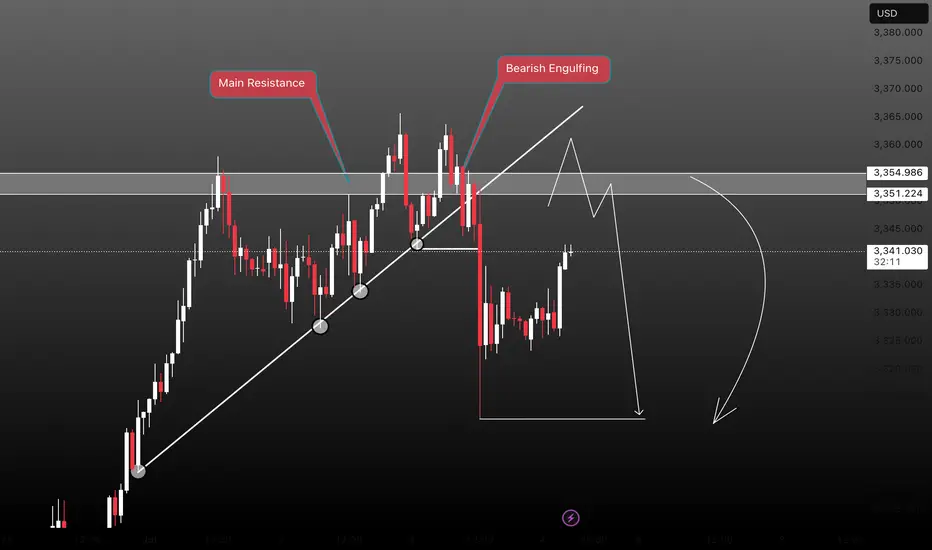
GOLD SHORT TRADEH1 TIMRFAME
1st Zone GOLD SHORT TRADE AT MAIN RESISTANCE AND ENGULFING ZONE
2nd Zone GOLD SHORT TRADE TLBP PULLBACK SELL AT SELL TRENDLINE
1st Signal : GOLD SELL MAIN RESISTANCE 3351- 3355
Stoploss : 3360
TP Level - 3345, 3340, 3335, 3330
2nd Signal : GOLD SELL TLBP PB TL 3360 - 3366
Stoploss : 3372
TP Levels - 3355, 3350, 3345, 3340, 3335, 3330
Manage Your Trade Properly
XAUUSD (GOLD): Sell setupXAUUSD (GOLD): Sell setup. It is ready for a sell, it will open in Asian session, and also market is complex now, but here is my plan.
Cheers

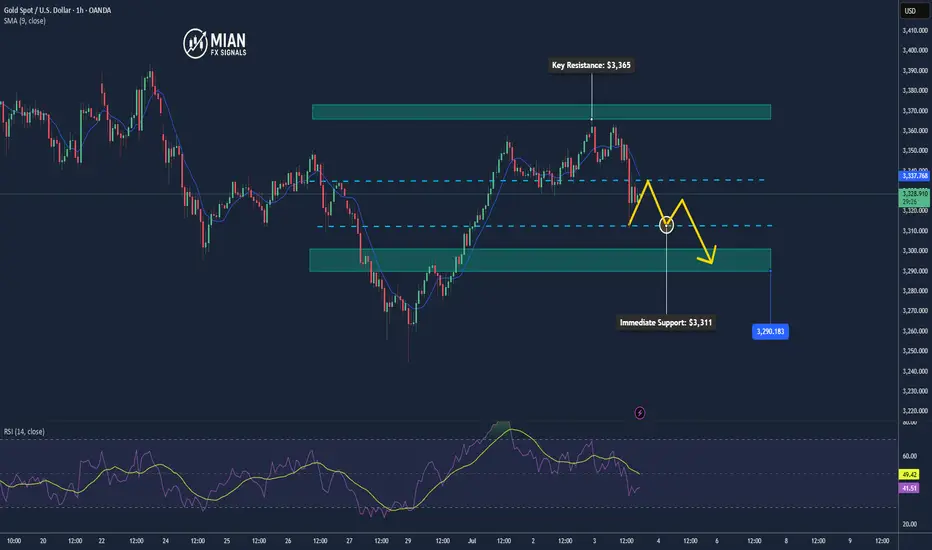
Gold Drops as NFP Beats, USD Gains📊 Market Overview:
• June’s Non-Farm Payrolls came in stronger than expected at +147K (vs 110K forecast), with unemployment ticking down to 4.1%.
• The US Dollar surged (DXY up ~0.5%) and Treasury yields rebounded following the release.
• Gold dropped sharply after the report, hitting a session low of $3,311 and is now trading around $3,328.
📉 Technical Analysis:
• Key Resistance: $3,364
• Immediate Support: $3,311
• EMA 09 (H1): Price is below the 09 EMA → confirms short-term bearish trend.
• Pattern / Momentum: A bearish engulfing candle near $3,364 signaled strong seller control. The failure to bounce afterward suggests persistent bearish pressure. RSI is tilting lower, confirming weakening momentum.
📌 Outlook:
Gold may continue to decline toward the $3,300–$3,290 area if USD and yields remain firm, especially if upcoming US data (such as ISM Services PMI) also supports the dollar strength.
💡 Suggested Trade Setup:
🔻 SELL XAU/USD at: $3,333 – $3,335
🎯 TP: $3,300
❌ SL: $3,339
🔺 BUY XAU/USD at: $3,293 – $3,290
🎯 TP: $3,330
❌ SL: $3,287
XAUUSD 4H SHORTPrice broke out of the bearish trend line and moved sideways in a range forming two tops or a double top.
Fundamentally, US jobs data came out positive keying into hawkish tone on interest rate and influenced CPI.
Price broke the neckline after 4H closure giving signal for bearish move to $3250 support.
Here’s my little idea on GOLD. Follow for more.

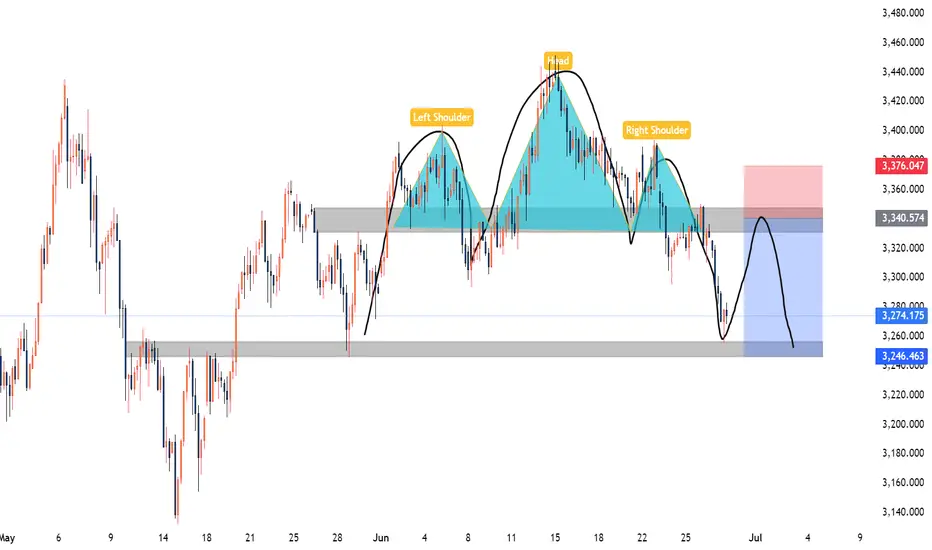
XAUUSD Weekly Analysis 30 June 4 July 2025Gold has formed a Head and Shoulders (H&S) pattern on the H4 timeframe. While the pattern is not perfectly symmetrical, it is still valid and clearly recognizable. The price has broken below the neckline, confirming a potential shift in market structure to the downside.
Analysis Insight:
The 3340–3350 area, previously a support zone, is now acting as resistance following the neckline break. A pullback to this zone may present a high-probability short opportunity for swing traders, especially if price shows rejection or bearish structure in that zone.
Trade Type: Swing
Trade Setup – Sell on Retracement:
Bias: Bearish on confirmation of retracement rejection
Entry Zone: 3340 – 3350
Stop Loss: 3376 (above right shoulder/high)
Take Profit: 3320/3300/3285/3260
Risk-Reward Ratio: Approximately 1:2
Kindly follow, share, like, support and comment.
Gold May Pull Back After Day’s High📊 Market Overview:
• Gold is currently trading around $3,350/oz, with the daily high at $3,366/oz.
• The rally stalled as traders took profits near the session high, while a slight rebound in the USD and rising U.S. Treasury yields weighed on gold’s momentum.
📉 Technical Analysis:
• Key Resistance: ~$3,366 (today’s high), with next level at ~$3,375–3,380 if breached.
• Nearest Support: ~$3,342 (intra-day low), stronger support seen at $3,329–3,330.
• EMA 9/21: Price is hovering near the EMA21 (~$3,350); this area is crucial to determine the short-term trend.
• Candle/Momentum Indicators:
o RSI is around 53-55, signaling a neutral stance;
o MACD shows weakening bullish momentum after hitting resistance.
📌 Viewpoint:
Gold may see a minor pullback in the short term, possibly testing the $3,342–3,329 zone after reacting to the daily high. However, if it holds above EMA21 and EMA50, the medium-term bullish trend remains intact.
💡 Suggested Trading Strategy
SELL XAU/USD at: $3,363–3,366
🎯 TP: 40/80/200 pips
❌ SL: $3,370
BUY XAU/USD at: $3,329–3,332
🎯 TP: 40/80/200 pips
❌ SL: $3,325

Gold may need to retreat to around 3300 againYesterday, the gold rebound stopped at around 3358, and then began to retreat. After that, it even failed to stand above 3350 during the rebound process, which to a certain extent hit the confidence of the bulls;
At present, gold has retreated to the area near 3330 again. Although gold has fallen slowly, the center of gravity of gold is still shifting downward in the short term, and the trading volume of gold is gradually increasing when it is falling, so I think the short position may not be over, and the 3330 area may be broken at any time; and the support area that really deserves our attention is first the 3320-3315 area, followed by the 3300-3295 area;
From the current gold structure, I think gold may still test the area near 3300 again before rising. Only after gold retreats to the area near 3300, it is possible to build an A-B-C head and shoulders bottom structure at the technical level (as shown in the figure), which can also help gold build a complete and effective rising structure, so gold has the need to retreat to the area near 3300 to build a right shoulder structure.
Therefore, I think shorting gold is still the first choice for short-term trading at present; you can consider shorting gold in the 3335-3355 area, looking at the target area of 3320-3310-3300.

Short-term opportunities are imminent.Gold prices have continued to rebound recently and have reached around 3358, but there is a lack of effective retracement during the rise, and the risk of short-term chasing has increased significantly. From a technical perspective, the US dollar index has a demand for a corrective rebound after a rapid decline, and it is expected to form a significant suppression on gold in the short term, limiting the rebound space of gold prices. From a capital perspective, the previous high-level long chips have gradually been untied and started to leave the market with profits, and selling pressure has gradually emerged; short positions may be re-arranged after completing concentrated stop losses, and the market structure is quietly changing.
Based on the above factors, it is recommended that traders remain patient and continue to hold short positions, focusing on the support of the 3335-3325 area. Be sure to control your position during the operation, strictly set stop losses, and avoid the high risks brought by chasing the rise. The core of trading is to follow the trend, respect the market rhythm, and wait for the adjustment to be confirmed before intervening.
Steady trading can only make long-term profits. Welcome everyone to share and communicate to improve the operation level together.

XAUUSD – Technical Outlook 4HXAUUSD is currently undergoing a corrective move after last week's bearish continuation. Price is now testing the minor resistance zone of 3295–3322, and could potentially extend the correction to test the descending trendline near 3333–3342.
The overall market structure remains bearish, with lower highs and lower lows clearly intact. Price has yet to break above the dynamic resistance trendline or the key swing high at 3366 — making any bullish move at this stage corrective, not a reversal.
Unless we see a strong bullish break and close above 3366, we expect sellers to return once price reaches the trendline or supply area around 3333–3342.
📌 Trade Plan (Sell on Pullback)
Sell Limit: 3333–3342
SL: 3368
TP1: 3296
TP2: 3255
TP3: 3220
📊 Key Levels:
R2: 3342
R1: 3322
Pivot: 3295
S1: 3254
S2: 3214
S3: 3180
Summary: Wait for bearish confirmation at the supply zone before entering. Bias remains bearish until proven otherwise by a structural break above 3366. Use smaller lot size or scale in slowly if price approaches the sell zone with weak bullish momentum.
Short gold, it will fall again when encountering resistanceIn the short term, gold retreated to around 3274 and then rebounded again, and it is only one step away from 3300. Will gold regain its bullish trend again?
I think it is difficult for gold to break through in the short term. Although gold retreated to around 3274 and successfully built a double bottom structure with the second low point and the low point of 3245, it only increased the rebound space; it is not enough for gold to regain its bullish trend. Since gold fell and broke through, the confidence of bulls has been hit hard. The previous support at the technical level has formed a strong resistance area after the top and bottom conversion, and to a certain extent helped the short force. In the short term, gold faces resistance in the 3310-3320 area. Before gold breaks through this area, the short energy still has the upper hand.
Therefore, shorting gold is still the first choice for short-term trading.
It is appropriate to consider shorting gold in batches in the 3300-3320 area, and look at the target: 3385-3375-3365

GOLD DAILY OUTLOOK | BEAR MARKET STRUCTURE CONFIRMED 📉 Trend Reversal Underway – Prepare for Lower Levels
The daily structure on Gold (XAUUSD) confirms a shift from accumulation to distribution.
Here's what stands out:
🔻 Key Breakdown Factors:
Failure at O_FIB Rejection Zone
The price failed to sustain above the upper Fib extension and supply zone (marked in red). Multiple attempts at reclaiming this level have resulted in sharp rejections, signaling exhaustion of buyers.
Break of Mid-Range Structure
We've decisively closed below the range midpoint, with strong bearish daily candles. This confirms loss of control by bulls and opens the door for a move toward deeper retracement zones.
Support Zones Exposed
The 0.618 FIB & 100 MA area around ~3160 is now a primary target. This zone held previously, but repeated touches weaken structure.
The 1.0 FIB & 200 MA zone around ~2960 is the macro support target. If sentiment continues to deteriorate, this will be the magnet.
EMA Crosses Rolling Over
Price has decisively lost the 9/21 EMA zone. Until a daily close reclaims this zone (~3335+), bearish momentum remains valid.
📉 Bearish RSI Momentum
While not a primary signal, RSI confirms momentum divergence and bear control below the midline. No sign of reversal.
🎯 Bearish Bias Until Reclaim of 3335 Zone
📌 Next Target = 3160, then 2960
🛑 Invalidation = Daily close above 3340 with strong volume and reclaim structure
This is not a short-term pullback — it's the beginning of a deeper correction. Gold is no longer in the “safe-haven” trade. Be patient, position with structure, and let the trend do the work.
Focus will be on fading the traps on pullbacks into structure.

gold bearish trading ideagold bearish trading idea gold breakdown traingle now gold next move [possible to sell target 3170
Gold Drops Sharply – Breaks Below the $3,300 Support📊 Market Overview:
Gold has plunged to $3,290/oz, breaking the key psychological level of $3,300 as the US dollar strengthened and Treasury yields ticked higher. Market sentiment has turned defensive ahead of Friday’s US PCE inflation data, with expectations that the Fed may maintain its hawkish stance for longer.
📉 Technical Analysis:
• Key Resistance: $3,310 – $3,325
• Nearest Support: $3,285 – $3,272
• EMA09: Price is currently below the 9-period EMA, confirming short-term bearish momentum.
• Candlestick / Volume / Momentum:
o H1/H4 charts show a series of long bearish candles, with rising volume → strong selling signal.
o RSI is approaching oversold levels (~28), MACD remains in a widening bearish divergence → downward pressure is still dominant.
📌 Outlook:
Gold is in a clear downtrend and may extend its decline toward $3,285 – $3,272 unless a reversal is triggered by weaker-than-expected PCE data or renewed geopolitical tensions. In the near term, any technical rebound is likely to offer sell opportunities rather than a trend reversal.
💡 Suggested Trade Setup:
🔻 SELL XAU/USD
• Entry: $3,300 – $3,305 (on technical retracement)
• 🎯 TP: $3,285 – $3,272
• 🛑 SL: $3,315
🔺 BUY XAU/USD (high risk)
• Entry: $3,272 – $3,277 (short-term bottom catching)
• 🎯 TP: $3,295 – $3,305
• 🛑 SL: $3,262
