Gold XAUUSD Possible Move 9th June 2025Market Structure:
The overall trend remains bearish, with a series of lower highs and lower lows.
Recent bullish retracement is corrective and approaching a key supply zone (3340 region).
Zones of Interest:
Supply Zone (Sell Area): 3335–3340
This area acted as a previous area of institutional selling. Price is expected to tap into this zone before resuming the downward move.
Demand Zone (Target): 3295–3305
This level served as a previous strong demand zone and aligns with previous reaction zones.
Liquidity & Structure:
Liquidity grab expected above minor highs around 3330–3335 before a potential reversal.
Structure shows a liquidity sweep, followed by a market shift confirming the bearish move.
Key Confluences:
Bearish market structure
Return to supply
Clear risk-to-reward setup
Anticipated lower high formation
Clean FVG + OB alignment in supply zone
📉 Trade Idea / Signal
Type: Sell Limit
Entry: 3335–3340
Stop Loss: 3355 (above supply zone highs)
Take Profit: 3320
Take Profit: 3300
Risk–Reward: ~1:3
🧠 Trade Plan
Wait for price to enter 3335–3340 zone.
Look for confirmation (e.g., bearish engulfing, BOS, CHoCH on LTF).
Execute short with SL above the zone.
Target the 3300 handle which aligns with the HTF demand zone and price imbalance fill.
Goldshort

XAUUSD Gold Short: Premium Tap Into OB + Reversal Loading XAUUSD (30-Min) | Premium Rejection + Order Block + Fib Stack for Intraday Short
This GOLD setup is a surgical-grade short play — combining institutional Order Block, Fibonacci Premium Levels, and liquidity rejection for a high RRR sniper entry.
🔍 Smart Money Setup Breakdown:
🔴 Bearish Order Block Zone (OB)
Strong bearish engulfing forms OB between 3,312.949 and 3,319.292
Price is currently reacting off 70.5% – 79% Fib zone — a premium region
Bears defending aggressively as price fails to break above
📐 Fibonacci Confluence
Fib drawn from recent swing high to swing low
Price retraced cleanly into 70.5% – 100% range
Current rejection forming just under 79% Fib at 3,312.949
OB + Fib = sniper confluence
📉 Bearish Reversal Behavior
Candle structure shows bullish exhaustion
Wicks into premium followed by strong rejections
Upcoming bearish candle could confirm shift in momentum
🎯 Target Zones Based on Fib Extensions
50%: 3,306.000
0% (Full move): 3,293.500
Extended TP: 3,288.000 for deeper draw
🧠 Chart Ninja Entry Plan:
🔹 Entry Zone 3,311.510 – 3,312.949 (OB + Premium zone)
🔻 SL Above 3,319.292 (above 100% + OB high)
📉 TP 1 3,306.000 (mid move)
📉 TP 2 3,293.500 (measured move)
⚖️ RRR Estimated 1:4+ depending on execution precision
🧠 Chart Ninja Wisdom:
"Gold respects the money, not the noise. If you know where Smart Money hides,
you’ll always catch the move before the herd even blinks." 🥷✨
🔁 Bonus Insight:
You can clearly see the liquidity engineered below 3,308 and resting near 3,293.5. Price may wick these areas fast, so set alerts or stagger TPs if you’re managing this intraday.
🚨 Chart this setup and watch for the breakdown confirmation
💬 What’s your SL placement for this? Drop it in the comments

Gold XAUUSD Short 5th May 2025Price is approaching a strong supply zone at 3384–3386, where we’ve previously seen aggressive selling. If we get clear signs of rejection from this level (e.g., wicks, bearish engulfing, or failure to break above), I’ll be looking to enter short positions.
The structure shows a potential lower high forming, and if confirmed, we could see continuation to the downside toward recent support levels.
📉 Trade Signal
Bias: Sell
Entry Zone: 3384–3386 (on rejection)
Stop Loss: Above 3395
Take Profit Levels:
– TP1: 3370
– TP2: 3360
– TP3: 3345
⚠️ Note: Trade only if rejection is confirmed in the zone (e.g., bearish PA or failed breakout on 5m–15m).

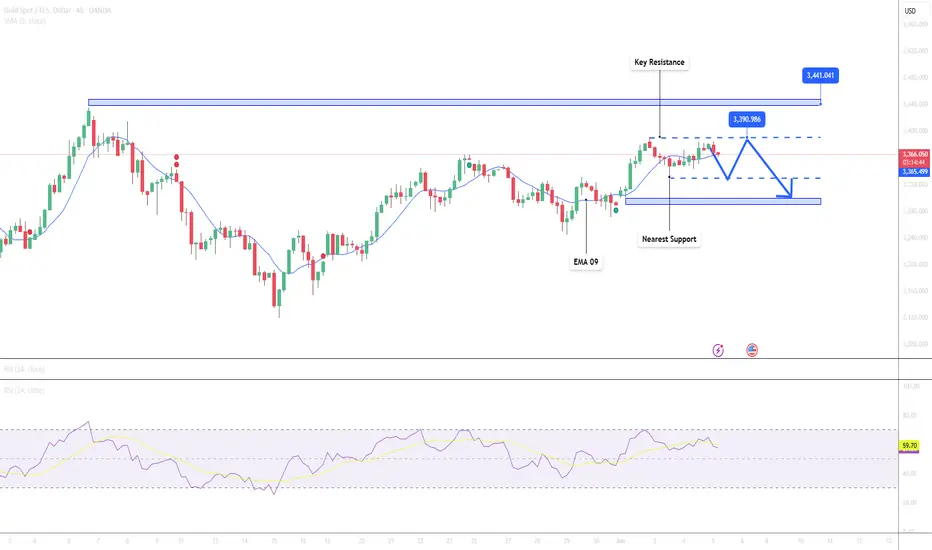
Gold Approaches Key Resistance – Minor Pullback Possible📊 Market Overview:
Gold prices continue their upward momentum and have now reached $3,367/oz, as markets await the upcoming U.S. Nonfarm Payrolls (NFP) report later this week. The U.S. dollar is slightly weaker and Treasury yields are stable, helping gold maintain its strength. However, mixed forecasts from major financial institutions are creating psychological pressure on investors.
📉 Technical Analysis:
• Key Resistance: $3,390 – $3,440
• Nearest Support: $3,330 – $3,300
• EMA: Price remains above both EMA 50 and EMA 9 → indicating a sustained uptrend.
• RSI (H4): Near 66 → not overbought yet, but limited room for further upside.
• Candle pattern: Recent H1 candles show long upper wicks → signaling profit-taking at higher levels.
📌 Outlook:
Gold may face a minor short-term correction if it fails to break above the $3,390 resistance area, especially as the upcoming U.S. jobs report could potentially strengthen the U.S. dollar.
💡 Suggested Trading Strategy:
SELL XAU/USD at: $3,375 – $3,390
🎯 TP: $3,355
❌ SL: $3,405
BUY XAU/USD at: $3,345 – $3,330
🎯 TP: $3,365
❌ SL: $3,315
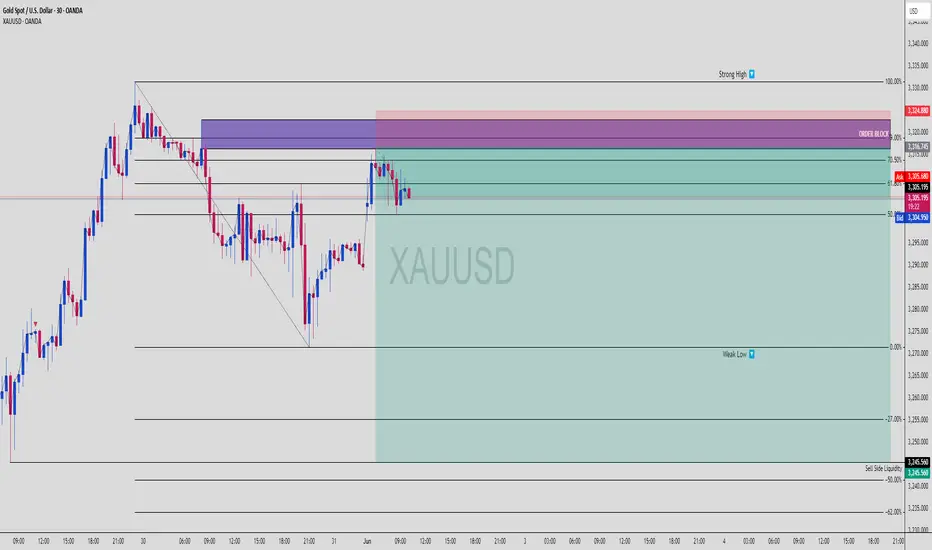
XAUUSD | Premium Zone Hit – Is Gold Ready to Nuke?XAUUSD | 30-Min Bearish Setup – OB Tap + Liquidity Engineering
Let’s break this down ninja-style ⚔️
📌 1. Market Context:
Gold has retraced into a premium pricing zone after a significant sell-off and is now:
Respecting a refined bearish Order Block
Sitting at 61.8–70.5% Fibonacci retracement (textbook premium)
Below a strong high (liquidity magnet)
This is classic smart money engineering:
➡️ Pull back
➡️ Lure in breakout buyers
➡️ Raid the high
➡️ Dump toward liquidity
🧠 2. Key Levels:
📈 Strong High: 3,324.880
🟪 Order Block Zone: ~3,316.745 to 3,324.880
🔻 Current Price: ~3,307.000
🔵 Weak Low: 3,270.000
🩸 Sell Side Liquidity: 3,245.560
We’re watching for a possible rejection from the OB and a drive down into the Sell Side Liquidity zone.
📊 3. Entry Plan (Confirmation-Based):
Wait for a bearish M5–M15 BOS from OB
Look for FVG entry or last mitigation
Target weak low & SSL
Maintain 1:2 to 1:4 RRR depending on entry precision
Ideal RR Target:
🎯 TP: 3,245.560
🛑 SL: Just above 3,324.880
🔁 RR ~ 1:3+
📉 4. SMC Story:
🧩 Price swept internal liquidity and tapped into premium zone
🔍 OB + Fib confluence = high-probability reaction area
🧲 Weak low is unprotected = juicy target for sell-off
🤖 This move could create displacement and fuel next bearish leg
Smart Money is looking to trap late longs before hitting the liquidity pool.
🎯 5. Bonus Tip:
If you’re on M1 or M5, scale into partials as the move confirms via:
Bearish engulfing
BOS + FVG combo
Lower timeframe mitigation plays
Stay reactive, not predictive. Let the market confirm the trap. ⚠️
💬 Drop “Gold Trap Setup 👑” in the comments if you see the same thing
🔁 Save this to track the next move
🎯 Follow @ChartNinjas88 for daily sniper setups!
XAU/USD) Bearish trand analysis Read The ChaptianSMC trading point update
Technical analysis of XAU/USD (Gold Spot) on the 1-hour timeframe, based on Smart Money Concepts (SMC). Here's a breakdown of the idea and trading scenario:
---
Overall Idea: Bearish Continuation
---
Market Context
Current Price: $3,291.99
EMA 200: $3,297.69 (acting as dynamic resistance)
Trend: Price is within a descending channel, respecting both downtrend and uptrend lines
Directional Bias: Bearish unless a breakout occurs
---
Key Zones
1. Resistance Level (Sell Zone)
Around $3,320–$3,340
Price rejected this level multiple times → strong supply zone
2. FVG Level (Fair Value Gap)
Around $3,305–$3,315
Price tapped this area and showed rejection
Identified as a "seller zone" – price likely filled imbalance and now resuming trend
---
Projected Move
Price is expected to:
1. Reject EMA and FVG zone
2. Continue downward movement
3. Target support around $3,244.95
---
Indicators
EMA 200: Above price → bearish pressure
RSI (14): ~46.78 → no extreme reading, but leans bearish; room for further downside
---
Trade Idea Summary
Bias: Bearish
Sell Entry: ~$3,300–$3,310 (already triggered)
Stop Loss: Above $3,320
Target: $3,244.95 (demand zone / previous low)
Risk/Reward: Favorable (~1:2+)
Mr SMC Trading point
---
Warnings
Multiple economic event icons are marked (bottom of chart) → potential high volatility, especially around NFP/FOMC-related news
---
pales support boost 🚀 analysis follow)

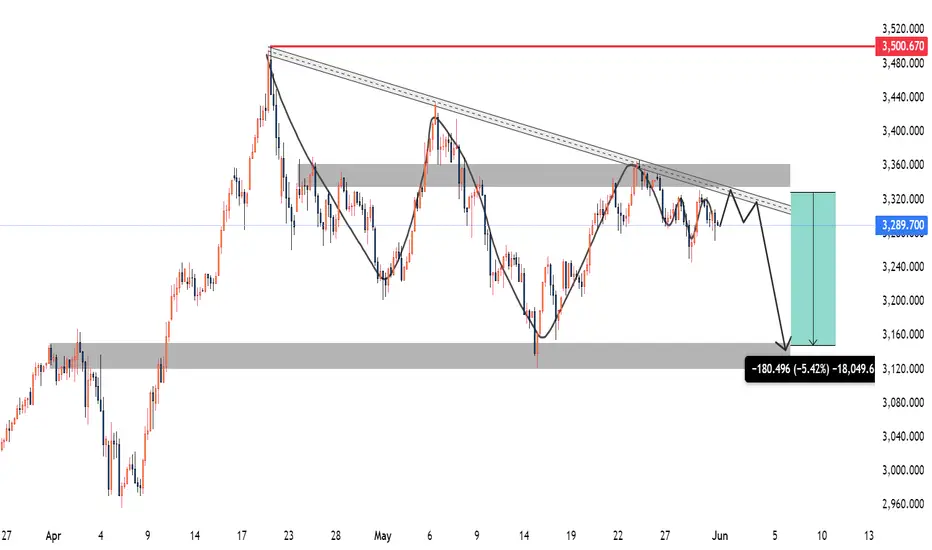
Gold XAUUSD Weekly forecast 2-6 June 2025Observations:
Price has been respecting a clear descending trendline since late April, with multiple touches and rejections.
A significant supply zone around the 3,330 level aligns with the trendline resistance, increasing confluence for a potential reversal.
The market has formed lower highs consistently, suggesting bearish pressure is building up.
A horizontal demand/support level around 3,125 (previous swing low) is the primary target in case of a bearish breakout.
Volume and structure suggest distribution, further supporting bearish continuation.
Bearish Scenario:
If the price retests and rejects the 3,330 resistance level again next week, especially with a wick rejection or bearish engulfing candle:
Expect downside continuation toward 3,125, aligning with a ~1500 pip target.
This move would represent a ~5% drop from current levels.
Trading Plan / Signal:
Sell Setup:
Entry Zone: Between 3,320 – 3,330 (upon bearish confirmation e.g., bearish engulfing or shooting star)
Stop Loss: Above 3,350 (just above trendline and invalidation zone)
Take Profit 1 (TP1): 3,250
Take Profit 2 (TP2): 3,200
Take Profit 3 (TP3): 3,150/25
Risk–Reward Ratio: Approximately 1:3+
Invalidation:
Clean breakout and retest above 3,350 would invalidate the setup and may suggest a reversal toward 3,500.
Fundamental Consideration:
No major geopolitical or macroeconomic shocks should occur to maintain this bearish bias. Any high-impact news could cause volatility, so monitor the economic calendar closely.
Please follow, like, comment and share.
Gold Declines as PCE Inflation Data Cools📊 Market Overview:
Gold is currently trading around $3,289/oz, down from the day's high of $3,322. This decline follows the U.S. PCE inflation data showing a 2.1% annual increase in April, below the forecast of 2.2% and March's 2.3%. Core PCE also rose 0.1% monthly and 2.5% annually, the lowest since early 2021.
📉 Technical Analysis:
• Key Resistance: $3,310 – $3,330
• Nearest Support: $3,270
• EMA: Price is currently below the 09 EMA, indicating a short-term downtrend.
• RSI Indicator: The RSI is declining, signaling increasing selling pressure.
• Candlestick Pattern: A bearish candlestick pattern has formed after failing to break above the $3,330 resistance zone.
📌 Outlook:
If gold fails to hold the $3,270 support level, it may continue to decline towards $3,250. However, maintaining above $3,270 could see a rebound towards the $3,300 – $3,310 range.
💡Suggested Trade Strategy:
SELL XAU/USD at: $3,310 – $3,315
🎯 TP: $3,290
❌ SL: $3,320
BUY XAU/USD at: $3,270
🎯 TP: $3,290
❌ SL: $3,260

Trade Idea:XAUUSD SHORT ( SELL STOP )🔍 Multi-Timeframe Analysis
📉 H4:
• Price is compressing below the 20 and 50 SMAs.
• Recent attempts to break higher failed to sustain; MACD is slightly bearish, hinting momentum is fading.
• Consolidation after the big push suggests potential for another leg down if support breaks.
🕒 M15:
• Strong bounce into resistance, now stalling at the underside of the previous structure (~3315–3320).
• 20 SMA is curling down and converging with the 50 SMA, signaling a potential momentum shift.
🕒 M3:
• Price just lost short-term bullish structure after failing to break 3318.
• Flattening and slight downward curl in the 20 SMA.
• Volume shows a slowdown on the bounce and heavier selling earlier in the day — signs of weakness.
⸻
✅ Trade Idea
Type: Sell Stop
Entry: 3308
Stop Loss: 3322
Take Profit: 3273
———
🧠 Why This Setup Works
• This is a momentum breakdown trade: placing a sell stop just below short-term support (3308) to catch the shift in momentum if price breaks lower.
• Price already rejected the high around 3318; if it pushes below 3308, it confirms that sellers have taken back control.
• There’s clean room down to 3273 — a previous reaction zone and recent demand level — offering a good risk-to-reward.
⸻
🛡️ Risk Management & Execution
• SL to BE Rule: Move stop loss to break-even once price reaches 3293 (15 points in your favor, 1R). That’s the halfway point to target and right above a small reaction zone that could cause a pullback.
• Invalidation Window: If price moves above 3325 before activating entry, cancel the trade idea. That would invalidate the lower-high structure and suggest momentum has shifted bullish again.
⸻
⏱️ Session Timing & Considerations
• NY session opens at 6:30 AM Pacific (PT).
• Ideally, this trade should activate and move by pre-New York to early NY session. If price stalls or consolidates near the entry level for too long into the session (after 9:30–10:00 AM PT), consider canceling or reassessing.
FUSIONMARKETS:XAUUSD

XAUUSD Bearish Signal | Technical + Custom AlgoSmart Trend Signal | Technical Analysis + Custom Algorithm
This signal is the result of a combination of classic technical trend analysis and a proprietary software I personally developed.

XAUUSD Bearish Signal | Technical + Custom AlgoSmart Trend Signal | Technical Analysis + Custom Algorithm
This signal is the result of a combination of classic technical trend analysis and a proprietary software I personally developed.

XAUUSD SHORTThis chart appears to be a technical analysis setup for **Gold (XAU/USD)** on the **15-minute timeframe**, using **Heikin Ashi candles**.
Here's a breakdown of what’s visible:
### **1. Price Action:**
* The chart is trading within a **descending channel** (highlighted by the dotted white trendlines).
* **Resistance levels** are marked at:
* 3366.015
* 3331.470
* **Support zone** around: 3245.560
* The price is currently around **3291.690**, testing the lower region of a recent consolidation zone or distribution area.
### **2. Indicators:**
#### a. **RSI (Middle Panel):**
* RSI is around **41.552**, suggesting mild bearish momentum but not yet oversold.
* RSI is not giving a strong divergence signal at this moment.
#### b. **MACD or Custom Oscillator (Bottom Panel):**
* Appears to be a custom oscillator with histogram + signal cross system.
* Red and green dots possibly indicate buy/sell signals.
* Currently showing **bearish pressure** as histogram and signal lines are below zero with red dots (sell signal confirmation).
### **3. Trade Setup:**
* The red and green box overlay suggests an **active short trade** setup:
* Entry near **3291.690**
* Stop-loss zone near **3331–3335**
* Take-profit zone extending well below **3245**, likely near **3188.498–3189.980**
### **4. Signal Arrows (Blue Up / Red Down):**
* These are likely part of an indicator marking **swing highs/lows or reversal points**.
* More red arrows recently suggest bearish short-term sentiment.
---
### 🧠 **Interpretation:**
* The chart shows a **bearish bias** with a short position in play.
* Price is within a downward channel and rejected the resistance area.
* Oscillators and RSI support further downside unless a strong reversal occurs.

XAU/USD on the 45-minute timeframeSupport Zone Rejection (around 3,250 USD):
Price sharply reversed after testing a key support area (highlighted with a circle).
Volume increased at the reversal point, signaling strong buyer interest.
Break Above Minor Resistance (~3,280 USD):
Price has broken above the immediate resistance level with strong bullish momentum.
A bullish candle has closed above this zone, indicating a potential continuation.
Next Target Resistance Zones:
First Target: Around 3,320 USD, which aligns with a previous structural high and supply zone.
Final Target: Around 3,345–3,350 USD, representing a major resistance zone and previous swing high.
Trade Plan:
Entry: Above 3,280 (already in motion).
Target 1: 3,320
Target 2: 3,345–3,350
Stop Loss: Below 3,260 (below recent low and support zone)
Bullish Structure:
Higher low has been established.
Momentum is supported by volume confirmation

Gold Continues to Decline as USD Strengthens📊 Market Developments:
Gold prices continued to decline on May 29, reaching weekly lows below $3,250/oz. The primary driver is the strong recovery of the US Dollar following a US court's decision on tariffs and cautious FOMC minutes indicating the Fed remains vigilant about inflation, reducing gold's appeal as a safe-haven asset.
📉 Technical Analysis:
• Key Resistance: $3,285 – $3,300
• Nearest Support: $3,240 – $3,230
• EMA: Price is below the 09 EMA, indicating a short-term downtrend.
• Candlestick Patterns / Volume / Momentum: Price has broken below a short-term ascending trendline and is retesting the resistance area, confirming bearish signals.
📌 Outlook:
Gold may continue to decline in the short term if the USD maintains its recovery and the price fails to break above the $3,285 – $3,300 resistance zone.
________________________________________
💡 Suggested Trading Strategy:
SELL XAU/USD at: $3,275 – $3,285
o 🎯 TP: $3,240
o ❌ SL: $3,305
BUY XAU/USD at: $3,230
o 🎯 TP: $3,270
o ❌ SL: $3,215

Gold trading zones: 29-May-2025Good morning! Find today's Gold trading zones and enhance your market analysis.

Gold trading insights: 28-May-2025Gold trading insights for today: Explore our zones for informed decision-making.

Gold May Undergo Short-Term Correction as USD Rebounds📊 Market Overview
Gold (XAU/USD) is trading around $3,309/oz after retreating from the $3,350 region during the Asian session today. Selling pressure emerged as U.S. Treasury yields rose and the USD rebounded slightly, despite expectations of potential Fed rate cuts in the near future.
📉 Technical Analysis
• Key Resistance: $3,350
• Nearest Support: $3,290
• EMA 09: Current price is below the EMA 09, indicating a short-term bearish trend.
• The downtrend is confirmed by bearish candlestick patterns and increasing trading volume in recent sessions.
📌 Outlook
Gold may continue its short-term correction if the USD continues to rebound and U.S. Treasury yields remain elevated. However, long-term support factors such as concerns over U.S. national debt and expectations of Fed rate cuts persist.

Gold trading zones: 27-May-2025Today's Gold trading zones: Identify potential opportunities and plan your strategy.

Gold market analysis: 26-May-2025Good morning! Happy New Day! Here's your daily Gold market analysis. Learn, grow, and trade wisely.

XAUUSD 1H | Bearish Order Block Reaction + Liquidity Sweep🔻 XAUUSD 1-Hour Breakdown — May 14, 2025
Gold gave a strong supply rejection at a marked Order Block zone. This isn’t just a pullback — it’s a potential continuation setup targeting lower lows. Here’s what’s cooking:
🧩 1. Market Structure
Clean rejection from premium OB zone at ~$3,220
Massive bearish impulse candle right after sweeping demand zone liquidity
Price formed a lower low and is now forming a lower high
🛠 2. Key Confluences
🟪 Order Block: Solid rejection with no candle closes above
💧 Liquidity Sweep: Deep wick into OB zone → trapped breakout buyers
🔺 Strong High Protected: Market respects structure, suggesting continuation
🔻 Weak Low Targeted: Clean draw to imbalance & potential sweep zone near $3,116
🧠 3. Trade Setup
Entry: Rejection near $3,207–3,220 OB
SL: Above $3,229 (invalidates structure)
TP: First TP zone near $3,116, extended TP: $3,100
RRR: 1:4 to 1:6 setup depending on partials
⚠️ 4. Risk Management
Watch for NY session reversal attempts
Secure profits at first demand zone reaction
Consider trailing stop above last bearish engulfing candle
📌 Price respects structure. If bulls don’t step in quick, sellers will run the table. This is a classic SMC bearish continuation off OB + liquidity grab — don’t sleep on it!
💬 Type “🔻” if you're riding this short wave with us!
🎯 Follow @ChartNinjas88 for sniper SMC plays every day!

GOLD possible outcomesGold is now approaching 3275 area, which is probably the biggest make or break are right now
If we will see break, we gonna see some retest of previous resistance and we could see retest of ALL TIME HIGH again
If we hold this important 3275 area, we could see one more leg to the lower trendline (Daily TL) and possibly testing higher timeframe support of 3150 area... Possible retest of Daily trendline could lead us to even bigger decline all the way down to 2970 support area

Gold rebound height is limited, short goldTechnical aspects:
Gold has failed to make a major breakthrough in the recent rebound process, and the rebound height has been limited to a smaller and smaller level. Overall, gold is now in a state of shock and short position; as the center of gravity of gold shifts downward, the current short-term resistance is in the 3220-3230 area; and gold has tested downward many times recently, which makes it easier for gold to fall below 3200. Once gold falls below 3200 again, it is very likely to extend to 3190, or even around 3160.
Trading strategy:
Consider starting to short gold in batches in the 3220-3230 area, TP: 3205-3195

XAUUSDHello Traders! 👋
What are your thoughts on GOLD?
After a powerful bullish rally since the beginning of 2025, gold has entered a corrective phase
In the current price zone, we expect a temporary upward retracement, potentially offering short-term relief, before the downtrend resumes.
For a safer bearish entry, it's recommended to wait for a confirmed break below both the marked support zone and the ascending trendline to validate continuation to lower levels.
Don’t forget to like and share your thoughts in the comments! ❤️
