Gold is trapped in the 3260-3370 box shock!
🌐 Driving factors
US President Trump will be in office for 100 days in his second term. On April 27, local time, a new poll jointly conducted by ABC, The Washington Post and Ipsos Group showed that Trump's approval rating for the first 100 days in office was 39%, which was 6 percentage points lower than in February this year, and set the lowest approval rating for the first 100 days in office of all US presidents in the past 80 years.
The results of the Russian-Ukrainian negotiations are not optimistic, and the geopolitical situation is tense.
📊 Commentary analysis
The recent gold fluctuations are really violent and very fast. If you hesitate a little, you will basically miss the market. If you are too anxious, you will easily hit the stop loss. Now the fluctuations in a few hours are higher than the amplitude of the past month. The stop loss of 3-5 US dollars can be easily swept. The market is changing, and the corresponding stop loss should also be enlarged.
🔷 Technical side:
For the current gold, the 1-hour chart card fluctuates widely between 3260-3370, and is currently at 3290 US dollars.
✔Operational suggestions, keep short-term trading:
Bearish strategy:
If the gold price rebounds to the range of 3350-3360 US dollars, you can try to short, with a target of 3290 US dollars and a stop loss of 3365 US dollars.
Bullish strategy:
If the gold price falls to the support of 3260-3270 US dollars, you can go long with a light position, with a target of 3340 US dollars and a stop loss of 3255 US dollars.
💥Risk warning
Liquidity risk: The market may be bearish in early May, and price fluctuations may be amplified.
Policy black swan: Trump may suddenly make tariff policies or personnel changes at the Federal Reserve, causing violent market fluctuations.
Technical false breakthrough: There are a large number of stop-loss orders near 3350 US dollars, and you need to be wary of reversals after inducing more.
Summary:
This week, the gold market will be affected by geopolitics, Federal Reserve policies and the trend of the US dollar. The fluctuation range is expected to be between 3260 and 3370 US dollars. Investors need to pay close attention to key support and resistance levels and adjust their strategies flexibly.
Goldshort

XAUUSD Gold Possible Move 23.04.2025Gold (XAUUSD) Technical Analysis – April 23, 2025
The market is currently showing bearish momentum following a retracement from the recent highs near the 3,500 mark. Price is now approaching key Fibonacci levels, presenting potential shorting opportunities for intraday and swing traders.
Key Levels to Watch:
📉 Short Opportunity 1:
Zone: 3400-3410 USD (Fibonacci 0.5 to 0.618)
Analysis: This is a premium supply zone and a retracement area aligning with the Fibonacci golden pocket. If the price revisits this region and shows bearish confirmation (e.g., bearish engulfing, rejections, or lower timeframe structure break), it's a high-probability short entry zone.
Signal: Look for price rejection patterns in this zone to initiate a short position.
Stop-Loss: 3,430
Target: 3,292 initially, then lower if structure breaks
📉 Short Opportunity 2 (Breakout Trade):
Zone: 3,292 – 3,300 USD (Major Support)
Analysis: This is a major support zone. A clean break below and successful retest from underneath would signal continuation to the downside.
Signal: Wait for a break and retest below 3,292 for confirmation before entering short.
Stop-Loss: Above 3,300 on retest
Target: 3,240 and potentially 3,215 – 3,220 zone
Overall Bias:
Bearish below 3,396. Price action confirms lower highs and lower lows. Structure supports selling rallies or breakdowns.

Gold trading brief: 23-APRIL-2025Your daily Gold trading briefing: Zones, insights, and opportunities.

J.P. Morgan joins the $4K gold clubJ.P. Morgan now forecasts gold to average $3,675 per ounce by year-end and joins Goldman Sachs in projecting a move beyond $4,000 next year.
Spot gold has gained 29% year-to-date, setting 28 record highs and briefly surpassing $3,500 for the first time yesterday.
According to the bank, the main downside risk remains a sudden decline in central bank demand. Key support has potentially shifted higher, with $3,286 now seen as a potential pivot—aligned with both the 50-day moving average and the 61.8% Fibonacci retracement.

Gold Sell and Buy Trading Plan Update!!!Hi Traders, on April 16th I shared this "Gold Sell and Buy Trading Plan"
I expected short term bearish moves towards the Fibonacci support zones and then continuation higher. You can read the full post using the link above.
Price provided a small bearish move and then it continued higher further!!!
If you enjoy this idea, don’t forget to LIKE 👍, FOLLOW ✅, SHARE 🙌, and COMMENT ✍! Drop your thoughts and charts below to keep the discussion going. Your support helps keep this content free and reach more people! 🚀
-------------------------------------------------------------------------------------------------------------------
Disclosure: I am part of Trade Nation's Influencer program and receive a monthly fee for using their TradingView charts in my analysis.

XAUUSD - Liquidity Grab Before Pullback? | Key Zones MarkedGold (XAU/USD) is approaching a critical liquidity zone around the $3,330 level, which aligns with a strong Fibonacci extension area and previous structural highs. Price has shown an impressive recovery after hitting support below $3,000, triggering a bullish rally that reached our TP at $3,270 following a successful SL re-entry.
The price is currently tapping into a liquidity zone, with expectations of short-term rejection signals forming on the 1H time frame.
If we start to see 1H candle rejections or bearish divergence, we can anticipate a possible pullback towards the $3,140-$3,180 zone, which is a confluence of previous resistance turned support and a Fibonacci retracement level.
📌 Patience is key—wait for proper price action confirmation before entering shorts.

XAUUSD ShortStill on strong sell in XAUUSD with this sporadic moves. setting my TP at its original price but believing it will have different levels of correction first. Lets see how this trade roll
Day230f100
L:7
W:5

GOLD !!! IS IT A TIME TO CORRECT ? Predicted Movement On GOLD for next Weeks
According to CCI Divergence
According to Fibo Extension
According to Fibo Retracement
According to Uptrend channel on weekly
According to UP trend Channel On Monthly

Potential Reversal in Gold After Completing Widening Formationhello guys!
The 4H Gold/USD chart exhibits a classic Broadening Formation (also known as a Megaphone Pattern), marked by higher highs and lower lows, reflecting increased volatility and market indecision. This pattern is identified with three key swing points on both the upper and lower trendlines:
Point 1 and Point 2 formed the initial boundaries of the pattern.
Point 3, recently touched, completes the structure by testing the upper boundary of the formation near $3,238, suggesting a potential bull trap, as illustrated in the schematic overlay.
just look at:
The price has sharply rallied to the top of the widening pattern, aligning with the third high, often a strong signal for reversal in this setup.
A rejection from this level is anticipated, supported by the bearish projection arrows targeting multiple demand zones.
Bearish Target Zones:
$3,180 – $3,160: Previous consolidation zone.
$3,140 – $3,120: Mid-pattern volume area with past price sensitivity.
$3,060 – $3,040: Major support zone with a strong volume node and previous reaction area.
Volume Profile Insight:
The volume profile shows significant activity in the $3,040 zone, reinforcing it as a major demand area where buyers might step in again.
__________________________
Summary:
This setup suggests a potential bearish correction after a strong upward move. If price action respects the pattern, traders may look for short opportunities from current levels with the outlined targets. Watch for confirmations such as reversal candlesticks or breakdowns of minor support levels.

Gold Trading Zones: 17-APRIL-2025Gold trading made easier: Explore today's zones and refine your strategy.

The risk-averse frenzy has triggered a massive explosion of gold
📌 Driving Event
The US government's tariffs and rare earths have doubled, highlighting the safe-haven properties of gold.
The Trump administration has recently launched national security investigations into semiconductors, pharmaceuticals and other fields, indicating that the second wave of tariff wars is imminent. Former US Treasury Secretary Yellen bluntly stated that this "self-harming" tariff policy not only fails to achieve the return of manufacturing, but may lead to a break in the global supply chain and push up inflationary pressure. The market's expectations for "stagflation" in the US economy have increased, and gold, as a dual tool for anti-inflation and risk aversion, has significantly increased its appeal.
📊Comment Analysis
At present, gold has basically rushed to the sky. In April, you can basically see the fluctuation range of gold within 70-100 points every day. In this market, you say that fixed points are sometimes really fleeting, and the optimistic resistance is like paper that can be broken at the touch of a button. So is gold really going to the sky? Labaron can only say that under such favorable conditions, it is really hard to see gold fall!
💰Strategy Package
Long position:
Gold is long near 3310, defend near 3290 area, and the target is 3330-37
⭐️ Note: Labaron hopes that traders can properly manage their funds
- Choose the number of lots that matches your funds
- Profit is 4-7% of the fund account
- Stop loss is 1-3% of the fund account

Gold Sell and Buy Trading PlanH4 - We had a strong bullish move with the price creating a series of higher highs, higher lows structure
This strong bullish move ended with a bearish Divergence
While measuring this strong bullish move using the Fibonacci retracement tool we have two key support zones that has formed (marked in green)
So based on this I expect short term bearish moves now towards the Fibonacci support zones and then continuation higher.
If you enjoy this idea, don’t forget to LIKE 👍, FOLLOW ✅, SHARE 🙌, and COMMENT ✍! Drop your thoughts and charts below to keep the discussion going. Your support helps keep this content free and reach more people! 🚀
---------------------------------------------------------------------------------------------------------------------
Disclosure: I am part of Trade Nation's Influencer program and receive a monthly fee for using their TradingView charts in my analysis.


XAUUSD SHORTSolid market moves the past few days, I thought it was going to continue and it was safe because market started to stabilize again. However, as expected, one word from Trump and made the market spiraling again. Because of the hold on tariff announcement, we are now back to 3170 level again. Howver, for me, moves like these are always good opportunity for retracement. Opening at 3170// first TP at my prev opening then final at 3000 so we can still be in profit and croos out the previous one. setting a long SL on this one just to be sure at 3270. Let's see how this rolls
Day210f100
L:6
W:5

Gold trading zones: 16-APRIL-2025Stay ahead with today's Gold trading zones. Enhance your market insights and trade carefully.

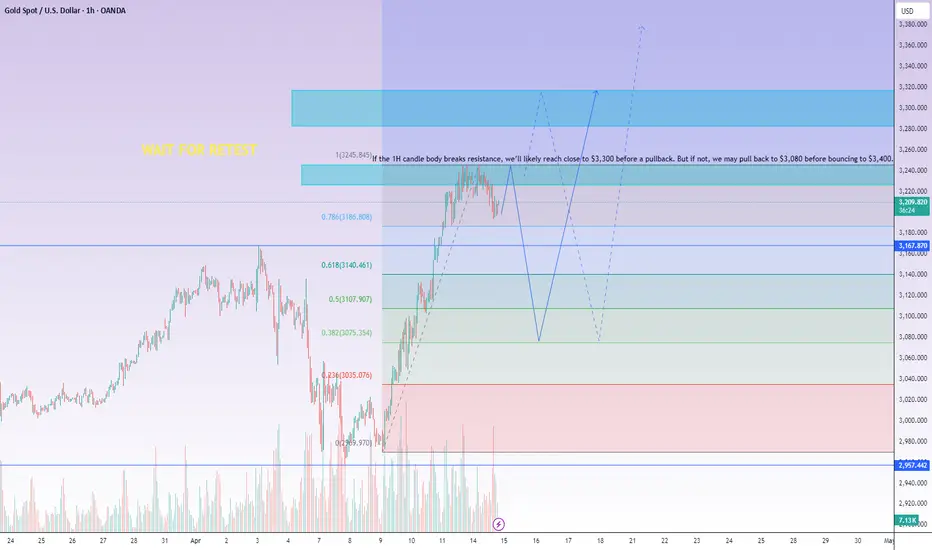
GOLD (XAU/USD) at ATH – Two Key Scenarios to WatchGold has reached ATH, and we're currently testing a critical resistance zone. Look at my previous published post, perfectly played out and we're just getting started.
📈 Scenario 1: If the 1H candle body breaks above resistance with a confirmed close, we’re likely to see a push toward the $3,300 level before a potential pullback toward $3100
📉 Scenario 2: If we fail to break resistance, a pullback toward the $3,100 zone is expected before a bounce back to $3,350.
Wait for a retest confirmation on the 1H candle body closure before taking any position.
Updates will be published!
What Goes Up Must Come Down – Gold on the Edge?After a parabolic run to new highs, gold is flashing signs of exhaustion.
📌 Price is hugging the upper Bollinger Band on the daily chart.
📌 RSI is in overbought territory (currently around 68.2) — similar to previous local tops.
📌 We're forming a steep, almost unsustainable channel — historically, these tend to break hard when they do.
If we see a break below $3,086 and lose that trendline, eyes shift to:
🔻 $2,932 — key support
🔻 $2,787 — prior breakout retest
🔻 $2,532 — long-term trendline support
Still bullish long-term, but short-term? A pullback might be healthy.
🛑 Risk Disclaimer
This is not financial advice. Trade responsibly and use proper risk management.

Gold sell setup Why We Would Sell (Short) XAUUSD in This Setup:
Strong Resistance Zone:
Price is approaching a clear resistance level around 3,250, marked by multiple rejections in the past.
This zone acted as a ceiling for the bulls — each time price reached this level, it got pushed back down, showing strong selling pressure.
Double Top Formation (Potential Reversal Pattern):
The price formed a potential double top near 3,250.
This pattern often signals a shift from bullish to bearish momentum.
Bearish Rejection Wicks:
Candlesticks near the resistance show long upper wicks, indicating that buyers are getting weak and sellers are stepping in.
Lower High Forming:
After the second peak, price failed to make a new high, suggesting buying momentum is weakening.
The current price action is forming a lower high, which is a bearish signal.
Bearish Price Projection (Arrow Path):
The blue arrow suggests a retest of the resistance zone followed by a strong drop down to the support zone at 3,187.
This offers a good risk-to-reward ratio for a short trade setup.
Trade Parameters:
Stop Loss above resistance (around 3,250).
Take Profit around 3,187 (previous support).
This setup offers a clear invalidation point if the price breaks above resistance.

GS raises gold target to $4,000, UBS to $3,500 Goldman Sachs and UBS have issued another round of bullish forecasts for gold, citing ongoing market uncertainty (i.e., tariffs).
Goldman analysts now expect gold to reach $3,700 per ounce by the end of 2025, with a potential rise to $4,000 by mid-2026. UBS holds a slightly more conservative view, projecting $3,500 by December 2025.
Technically, gold has pulled back from new all-time highs seen during the Asian session but potentially remains in a strong uptrend. With prices trading well above both the 50-day EMA and 200-day EMA, shallow retracements may find support, especially as tariff-related risks persist for at least the next 90 days.

Gold market analysis: 14-APRIL-2025Happy New week, check out our Gold market analysis: Today's zones for strategic decision-making.

Golds about to CRASH next and here's why....Gold has been in a sustained uptrend for some time, but it appears we may now be approaching a significant resistance level. I believe the market is either set for a correction or will enter a broad consolidation range, and we are currently trading near the upper boundary of that range.

Gold continues to declineThere will be a decline. A rebound from the trendline and will not go above 3050 - be careful!

Gold trading zones: 11-APRIL-2025Daily Gold trading zones: Identifying potential opportunities for informed traders.
