DeGRAM | GOLD will retest the channel boundary📊 Technical Analysis
● Fresh rejection at the blue resistance line (~3 435) pushed XAU back to the 3 355 mid-band, yet successive higher-lows (green arrows) keep price inside the May-origin rising channel.
● The pullback is probing 3 328-3 355 — confluence of the former flag roof and triangle top; holding this zone should launch another test of 3 400/3 435, with the channel crest targeting 3 500.
💡 Fundamental Analysis
● U-S S&P-Global PMIs softened, nudging 2-yr real yields to three-week lows, while cautious ECB rhetoric limits dollar gains — both supportive for gold.
✨ Summary
Long 3 328-3 355; above that aims 3 400 ➜ 3 435, stretch 3 500. Invalidate on an H4 close below 3 293.
-------------------
Share your opinion in the comments and support the idea with a like. Thanks for your support!
Goldsignal

Gold Recovery Setup = Divergence + Support ClusterGold ( OANDA:XAUUSD ) fell to the lower line of the ascending channel and the Support zone($3,350-$3,326) , as I expected in my previous idea .
Gold is currently near a set of Supports .
Supports:
Support zone: $3,350-$3,326
Monthly Pivot Point: $3,333
Potential Reversal Zone(PRZ): $3,339-$3,329
Lower line of the ascending Channel
50_EMA(Daily)
Support lines
In terms of Elliott Wave theory , Gold appears to be completing a bearish wave 5 .
Also, we can see the Regular Divergence(RD+) between Consecutive Valleys .
I expect Gold to rise to at least $3,359 .
Second target: $3,367
Note: Stop Loss (SL) = $3,319
Do you think Gold can break the Support cluster by the end of trading hours?
Gold Analyze (XAUUSD), 1-hour time frame.
Be sure to follow the updated ideas.
Do not forget to put a Stop loss for your positions (For every position you want to open).
Please follow your strategy; this is just my idea, and I will gladly see your ideas in this post.
Please do not forget the ✅ ' like ' ✅ button 🙏😊 & Share it with your friends; thanks, and Trade safe.

Gold Fails at Resistance, Elliott Wave Signals Deeper CorrectionGold ( OANDA:XAUUSD ) started to rise after the Richmond Manufacturing Index(Actual:-20/Forecast:-2/Previous-7) index was announced, but failed to break the upper line of the ascending channel and the Resistance zone($3,451-$3,406) .
Gold has now broken through the Support lines and is attempting to break through the next Support lines and Support zone($3,394-$3,366) .
In terms of Elliott Wave theory , it appears that the main wave Y has completed above the ascending channel.
I expect that given the momentum of gold's decline , gold will be able to break the Support zone($3,394-$3,366) and Support lines and fall to at least $3,356 . The next target could be the lower line of the ascending channel .
Note: Stop Loss (SL) = $3,423
Gold Analyze (XAUUSD), 1-hour time frame.
Be sure to follow the updated ideas.
Do not forget to put a Stop loss for your positions (For every position you want to open).
Please follow your strategy; this is just my idea, and I will gladly see your ideas in this post.
Please do not forget the ✅ ' like ' ✅ button 🙏😊 & Share it with your friends; thanks, and Trade safe.

DeGRAM | GOLD above the resistance📊 Technical Analysis
● Five successive rebounds (green arrows) from the 4-month rising‐channel base at 3 293 keep the primary up-trend intact while turning the former wedge roof into support.
● Price is compressing inside a 4-day ascending triangle whose ceiling sits at 3 366; a break projects 1 : 1 to the March top/outer channel rail at 3 435.
💡 Fundamental Analysis
● FXStreet notes bullion ETF holdings rose for a second week as softer US PMI prices dragged 2-yr real yields back to early-July lows, trimming the dollar bid.
✨ Summary
Buy 3 345-3 355; triangle breakout >3 366 opens 3 389 then 3 435. Long bias void on an H4 close below 3 293.
-------------------
Share your opinion in the comments and support the idea with a like. Thanks for your support!

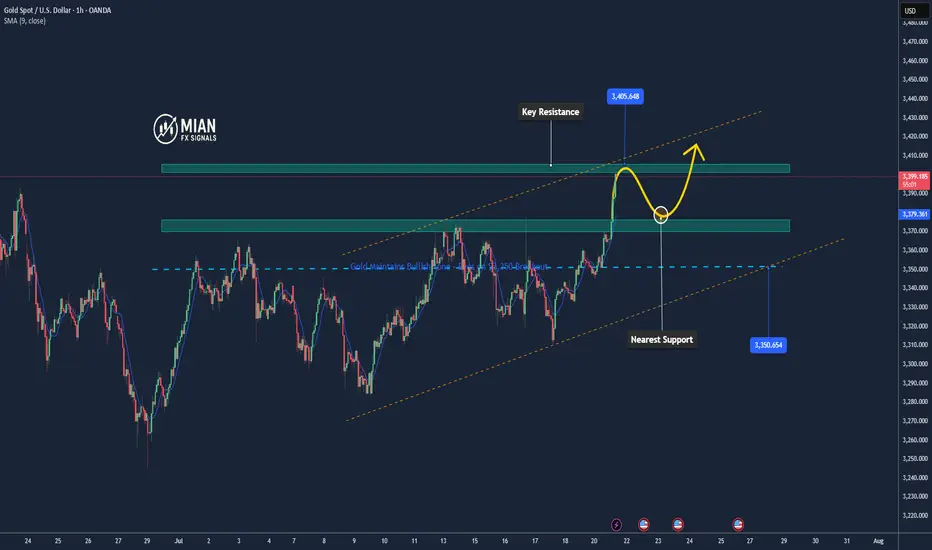
Gold Could Extend Rally if Breaks 3,400📊 Market Overview
Gold is currently trading around 3,400 USD/oz, up approximately +1.41% over the past 24 hours.
The upward momentum is supported by a weakening US Dollar following dovish-leaning remarks from the Fed, along with growing demand for safe-haven assets amid trade uncertainties.
📉 Technical Analysis
• Key Resistance: ~3,400–3,405 USD (psychological zone; a break above could open the path for further gains).
• Nearest Support: ~3,370–3,375 USD, followed by 3,345–3,350 USD, which marks today’s low.
• EMA 09/20: Price is currently trading above both EMA 9 and EMA 20, confirming a short-term uptrend.
• Momentum / Oscillators: RSI is in the overbought zone; MACD and ADX still show a “buy” signal → bullish trend continues, but watch for possible technical pullbacks.
📌 Opinion
The price may continue to rise if it breaks above the 3,400 USD/oz level, especially if the USD remains weak and safe-haven flows continue to support gold. However, if there’s short-term selling pressure or a USD rebound, gold may pull back toward the 3,370–3,375 USD support zone.
💡 Trade Setup
SELL XAU/USD at: 3,400–3,405 USD
🎯 TP: 3,380 USD
❌ SL: 3,410 USD
BUY XAU/USD at: 3,370–3,375 USD
🎯 TP: 3,390–3,395 USD
❌ SL: 3,360 USD
Gold bulls slowly climb higherJudging from the market trend last Friday, the trend channel has been broken, and the pullback to accumulate strength is an effective confirmation of the trend channel. At the same time, the large-cycle trend support is obvious, coupled with the break of the short-term structure, the current situation basically presents an overall bullish pattern, especially the key point of 3345, which is not only the neckline position of the large-cycle irregular W-bottom pattern, but also has obvious structural support. Therefore, every pullback is the best time to deploy longs. From the perspective of the European session, it is expected to rise again. The overall market trend is in line with the technical logic, and the trading opportunities are clear. Gold is still in a large shock range. The idea of the main long in intraday operations remains unchanged. Focus on the support of 3345-3330 and choose to go long when the opportunity arises. In the short term, pay attention to the reaction of the 3366-3377 resistance area. The current market direction is very clear. There is no need to hesitate too much. Go with the trend and wait for the key position to pull back to participate.
Gold strategy reference: Buy gold in batches when it falls back to 3345-3330, with the target at 3365-3375. If the price touches the 3370-3377 pressure zone without breaking, you can try shorting.

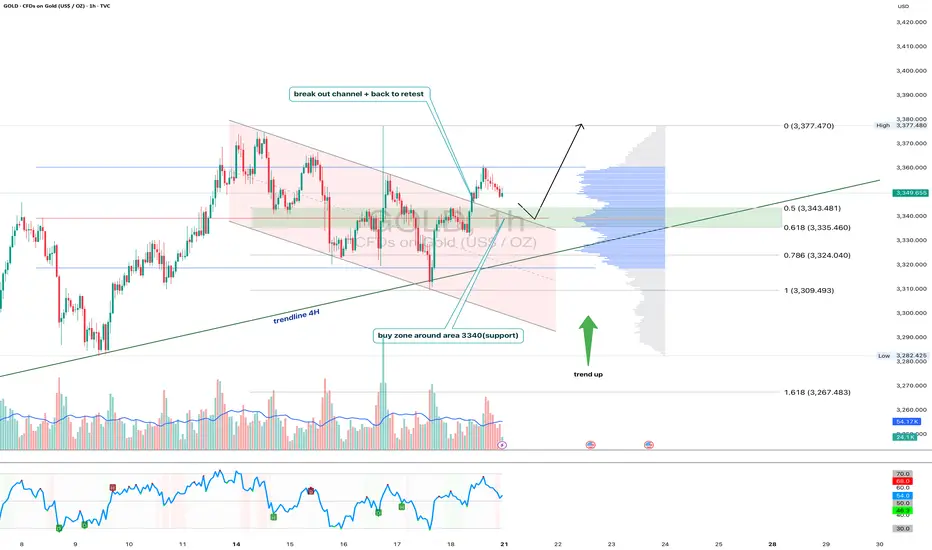
Gold 1H - Retest of channel & support zone at 3340After breaking out of the falling channel, gold is currently retesting its upper boundary — now acting as support. The 3340 zone is particularly important as it aligns with the 0.618 Fibonacci level and high volume node on the visible range volume profile. The price action suggests a potential bullish rejection from this area. With both the 50 and 200 EMA below price on the 1H, the short-term trend remains bullish. The 4H trendline further supports this setup. RSI is cooling off near the neutral zone, leaving room for another leg higher toward the 3377 resistance zone. If 3340 fails, 3324 (0.786 Fibo) becomes the next line of defense. Until then, the structure remains bullish following the successful breakout and retest of the channel.
DeGRAM | GOLD above the resistance level📊 Technical Analysis
● Bulls defended the channel base at 3 333, snapping the intraday falling wedge and reclaiming the broken trend-line; successive higher-lows since 17 Jul signal fresh upside momentum.
● A clean H1 close over the former pivot 3 355 flips the wedge crest into support and activates the measured-move target at the upper horizontal barrier 3 366, with the March swing cap 3 389 next.
💡 Fundamental Analysis
● Softer US jobless-claims trend and Fed speakers’ hints that “policy is restrictive enough” cooled two-year real yields, while PBoC’s June data showed net gold purchases for a fourth month—both underpinning spot demand.
✨ Summary
Long 3 345-3 355; hold above 3 355 targets 3 366 → 3 389. Bias void on an H1 close beneath 3 333.
-------------------
Share your opinion in the comments and support the idea with a like. Thanks for your support!

Double Top + Zigzag Complete: Are Bears About to Take Over Gold?Yesterday, the financial markets in general, including Gold ( OANDA:XAUUSD ) , acted like a roller coaster after the news of Powell's dismissal . After this news was denied , Gold returned to its main trend, which I published in my previous idea .
Gold is currently re-attacking the Support line , Support zone($3,326-$3,325) and 50_SMA(Daily) .
In terms of classic technical analysis , it seems that gold has formed a Double Top Pattern for support breakdowns, where a Support line breakdown can also be accompanied by a neckline breakdown .
From the perspective of Elliott Wave theory , it seems that Gold has managed to complete the Zigzag Correction(ABC/5-3-5) , and we should wait for the next bearish waves .
I expect Gold to break its supports and move towards $3,290 ; support breaks are best done with high momentum . An important price that can change the direction of Gold's downside is $3,350 .
Note: If Gold breaks the Resistance lines and forms an hourly candle above $3,351(Stop Loss (SL)), we can expect further Gold gains.
Gold Analyze (XAUUSD), 2-hour time frame.
Be sure to follow the updated ideas.
Do not forget to put a Stop loss for your positions (For every position you want to open).
Please follow your strategy; this is just my idea, and I will gladly see your ideas in this post.
Please do not forget the ✅ ' like ' ✅ button 🙏😊 & Share it with your friends; thanks, and Trade safe.

DeGRAM | GOLD correction from the resistance line📊 Technical Analysis
● Repeated rejections at the channel mid-band (3 346) and the higher swing-highs marked by red arrows form a descending wedge inside the bigger rising channel.
● Price has slipped back under the intraday up-trend and is tracking a fresh 30 m falling channel; a close below 3 328 completes the bear setup and points to the lower channel rail / former bounce base at 3 296.
💡 Fundamental Analysis
● US retail-sales surprise (+0.5 % m/m) lifted 2-yr Treasury yields while Fed’s Daly warned “inflation progress isn’t enough”, reviving dollar demand and capping bullion.
✨ Summary
Short 3 340-3 345; sustained trade beneath 3 328 opens 3 296 → 3 255. Thesis void on a 30 m close above 3 355.
-------------------
Share your opinion in the comments and support the idea with a like. Thanks for your support!

Today’s main strategy: bulls take the lead, followed by bears!Yesterday, gold maintained a range of fluctuations. The game between bulls and bears was fierce but failed to break the current structure. The overall trend is not clear for the time being. From a fundamental perspective, risk aversion still dominates market expectations, which makes the gold trend lack a directional breakthrough. However, we need to be vigilant that the main funds may force the gold price to fall through extreme suppression in the future. From the 4-hour cycle, gold has been under pressure near the upper track of 3377 and has fallen continuously. It has fallen below the middle track support and touched the lower track. The current price is temporarily supported near the lower track, but the overall situation is still in a wide range of fluctuations. The trend has not yet formed. The short-term strength of the US dollar also suppresses the gold rebound. The current bulls and bears are anxious, and the key support and resistance have not been effectively broken. Currently, pay attention to the effectiveness of the support in the 3325-3320 area. If it pulls back to this area, you can consider a short-term long layout, and the target is the 3340-3350 range above. If it rebounds to this area, you can choose to stop profit and go short at the right time, and the target is the lower track area. If the downward momentum is strong, it may fall below yesterday's low to form a continuous decline.

Gold Roadmap: Next Stop $3,325 After Ascending Channel Break?Gold ( OANDA:XAUUSD ) failed to touch the Potential Reversal Zone(PRZ) in the previous idea , and I took the position at $3,351 = Risk-free.
Gold is moving in the Resistance zone($3,366-$3,394) and has managed to break the lower line of the ascending channel .
In terms of Elliott Wave theory , with the break of the lower line of the ascending channel, it seems that gold has completed the Zigzag correction(ABC/5-3-5) .
I expect Gold to trend downward in the coming hours and succeed in breaking the Support zone($3,350-$3,325) and attacking the Support line again , and probably succeeding in breaking this line this time.
Note: Stop Loss (SL) = $3,396
Gold Analyze (XAUUSD), 1-hour time frame.
Be sure to follow the updated ideas.
Do not forget to put a Stop loss for your positions (For every position you want to open).
Please follow your strategy; this is just my idea, and I will gladly see your ideas in this post.
Please do not forget the ✅ ' like ' ✅ button 🙏😊 & Share it with your friends; thanks, and Trade safe.

The battle for gold 3375-40 has begun, and CPI is coming!The current market has entered a short-term shock consolidation phase. Taking advantage of the temporary calm of the market, I would like to share my judgment and strategy with my brothers. I still tend to be bullish in the medium term. Yesterday's trend just verified my point of view. If the bulls want to break through the 3375 line, they must first complete the "deep squat wash", and this wave of retracement has also brought good profits to both our long and short traders. Friends who follow should have gained.
But the core of today is the CPI inflation data. As a heavy macro event, the recent forward-looking data (such as employment and labor market) is likely to be bearish for gold. The market has formed a consistent expectation. In this case, I have to temporarily put aside the long thinking and turn to short. My point of view is that as a qualified trader, I have always attached great importance to the data market. Whether it is non-agricultural, CPI or interest rate resolution, I have never easily made mistakes in grasping this kind of structural drive. Since the market has locked the focus of long and short positions in the core range of 3375-3340, we must face up to this structural competition. If the judgment is wrong this time, I will re-evaluate whether I should continue to participate deeply in this obvious data expectation transaction, but for now, I must respect the game logic of the market.
Operation strategy reference:
Currently, the 3360-3366 area can be lightly shorted. If it touches the 3370 line before the CPI is released, it can be appropriately covered; the stop loss is clearly set above 3375. Once it breaks through, leave the market decisively without hesitation. The lower target is 3350-3340 first. If it breaks, continue to look down to the 3330 area.

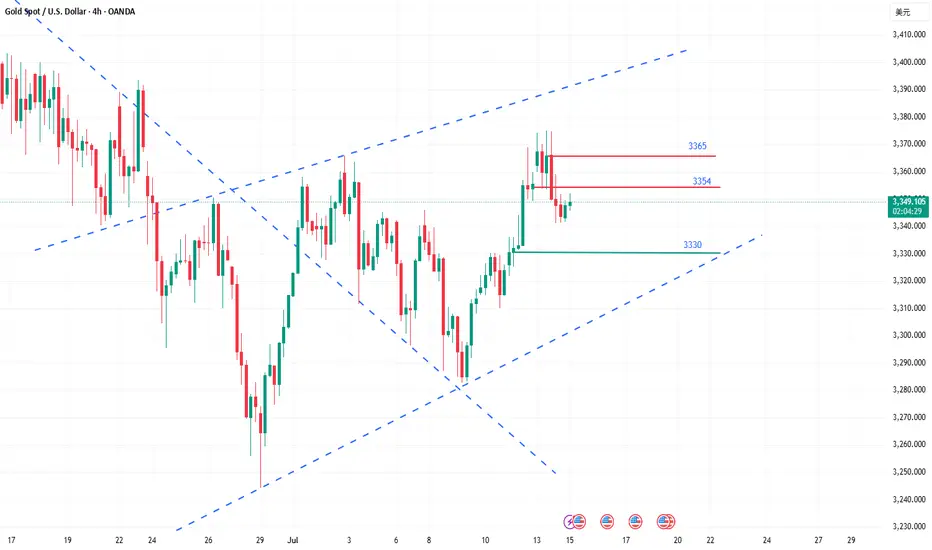
How to grasp the key trading points of gold?Yesterday, gold tested the 3375 line several times but failed to break through effectively. The selling pressure on the market was obvious, and the price immediately fell back, reaching a low of around 3341. The daily line closed with a long upper shadow, indicating that the bullish momentum has weakened and the short-term market has entered an adjustment phase. From the perspective of the 4-hour cycle, the continuous negative trend has led to the gradual closing of the Bollinger Bands, and the middle track position has temporarily gained support, but the overall market is volatile and weak. Today, we will focus on the 3354 watershed. If the rebound fails to effectively stand at this position, the pressure on the upper side will still be strong, and there is a risk of a short-term decline.
Key technical positions: upper resistance: 3365, 3354, lower support: 3340, 3330. In terms of operation rhythm, it is recommended to deal with it with a high-selling and low-buying, oscillating approach, and maintain flexible adjustments.
The operation suggestions are as follows: You can choose to short in the 3360-3365 area, with the target around 3350 and 3340; if the rebound is blocked below 3354, you can also enter the short order in advance. It is recommended to enter and exit quickly in the short-term weak market; strictly control the stop loss to avoid risks caused by sudden changes in the market.
The current market is obviously volatile, so don't blindly chase the rise and fall. It is particularly important to operate around the key pressure and support areas. The grasp of the rhythm will determine the final profit, and steady trading is the kingly way.
DeGRAM | GOLD broke the trend line📊 Technical Analysis
● The break of the July descending cap at 3 355 has held as support; price is stair-stepping along a steep intraday channel whose lower rail coincides with the 3 350 pivot.
● Momentum is pressing the 3 368–3 393 supply; clearing that band opens the March swing objective at 3 430, while pullbacks into 3 350-3 355 are buffered by the former trend-line.
💡 Fundamental Analysis
● A second straight downside surprise in US PPI cooled 2-yr yields and the DXY, restoring carry appeal for non-yielding gold.
● World Gold Council notes June central-bank net purchases rose 6 % m/m, signalling persistent official demand.
✨ Summary
Long 3 350-3 360; hold above 3 355 targets 3 393 → 3 430. Bias void on an H1 close below 3 325.
-------------------
Share your opinion in the comments and support the idea with a like. Thanks for your support!

XAUUSD Bullish Signal | Technical + Custom AlgoSmart Trend Signal | Technical Analysis + Custom Algorithm
This signal is the result of a combination of classic technical trend analysis and a proprietary software I personally developed.

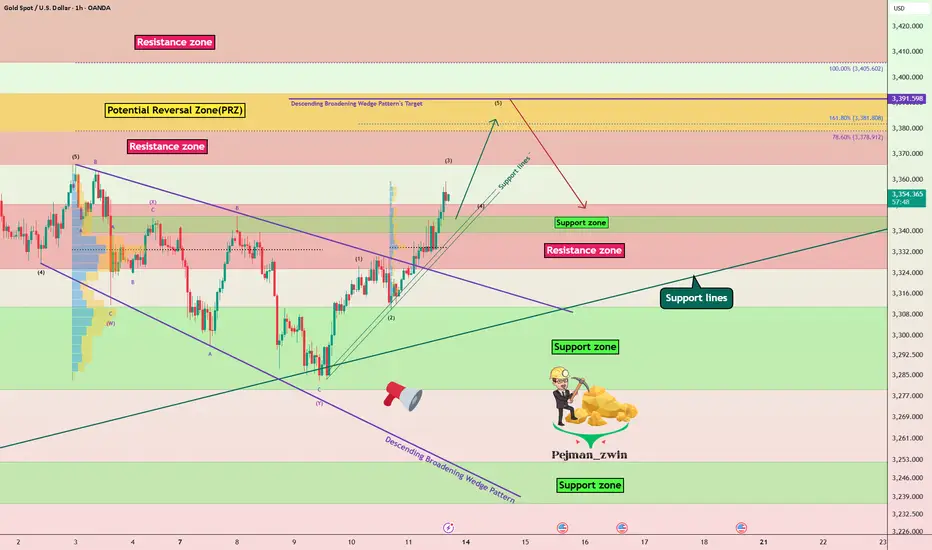
Gold Roadmap=>Short termGold ( OANDA:XAUUSD ) currently appears to have broken through the Resistance zone($3,350-$3,325) .
The Resistance zone($3,350-$3,325) was broken with the help of the Descending Broadening Wedge Pattern , the upper line of this classic pattern having served as an important resistance line for us in previous ideas .
In terms of Elliott wave theory , Gold has completed the Double Three Correction(WXY) within the Descending Broadening Wedge Pattern . It is currently completing the next five impulse waves . Wave 5 of these waves could end in the Potential Reversal Zone(PRZ) .
I expect Gold to rise to the Potential Reversal Zone(PRZ) , and of course, given the momentum of gold approaching PRZ , we can also look for Short positions in PRZ .
Note: Stop Loss (SL) = $3,329
Gold Analyze (XAUUSD), 1-hour time frame.
Be sure to follow the updated ideas.
Do not forget to put a Stop loss for your positions (For every position you want to open).
Please follow your strategy; this is just my idea, and I will gladly see your ideas in this post.
Please do not forget the ✅ ' like ' ✅ button 🙏😊 & Share it with your friends; thanks, and Trade safe.
XAUUSD Analysis todayHello traders, this is a complete multiple timeframe analysis of this pair. We see could find significant trading opportunities as per analysis upon price action confirmation we may take this trade. Smash the like button if you find value in this analysis and drop a comment if you have any questions or let me know which pair to cover in my next analysis.

Try shorting once below 3355!The market closed at 3326 on Thursday and still failed to break through the small range of long and short positions. The overall market is in a strong bullish trend and this trend indicates the possibility of a breakout in the future. In this week's trading example, after confirming that the 3315 low support is effective, a short-term long operation was successfully carried out below the area and profited. The picture and truth can be checked in the article on Thursday. In the short term, continue to pay attention to the range shock and pay close attention to the breakthrough direction of key points. The first thing to pay attention to is the strong pressure of 3355. If it breaks through and stands firmly at this position, it will open up further upward space, and the potential target can be seen in the 3365 or even 3400 area. On the contrary, if the gold price is always under pressure below 3355, the market is likely to continue the current shock and consolidation rhythm. Therefore, breaking through the 3355 mark will be a key signal to judge whether the market can release significant upward momentum in the future. Before the effective breakthrough, continue to intervene in the low-long opportunity at the 3325-15 support level of the shock range. On the upper side, you can arrange short positions at 3345-3455.

How to seize gold trading opportunitiesNews:
On Friday (July 11) in the Asian time zone, US President Trump posted a "tariff change" on social media, announcing that a 35% tariff would be imposed on all Canadian goods from August 1, a 10 percentage point increase from the current rate. This decision was like a thunderbolt, instantly igniting the market's risk aversion sentiment, and the spot gold price soared, reaching a high of $3,344 per ounce during the session. Although Trump extended the tariff agreement to August 1, which once suppressed the gold price, he subsequently stated that it would not be extended after the expiration, and launched further tariff attacks after the expiration, announcing a new 50% tariff on copper imports from the United States and a 50% tariff on goods from Brazil, which increased concerns about tariff risks and pushed the gold price to rebound from the bottom;
Gold trend analysis:
The market is fluctuating repeatedly now, and it is possible to rise or fall, but under the bullish trend, the main force is still rising. Therefore, this week's trading is to fall back and do more at a low price. Whether it is the previous 3285, 3304, or 3317, there are good profits. Although it is temporarily unable to break out of the bullish volume, at least the trend remains unchanged, and there will definitely be a large upward space in the future. Today is Friday, and we still pay attention to the possibility of bullish volume. This Monday has been emphasizing that if it rises during the week, it will look at the 3345 high point. If 3345 breaks, there are still 3365 and 3400 above. Friday will see whether this idea is realized.
From a technical point of view, all cycles are obviously bullish now. The daily line bottomed out on Tuesday, and Wednesday and Thursday were all small broken Yang rising. If it continues, we will first see whether the daily Bollinger middle rail 3345 pressure is broken. After the break, the big Yang closes high. This wave of rise may reach 3400. Therefore, the daily cycle has a lot of room for growth and should not be taken lightly. The H4 cycle needs to see whether today's rise can break 3345, because if it breaks 3345, there is a possibility of the upper rail opening. After the upper rail opens, gold will have a unilateral trend. Therefore, today's bullish target is 3345. If 3345 is not broken, there is still a possibility of a decline. If 3345 breaks, there will be 3365 and 3400 above. Here, it is clearly bullish and optimistic about the break of 3345. After determining the direction, the trading idea on Friday is also clear. It must be mainly long on the decline. The support below is 3320-3310. Don't chase more in the European session. Trade again if there is a decline.
Gold operation strategy: It is recommended to go long if it falls back to around 3315-3325, with the target at 3335-3345; it is recommended to consider shorting if it touches 3345 but does not break, with the target at 3335-3325.

DeGRAM | GOLD held the trend line📊 Technical Analysis
● Bulls defended the channel‐base 3 280 zone, breaking the six-week falling wedge and reclaiming 3 312; structure flips to higher-highs within the rising channel.
● A close above the wedge lip at 3 355 should unlock the grey range ceiling where the May trend-cap and 3 430 – 3 450 intersect. Pull-backs into 3 300-3 312 are expected to attract bids while the wedge retest holds.
💡 Fundamental Analysis
● US headline-CPI cooled for a second month, knocking 2-yr real yields to one-month lows and trimming Fed-cut timing, while PBoC data show June net gold purchases resuming—both reviving spot demand.
✨ Summary
Long 3 300-3 320; breakout >3 355 eyes 3 430 → 3 450. Invalidate on an H4 close below 3 280.
-------------------
Share your opinion in the comments and support the idea with a like. Thanks for your support!

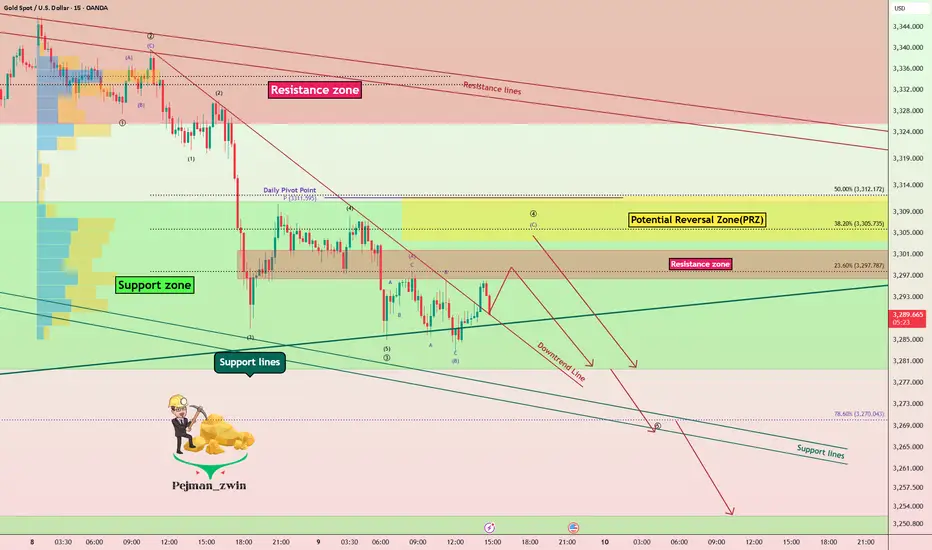
Support Under Siege – Is Gold Ready for Another Leg Down?As I expected in the previous idea , Gold ( OANDA:XAUUSD ) rose to $3,343 on the 1-hour time frame , but failed to break the Resistance zone($3,350-$3,326) and started to fall with relatively good momentum .
Do you think Gold can finally break the Support zone($3,312-$3,280) and Support lines , or will it rise again?
Gold is currently trading in the Support zone($3,312-$3,280) and near the Support line s. It has also managed to break the downtrend line .
In terms of Elliott Wave theory on the 15-minute time frame , Gold appears to be completing a main wave 4 . The main wave 4 appears to follow Double Three Correction(WXY) . Also, the main wave 3 is extended due to the high downward momentum.
I expect Gold to start falling again by entering the Potential Reversal Zone(PRZ) or Resistance zone($3,302-$3,296) and eventually breaking the Support zone($3,312-$3,280) and Support lines, Gold's falling targets are clear on the chart.
Note: Stop Loss (SL) = $3,313
Gold Analyze (XAUUSD), 15-minute time frame.
Be sure to follow the updated ideas.
Do not forget to put a Stop loss for your positions (For every position you want to open).
Please follow your strategy; this is just my idea, and I will gladly see your ideas in this post.
Please do not forget the ✅ ' like ' ✅ button 🙏😊 & Share it with your friends; thanks, and Trade safe.
DeGRAM | GOLD forming head and shoulders📊 Technical Analysis
● A double rejection at 3 358—confluence of the May-July descending trend-line and the long-term channel roof—has carved successive lower highs; the break of the inner up-trend (circled) shifts structure bearish.
● Price is now slipping out of a contracting pennant; sustained trade beneath 3 246 (pattern base / April pivot) exposes the mid-channel magnet at 3 202, with the outer rail projecting 3 121.
💡 Fundamental Analysis
● Surprise rise in NY Fed 1-yr inflation expectations and Daly’s “no urgency to cut” remarks lifted 2-yr real yields and the DXY, while ETFs saw a fifth straight day of outflows, signalling fading bullion demand.
✨ Summary
Sell 3 300–3 320; break below 3 246 targets 3 202 → 3 121. Short view void on a 4 h close above 3 358.
-------------------
Share your opinion in the comments and support the idea with a like. Thanks for your support!
