GOLD (XAUUSD): More Growth is Coming?!
Today's Powell Speech has a very limited impact on Gold.
Since early morning, the market turned bullish and
successfully violated a resistance line of a horizontal range on a 4H time frame.
The market may keep growing now.
Next resistance - 2390
❤️Please, support my work with like, thank you!❤️
Goldsignal

I think it might be safe to sell soon (temporarily, at least)
If we look to the left, gold would have completely reversed the move it created last week Friday for NFP. Thus gold has now gone somewhat bearish which means sellers are interested.
If you look at the area circled (in purple) there would have been sellers interested at that level.
Gold literally just took out that area.
Any sellers who had sold around the circled area would have likely had stops above that level and now would be no more.
HOWEVER,
The reason I said it may be safe to sell (SOON) is because of this, the fact that price is coming back up again, if it were safe to sell, it wouldn't be coming back up to give traders a better opportunity to sell.
Due to this I'd be extra careful of selling OR buying at this time.

GOLD (XAUUSD): Accumulation is Over!
Gold was consolidating within a range on a daily since the end of May.
The release of the Friday's fundamentals made the market very bullish
and the price successfully violated the upper boundary of the range.
Such a violation opens a potential for a further bullish continuation.
Next resistance - 2425
❤️Please, support my work with like, thank you!❤️

Gold Analysis==>Falling ScenarioGold is moving in the Resistance zone($2,373-$2,354) and Ascending channel .
According to the theory of Elliott waves , it seems that Gold has succeeded in completing the Zigzag correction(ABC/5-3-5) .
I expect Gold to attack the Support zone($2,338-$2,318) in the coming hours after breaking the lower line of the ascending channel .
Note: If Gold can break the Resistance zone($2,373-$2,354), scenario will be changed.
Gold Analyze ( XAUUSD ), 1-hour time frame ⏰.
Do not forget to put Stop loss for your positions (For every position you want to open).
Please follow your strategy; this is just my idea, and I will gladly see your ideas in this post.
Please do not forget the ✅' like '✅ button 🙏😊 & Share it with your friends; thanks, and Trade safe.

DeGRAM | GOLD rebound from the support levelGOLD is moving in a descending channel between the trend lines.
The chart bounced off the support level, which coincides with the 50% retracement level and which has already acted as a reversal point twice.
We expect the bounce to continue.
-------------------
Share your opinion in the comments and support the idea with like. Thanks for your support!
Gold is Ready to Fall Again!!!After failing to break the Descending Channel , Gold started to fall again and managed to break the Support zone($2,338-$2,318) and Support line .
According to Elliott's wave theory , Gold seems to be on its way to completing five more bearish waves .
I expect Gold to fall at least to the next Support zone($2,288-$2,250) .
Gold Analyze ( XAUUSD ), 4-hour time frame ⏰.
Do not forget to put Stop loss for your positions (For every position you want to open).
Please follow your strategy; this is just my idea, and I will gladly see your ideas in this post.
Please do not forget the ✅' like '✅ button 🙏😊 & Share it with your friends; thanks, and Trade safe.

DeGRAM | GOLD continued declineGOLD is moving near the lower boundary of the ascending channel.
The price is under the trend line.
The descending structure is kept.
XAUUSD is under the supply zone.
We expect a decline after breaking the lower boundary of the channel.
-------------------
Share your opinion in the comments and support the idea with like. Thanks for your support!

Gold thought for 27-06-2024price is currently at support on the daily, this gives me strong reasons to look for buys at bullish confirmation and sells if the support breaks and candle closes below.

GOLD possible short for 231520th & 21st daily bars make top reversal (two bar reversal). 21st daily bar broker both side of previous daily bar but closed off the low. supply zone for short 2363.50-68.50, stop loss: 2371, target: 2315

DeGRAM | GOLD breaking the downward structureGOLD is moving in an ascending channel, above the trend line.
The price broke through the resistance level, which coincides with the 50% retracement level.
The chart has broken the descending structure.
We expect growth after consolidation above the current level.
-------------------
Share your opinion in the comments and support the idea with like. Thanks for your support!

XAUUSD Top-down analysis Hello traders, this is a complete multiple timeframe analysis of this pair. We see could find significant trading opportunities as per analysis upon price action confirmation we may take this trade. Smash the like button if you find value in this analysis and drop a comment if you have any questions or let me know which pair to cover in my next analysis.

Gold todayI missed my Gold entry while creating Nasdaq video, however, there will be opportunities later, so we wait and watch to see what the market will do...

Gold will Go Down by Symmetrical Triangle Pattern!!!Gold is moving in a Descending channel near the Resistance zone($2,337-$2,318) .
In terms of Classical Technical Analysis , Gold has managed to form a Symmetrical Triangle Pattern , which indicates the continuation of the Downward Trend .
I expect Gold to continue falling(Probably with two scenarios) after breaking the lower line of the Symmetrical Triangle Pattern , at least to the Support zone($2,337-$2,318) .
Gold Analyze ( XAUUSD ), 1-hour time frame ⏰.
Do not forget to put Stop loss for your positions (For every position you want to open).
Please follow your strategy; this is just my idea, and I will gladly see your ideas in this post.
Please do not forget the ✅' like '✅ button 🙏😊 & Share it with your friends; thanks, and

DeGRAM | GOLD trend declineGOLD is moving in a descending channel between the trend lines.
The chart reached the level, broke through it and now it is under resistance.
The price will continue to decline.
-------------------
Share your opinion in the comments and support the idea with like. Thanks for your support!

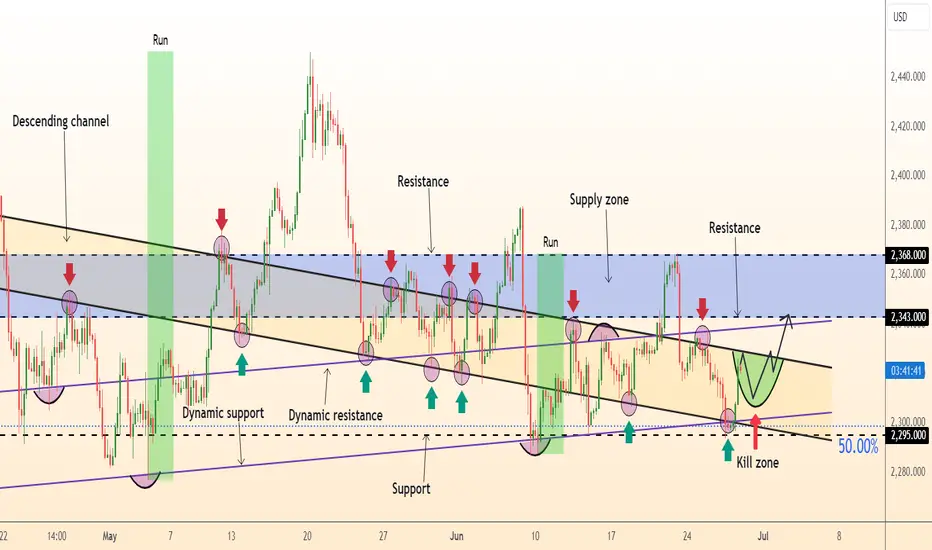
DeGRAM | GOLD pullback in the channelGOLD is moving in a descending channel between the trend lines.
The price reached the upper boundary of the channel and reacted instantly to reaching the 50% retracement level of the last bearish impulse.
We expect a pullback after a retest of the dynamic resistance.
-------------------
Share your opinion in the comments and support the idea with like. Thanks for your support!

DeGRAM | GOLD back in the channelGOLD is back in the channel again.
After a decrease in volatility, the chart formed a long green candle, which immediately brought the price back to the channel boundaries.
Now XAUUSD is trying to consolidate above the lower boundary.
We expect a rebound in case of consolidation above the channel boundary.
-------------------
Share your opinion in the comments and support the idea with like. Thanks for your support!

GOLDI am sorry
The previous transaction was stopped
Gold time frame is 5 minutes, I hope it will be compensated


GOLD (XAUUSD): Classic Bearish Pattern
I spotted a strong bearish pattern on Gold on an hourly time frame.
After a strong bearish rally that initiated on Friday last week,
the market started a correctional movement within a rising channel - a bearish flag pattern.
A breakout of the support of the flag is a reliable bearish signal.
Probabilities are high that Gold will drop at least to 2295
❤️Please, support my work with like, thank you!❤️

DeGRAM | GOLD trendline breakoutGOLD has broken down the ascending channel.
The chart broke down the dynamic support, which now acts as resistance. XAUUSD is trading between the trend lines.
We expect the decline to continue after the dynamic resistance is retested.
-------------------
Share your opinion in the comments and support the idea with like. Thanks for your support!

GOLD possible short for 2285weekly & daily trend reversing bearish side. supply zone for short 2335, stop loss: 2344, target: 2285

Today's trading trends, selling strategiesThe employment and economic data released by the US last week showed both positive and negative trends. However, the fairly positive job market has caused the market to predict that the US Federal Reserve (Fed) will not cut interest rates before November this year, instead of September as previously forecast.
Experts say that world gold prices in the next few days will adjust within a narrow range to wait for information from the Fed meeting taking place on June 11-12. Surely the Fed will keep interest rates unchanged this meeting. However, the market will look for information about the health of the US economy and the direction of inflation.
Some financial institutions believe that the Fed cutting interest rates may consider the deflation situation of the world's No. 1 economy, when it twice reported the country's gross domestic product growth in the first quarter. a sharp decrease compared to the fourth quarter of 2023.
Experts recommend that investors should patiently wait for information from the Fed meeting. Because gold prices will be strongly affected when the Fed releases positive information from the US economy.

Gold fell deeply at the end of the week, the downtrend continuedWorld gold prices tend to recover with spot gold increasing by 2.3 USD compared to last week's closing level to 2,294.9 USD/ounce.
The gold market this week is forecast to have many fluctuations and the direction of this precious metal depends heavily on the consumer price index (CPI) report and the interest rate decision of the US Federal Reserve (Fed). ) and a speech from the head of the world's most powerful central bank.
Last week, the market witnessed a strong sell-off when receiving two unfavorable information. Gold lost up to 80 USD during the day, recording the strongest intraday decline in 4 years. Specifically, the price reversed when the latest report showed that the People's Bank of China did not add gold last month, cutting off this central bank's 18-month gold buying streak. The report raises concerns that gold demand will slow down in the near future.
While the market is gradually stabilizing, expectations that the Fed will raise interest rates in September are gradually fading after the US Department of Labor's employment report dealt another strong blow to the market.
The Fed started the fight against inflation from March 2022 with interest rate increases. In this way, the US Central Bank wants to slow down economic growth and reduce inflationary pressure, with the goal of bringing inflation down to 2%. Recent inflation reports show that inflation is currently at 2.7%.
