DeGRAM | GOLD reached the resistance area📊 Technical Analysis
● Third rejection of the H1 descending-channel roof (≈3 382) printed a bearish engulfing and confirmed the prior “false-break” spike; price is now back under the purple retest line that acted as supply all month.
● An intraday rising wedge has cracked; its measured leg aligns with the grey targets at 3 344 (minor support) and the 3 289 liquidity pocket near the channel’s mid-rail.
💡 Fundamental Analysis
● Firmer US 2-yr yield near 4.8 % after upbeat PPI and hawkish Fed dots lifted the DXY, while CFTC data show fresh trimming of gold longs, reducing dip-buying fire-power.
✨ Summary
Fade rallies 3 335-3 345; sustained trade <3 320 eyes 3 344 then 3 289. Bear view void on an H1 close above 3 350.
-------------------
Share your opinion in the comments and support the idea with a like. Thanks for your support!
Goldsignal

Gold Correction = Bearish Divergence + Wedge + Zigzag CompleteGold ( OANDA:XAUUSD ) attacked the Resistance zone($3,387-$3,357) today after the release of the US CPI indices . Although the figures seemed to be in gold's favor, traders still seem to be determined to continue the price correction.
In terms of Elliott Wave theory , it seems that Gold has managed to complete the Zigzag Correction. We should wait for the next 5 down waves .
Also, we can see the Regular Divergence(RD-) between Consecutive Peaks .
In terms of Classic Technical Analysis , Gold appears to have successfully formed a Rising Wedge Pattern .
I expect Gold to drop to at least $3,296 AFTER breaking the lower line of the Rising Wedge Pattern .
Note: Stop Loss(SL)= $3,380
Gold Analyze ( XAUUSD ), 1-hour time frame.
Be sure to follow the updated ideas.
Do not forget to put a Stop loss for your positions (For every position you want to open).
Please follow your strategy; this is just my idea, and I will gladly see your ideas in this post.
Please do not forget the ✅' like '✅ button 🙏😊 & Share it with your friends; thanks, and Trade safe.

The gold trend is perfectly in line with expectations.The recent trend of gold is consistent with my expectations. Overall, the rebound is mainly based on fluctuating downward, and the rhythm of the oscillation between long and short positions is perfectly grasped. The upper resistance is still strong, and gold can still be shorted if the rebound is not broken.
From the current analysis of the gold trend, the lower support focuses on the area around 3315-3305. If it falls back to this position range, continue to look at the continuation of the rebound upward; the upper resistance focuses on the area around 3350-3362. The overall rhythm of the high-altitude and low-multiple range is still maintained, and the strategy is mainly to participate in the range back and forth.
1. Go long when gold falls back to 3315-3305, and the target is 3330-3340;
2. Go short when gold rebounds to 3350-3360, and the target is 3340-3330.

Insist on shorting gold on ralliesToday we made a total profit of 350 pips in 2 short trades. First, we shorted gold near 3345, and when gold fell to around 3330, we manually closed the order to lock in profits; the second time, gold rebounded sharply with the help of CPI data, and we seized the opportunity to short gold again near 3360, and ended the transaction by hitting TP: 3340. We accurately grasped the profit of gold shorting.
At present, gold is in a narrow range of fluctuations near the 3330 mark. Relatively speaking, gold is still in a weak position. Although gold has rebounded sharply with the help of the positive CPI data, it has shown a long upper shadow in the candle chart due to the rapid retracement, which has strengthened the resistance above and limited the rebound space of gold in the short term. In addition, the morphological structure shows signs of building a head and shoulders top structure. The resistance area in the short term is 3345-3355; followed by 3360-3370. Although gold is currently in a narrow range of fluctuations near the 3330 mark, it does not show obvious signs of support. It is easy to fall below the area near 3330 in a weak situation. The relatively strong support is in the 3320-3310 area, followed by the area near 3300-3290.
So for short-term trading, I still advocate taking the 3345-3355 area as resistance first and continue to short gold!

DeGRAM | GOLD broke the wedge📊 Technical Analysis
● Price still respects the former channel roof (now support) at 3 315-3 320; every dip to this line (green arrows) printed a higher low, preserving the rising-wedge structure.
● A break of the local wedge cap at 3 350 would reopen the April supply/median target at 3 435; failure to pierce keeps the pull-back window open toward the lower grey band at 3 245, where the broader demand begins.
💡 Fundamental Analysis
● US ISM-services prices and NFP cooled, lifting September Fed-cut odds >70 % and capping real yields, while continued PBoC purchases offset ETF outflows, under-pinning bullion.
✨ Summary
Buy 3 305-3 320; confirmation above 3 350 targets 3 435, extension 3 500. Long bias void on an H4 close below 3 245.
-------------------
Share your opinion in the comments and support the idea with a like. Thanks for your support!

Gold fluctuates repeatedly and opportunities emerge.Gold bottomed out in the Asian session and rebounded to break through the opening of the decline. The European session continued to break through yesterday's high. The US session continued to break through the key pressure position of 3335-3345, and walked out of the standard strong cycle. After the break, it is necessary to change the thinking and follow the trend to be bullish. Pay attention to the support below 3315-3325. In terms of operation, it is mainly long when it falls back. The upper side gradually looks to 3352 and 3365. If the pressure is not broken, look at the falling space!
Operation suggestion: Go long when gold falls back to 3325-3315, and look at 3338 and 3352! If the pressure above 3352 and 3365 is not broken, you can short!
The recent trading strategy ideas are all realized, and all the points are predicted accurately. If your current gold operation is not ideal, I hope I can help you avoid detours in your investment. Welcome to communicate with us!

xauusd weekly analysis
**XAU/USD Weekly Analysis**
*(June 2-13, 2025)*
---
### **LAST WEEK'S PERFORMANCE (June 2-6)**
**Price Action:**
- Weekly decline: **~2%**
- Key levels:
- Resistance: $3,355–$3,381 (61.8% Fibo)
- Support: $3,272–$3,288 (38.2% Fibo)
- Range: $3,291.50 (low) to $3,365 (high)
- Close: Near $3,310–$3,316
**Key Drivers:**
1. **USD Strength**: Fiscal concerns (Senate tax bill debate adding $3.8T debt)
2. **Reduced Safe-Haven Demand**: Trump delayed EU tariffs to July 9
3. **Central Bank Caution**: Market awaited ECB/BoC decisions and U.S. jobs data
---
### **NEXT WEEK OUTLOOK (June 9-13)**
**Critical Technical Levels:**
| **Support** | **Resistance** |
|-------------------|-------------------|
| $3,272–$3,288 | $3,370–$3,375 |
| $3,295 (SMA) | $3,381 (Key Breakout) |
| $3,210–$3,214 | $3,400–$3,434 |
**Fundamental Catalysts:**
1. **Central Banks**:
- ECB Decision (June 12) → Dovish stance = USD strength
- BoC Decision (June 11) → Rate cuts may boost USD
2. **U.S. Data**:
- Non-Farm Payrolls (June 13) → Strong data = fewer Fed rate cuts
3. **Geopolitical Risks**:
- Escalations in Ukraine/Middle East → Safe-haven demand
4. **U.S. Fiscal Policy**: Senate vote on $3.8T tax bill
**Market Sentiment:**
- **Bullish Case**: Break above $3,381 targets $3,500–$3,800
- **Bearish Risks**: Breakdown below $3,272 risks drop to $3,160
---
### **TRADING STRATEGY**
**Key Approaches:**
- **🔺 Long Setup**:
- Entry: Above $3,381
- Target: $3,500
- Stop-loss: $3,320
- **🔻 Short Setup**:
- Entry: Below $3,272
- Target: $3,210
- Stop-loss: $3,310
- **Event Hedging**: Use options around ECB/BoC/NFP events
**Risk Management Note:**
> "Gold's trajectory hinges on USD dynamics and central bank guidance. A weekly close above $3,381 confirms bull trend resumption."
---
### **KEY EVENTS CALENDAR**
| Date | Event | Impact Level |
|------------|---------------------------|--------------|
| June 11 | Bank of Canada Rate Decision | High |
| June 12 | ECB Rate Decision | High |
| June 13 | US Non-Farm Payrolls | Very High |
| Mid-week | US Senate Tax Bill Vote | Moderate-High|
---
**Conclusion:**
Next week presents a binary setup for XAU/USD:
- Break above **$3,381** opens path to $3,500+
- Failure to hold **$3,272** risks correction to $3,210
Prioritize risk management during high-impact events. The long-term uptrend remains intact but short-term direction depends on USD and central bank policy.
for intra day traders and scalpers follow the range zone

DeGRAM | GOLD forming the ascending wedge📊 Technical Analysis
● Price is coiling inside an ascending flag that is riding the new support line at 3 342; flag range compression after each pull-back signals energy for a thrust.
● The pattern sits above the old channel roof, turning the former resistance into a launch pad; measured move of the flag points to the next confluence at 3 435.
💡 Fundamental Analysis
● US jobless claims ticked up while 10-yr yields slipped under 4.30 %; lower carry costs and renewed Chinese reserve buying reported by Reuters keep dip-buyers active in bullion.
✨ Summary
Buy 3 330-3 350; flag break targets 3 435, stretch 3 500. Invalidate on a 4 h close < 3 245.
-------------------
Share your opinion in the comments and support the idea with a like. Thanks for your support!

Gold Rejected at Resistance, Targets $3,305 & Below Gold ( OANDA:XAUUSD ) rose to $3,400, as I expected in my previous idea .
Gold is trading near the Resistance zone($3,387-$3,357) and has failed to break the resistance zone validly .
In terms of Elliott Wave theory , it seems that Gold has managed to complete the microwave 5 of the main wave C with the help of Expanding Ending Diagonal . It was a corrective Zigzag(ABC/5-3-5) structure .
Also, we can see the Regular Divergence(RD-) between Consecutive Peaks.
I expect Gold to touch $3,305 after breaking the lower line of the ascending channel at the first target and then decline to the Support zone($3,281-$3,245) and Monthly Pivot Poin t.
Note: Stop Loss(SL)= 3394.000
Gold Analyze ( XAUUSD ), 4-hour time frame.
Be sure to follow the updated ideas.
Do not forget to put a Stop loss for your positions (For every position you want to open).
Please follow your strategy; this is just my idea, and I will gladly see your ideas in this post.
Please do not forget the ✅' like '✅ button 🙏😊 & Share it with your friends; thanks, and Trade safe.

Gold= Breaks Resistance by Bullish Patterns + Geopolitical BoostGold ( OANDA:XAUUSD ) touched $3,337 as I expected in my previous idea .
Gold has now managed to break the Resistance lines and is trying to break the Resistance zone($3,387-$3,357) .
From a Classic Technical Analysis perspective, two Bullish Reversal Patterns are clearly visible on the Gold chart :
Descending Broadening Wedge Pattern
Inverse Head and Shoulders Pattern
According to Elliott Wave theory , by breaking the Resistance zone($3,387-$3,357) , we can confirm the start of an impulsive wave .
Also, given the increasing tension between Ukraine and Russia in recent days, there is a possibility that the price of Gold will increase due to the increased tensions .
I expect Gold to start rising again after a pullback to the neckline and resistance lines , and after breaking the Resistance zone($3,387-$3,357) , to rise to the target I have indicated on the chart.
Note: If Gold touches $3,299 , we should expect further declines.
Note: There is a possibility of emotional movements in the chart today when Fed Chair Powell speaks.
Gold Analyze ( XAUUSD ), 2-hour time frame.
Be sure to follow the updated ideas.
Do not forget to put a Stop loss for your positions (For every position you want to open).
Please follow your strategy; this is just my idea, and I will gladly see your ideas in this post.
Please do not forget the ✅' like '✅ button 🙏😊 & Share it with your friends; thanks, and Trade safe.

DeGRAM | GOLD bullish takeover📊 Technical Analysis
● Price reclaimed the grey 3 305-3 330 supply and is now basing on the purple trend-line, turning a former cap into demand and keeping the sequence of higher-lows inside the 2-month rising channel.
● An H16 bullish engulfing fixed above the old channel roof (≈3 342) and completes an ascending triangle whose 1.618 swing points to the 3 435 confluence zone; a break of that ceiling would expose the fib / outer rail cluster near 3 500.
💡 Fundamental Analysis
● World Gold Council reports May was the strongest month of net central-bank buying since January, offsetting ETF outflows, while weaker US ADP hiring trimmed yields and cooled the dollar, supporting bullion.
✨ Summary
Buy 3 305-3 330; triangle break >3 350 targets 3 435, stretch 3 500. Long view void on a 16 h close <3 245.
-------------------
Share your opinion in the comments and support the idea with a like. Thanks for your support!

DeGRAM | GOLD above the $3340 level📊 Technical Analysis
● H4 candle has closed above the descending-channel roof and the grey 3 284-3 325 supply, then retested it as support — a breakout-retest pattern that usually precedes trend acceleration.
● Price is now confined in a fresh rising wedge riding the long-term trend-line; the wedge’s 1.618 extension aligns with the next confluence at 3 435 while dynamic support rises toward 3 245.
💡 Fundamental Analysis
● Gold got a tail-wind after US ISM manufacturing fell back into contraction (48.7) as Treasury yields and the DXY slipped, while reports of renewed Chinese central-bank purchases lifted physical demand expectations.
✨ Summary
Buy 3 285-3 305; hold above 3 245 targets 3 435, stretch 3 500. Bias invalidated on a 4 h close below 3 245.
-------------------
Share your opinion in the comments and support the idea with a like. Thanks for your support!

Gold: Bullish Flag Formation Suggests Further Upside Potential Hello guys, let's dive into Gold analysis!
Gold is currently forming a bullish flag pattern, a continuation formation that typically follows a strong upward impulse (flagpole). After a sharp rally, the price consolidated within a downward channel, creating the classic flag structure.
🔍 Technical Breakdown:
Flagpole: The strong bullish rally in early April marks the beginning of the uptrend.
Flag (Channel): Price has corrected in a downward-sloping channel, respecting both upper and lower bounds, creating a textbook flag pattern.
Breakout Zone: Price is now testing the upper boundary of the flag. A confirmed breakout above this resistance would signal a continuation of the prior uptrend.
🎯 Price Targets:
First Target: Around $3,445, which aligns with the measured move from the breakout point.
Second Target: Around $3,725, representing full flagpole projection from the breakout zone.
📌 Key Levels to Watch:
Breakout Confirmation: A strong 4H close above the flag’s upper boundary (~$3,260) with volume confirmation would validate the pattern.
_____________________________________
Invalidation: A rejection from the resistance and a fall below the channel may delay the bullish scenario, potentially retesting lower support around $3,090.
📊 Conclusion:
This setup favors bulls, but patience is key. Traders may consider waiting for a clear breakout and retest for safer long entries, aiming for the outlined targets.

Gold Finds Support in PRZ – $3,337 in Sight? As I expected in my previous idea , Gold ( OANDA:XAUUSD ) moved towards the Support zone($3,280-$3,245) after breaking the lower line of the ascending channel.
Gold is moving near the Support zone($3,280-$3,245) , Potential Reversal Zone(PRZ) and Monthly Pivot Point .
In terms of Elliott Wave theory , Gold appears to be completing a main wave 4 . The structure of the main wave 4 can be complex . Confirmation of the end of the main wave 4 requires a break of the Resistance lines and Resistance zone($3,387-$3,357) .
I expect Gold to move up after entering the Potential Reversal Zone(PRZ) and the first target could be $3,314 and the second target could be $3,337 . If the momentum is high for Gold, you can consider higher targets for Gold to increase .
Note: If Gold touches $3,245 , we should expect further declines.
Gold Analyze ( XAUUSD ), 2-hour time frame.
Be sure to follow the updated ideas.
Do not forget to put a Stop loss for your positions (For every position you want to open).
Please follow your strategy; this is just my idea, and I will gladly see your ideas in this post.
Please do not forget the ✅' like '✅ button 🙏😊 & Share it with your friends; thanks, and Trade safe.
XAUUSD Analysis todayHello traders, this is a complete multiple timeframe analysis of this pair. We see could find significant trading opportunities as per analysis upon price action confirmation we may take this trade. Smash the like button if you find value in this analysis and drop a comment if you have any questions or let me know which pair to cover in my next analysis.

XAUUSD Bearish Signal | Technical + Custom AlgoSmart Trend Signal | Technical Analysis + Custom Algorithm
This signal is the result of a combination of classic technical trend analysis and a proprietary software I personally developed.

DeGRAM | GOLD under the $3300 level📊 Technical Analysis
● Third touch of the channel’s upper rail near $3 330 printed a shooting-star and price is now riding back under the internal trend-pivot $3 315, restoring a sequence of lower-highs.
● Intraday support from the short-lived wedge has flipped to resistance; acceptance below the $3 284 line exposes the mid-band $3 210 and, if momentum persists, the channel floor/April pivot at $3 120.
💡 Fundamental Analysis
● US 5-yr yield hit a five-week high after Fed’s Williams said policy is “not restrictive enough yet”, while the DXY held near 105 as May jobless claims surprised on the downside. Higher real rates and a firmer dollar keep ETF outflows running.
✨ Summary
Sell rallies ≤$3 315; breakdown under $3 284 targets $3 210 then $3 120. Shorts negated on a 4 h close above $3 350.
-------------------
Share your opinion in the comments and support the idea with a like. Thanks for your support!

XAUUSD Bullish Signal | Technical + Custom AlgoSmart Trend Signal | Technical Analysis + Custom Algorithm
This signal is the result of a combination of classic technical trend analysis and a proprietary software I personally developed.

XAUUSD Bearish Signal | Technical + Custom AlgoSmart Trend Signal | Technical Analysis + Custom Algorithm
This signal is the result of a combination of classic technical trend analysis and a proprietary software I personally developed.

Gold Continues to Decline as USD Strengthens📊 Market Developments:
Gold prices continued to decline on May 29, reaching weekly lows below $3,250/oz. The primary driver is the strong recovery of the US Dollar following a US court's decision on tariffs and cautious FOMC minutes indicating the Fed remains vigilant about inflation, reducing gold's appeal as a safe-haven asset.
📉 Technical Analysis:
• Key Resistance: $3,285 – $3,300
• Nearest Support: $3,240 – $3,230
• EMA: Price is below the 09 EMA, indicating a short-term downtrend.
• Candlestick Patterns / Volume / Momentum: Price has broken below a short-term ascending trendline and is retesting the resistance area, confirming bearish signals.
📌 Outlook:
Gold may continue to decline in the short term if the USD maintains its recovery and the price fails to break above the $3,285 – $3,300 resistance zone.
________________________________________
💡 Suggested Trading Strategy:
SELL XAU/USD at: $3,275 – $3,285
o 🎯 TP: $3,240
o ❌ SL: $3,305
BUY XAU/USD at: $3,230
o 🎯 TP: $3,270
o ❌ SL: $3,215

DeGRAM | GOLD reached the resistance line📊 Technical Analysis
● Twin rejections inside the 3 300-3 340 supply, exactly where the purple retest line and rising-channel ceiling intersect, have carved a lower high and completed a bearish flag.
● RSI confirms negative divergence and the candle body is back below the 3 284 pivot, favouring a slide toward the channel median at 3 172 and, if broken, the floor/September swing low near 3 100.
💡 Fundamental Analysis
● Upbeat US second-estimate GDP and stronger durable-goods orders pushed 2-yr Treasury yields above 5 %, raising gold’s carry cost, while WGC logs a sixth straight week of ETF outflows and the PBoC reportedly paused reserve buying in May.
✨ Summary
Short below 3 300; objectives 3 172 → 3 100. Invalidate on a sustained close above 3 350.
-------------------
Share your opinion in the comments and support the idea with a like. Thanks for your support!

XAUUSD Bullish Signal | Technical + Custom Algo📈
This signal is the result of a fusion between classic trend analysis and a proprietary algorithm I’ve personally developed.
First, the system identifies the market trend strictly through technical indicators — no emotional bias, no subjective interpretation.
Next, a custom-built intelligent algorithm analyzes the data to pinpoint optimal entry and exit points, then generates the signal.
🔍 The outcome? A fully data-driven signal — no guessing, no personal bias involved.
📌 Note: This signal is intended for educational and analytical purposes only. Trading is at your own risk.

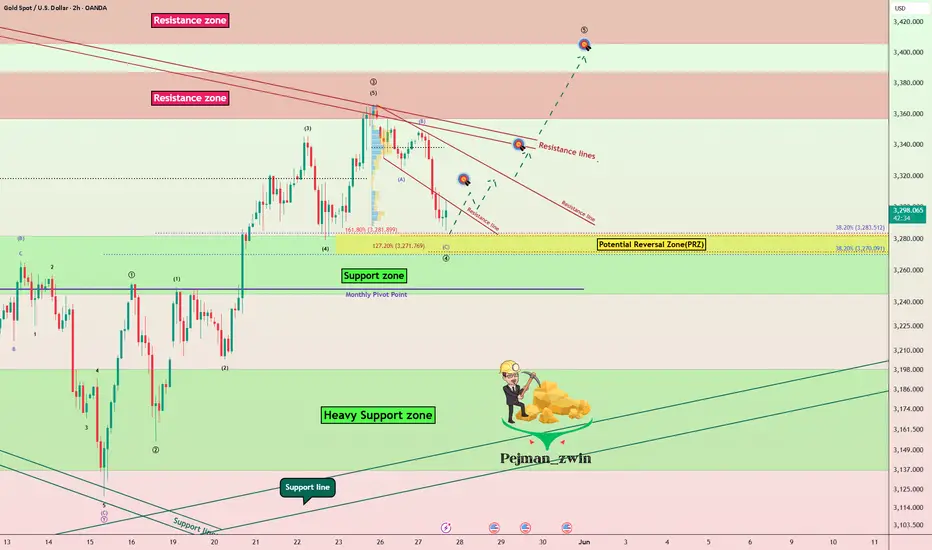
Gold Enters PRZ and TRZ – Correction is Coming!?Gold ( OANDA:XAUUSD ) moved as I expected in the previous Idea and reached the Resistance zone($3,387-$3,357) and Resistance lines .
Gold is moving near the Resistance lines , Resistance zone($3,387-$3,357) , Potential Reversal Zone(PRZ) and Time Reversal Zone(TRZ) .
Also, we can see the Regular Divergence(RD-) between Consecutive Peaks .
In terms of Elliott Wave theory , Gold appears to be completing microwave 5 of Main wave 3 , so Main wave 3 could have an extended structure .
I expect Gold to experience at least one correction after entering the PRZ and TRZ , the correction could continue to $3,329 . If the Support lines are broken, the next target could be the Support zone($3,280-$3,245) .
Note: If Gold touches $3,420, there is a possibility of further pumping and breaking the Resistance zone($3,435-$3,406).
Gold Analyze ( XAUUSD ), 2-hour time frame.
Be sure to follow the updated ideas.
Do not forget to put a Stop loss for your positions (For every position you want to open).
Please follow your strategy; this is just my idea, and I will gladly see your ideas in this post.
Please do not forget the ✅' like '✅ button 🙏😊 & Share it with your friends; thanks, and Trade safe.
