Gold May Undergo a Short-Term Downward Correction
📊 Market Overview
Gold prices are hovering around $3,348/oz, with the day's low near $3,340. Weak U.S. economic data, including a decline in the services PMI to 49.9 and low job growth, have reinforced expectations of a Federal Reserve rate cut. However, gold prices have yet to break through strong resistance levels due to profit-taking and cautious sentiment ahead of the upcoming Non-Farm Payrolls report.
📉 Technical Analysis
• Key Resistance: $3,370 – $3,375
• Immediate Support: $3,335 – $3,340
• EMA 09: Price is above the EMA 09 line, indicating a short-term uptrend.
• Candlestick Patterns / Volume / Momentum:
o MACD on H4 chart shows a golden cross, supporting the uptrend.
📌 Outlook
Gold may undergo a short-term correction if U.S. employment data exceeds expectations or if there are positive developments in international trade negotiations.
💡 Suggested Trading Strategy
SELL XAU/USD at: $3,370 – $3,375
o 🎯 TP: $3,350
o ❌ SL: $3,385
BUY XAU/USD at: $3,335 – $3,340
o 🎯 TP: $3,360
o ❌ SL: $3,325
Goldsignals

Gold Potential UpsidesHey Traders, in today's trading session we are monitoring XAUUSD for a buying opportunity around 3,370 zone, Gold is trading in an uptrend and currently is in a correction phase in which it is approaching the trend at 3,370 support and resistance area.
Trade safe, Joe.

Gold Hits All Targets with 500+ Pips – Eyes Now on $3420By examining the gold chart on the 4-hour timeframe, we can see that after our previous analysis, the price moved exactly as expected and successfully hit all four targets — $3367, $3380, $3391, and $3400 — reaching as high as $3403 and delivering over 500 pips of return.
After sweeping the liquidity above $3400, the price corrected back to around $3370. Currently, gold is trading around $3380. If the price can hold above the $3370 level, we can expect a continuation of the bullish move toward the $3420 area.
Please support me with your likes and comments to motivate me to share more analysis with you and share your opinion about the possible trend of this chart with me !
Best Regards , Arman Shaban

Gold Breaks Out of Bullish Flag >> Eyes on $3,480 and $3,720Alright, so looking at this 4-hour chart of Gold, there's a really clean bullish flag pattern that’s just broken out, which is a strong continuation signal.
You can see that after that big push upward, the price consolidated inside a downward (sloping channel for a few weeks. That’s pretty classic behavior. a strong move followed by a period of rest where the market cools off a bit, but without giving up too much ground. That’s what forms the "flag."
Now, the exciting part is that we’ve just broken out of that channel to the upside, and it’s not just a breakout for the sake of it, it’s supported by an inverse head and shoulders right at the top of the channel. That’s a double confirmation that buyers are stepping in with conviction.
The chart also marks two potential targets:
The first target is around $3,480, which is a reasonable measured move based on the height of the flag.
The second target is around $3,720, which would be a more extended continuation if the momentum kicks in.
As long as the price holds above the breakout area (around $3,320–$3,340), this setup looks solid. If we pull back and retest that area and hold, that might be a great long entry with those two targets in mind.
If price drops back into the channel, though, that could mean the breakout was a fakeout, so that level is key.

Gold Holds Above Key Support – Eyes Still on 3400 (READ CAPTION)By examining the gold chart on the 4-hour timeframe, we can see that the price successfully hit the $3367 target exactly as expected, and then corrected back to $3346. Currently, gold is trading around $3358, and if it can hold above $3350, we can expect further upside. Based on the previous analysis, the next bullish targets remain at $3367, $3380, $3391, and $3400. (Maximum support is always appreciated, my friends!)

GOLD - Reached at ultimate Resistance? whats next??#GOLD. market perfectly bounced above our area that was 3382
now market just reached at his today most expensive region that is 3402-04
keep close that region and if market hold it in that case we can expect drop from here..
keep close it.
NOTE: keep in mind that above 3402-04 we will go for cut n reverse on confirmation.
good luck
trade wisely

Gold= Breaks Resistance by Bullish Patterns + Geopolitical BoostGold ( OANDA:XAUUSD ) touched $3,337 as I expected in my previous idea .
Gold has now managed to break the Resistance lines and is trying to break the Resistance zone($3,387-$3,357) .
From a Classic Technical Analysis perspective, two Bullish Reversal Patterns are clearly visible on the Gold chart :
Descending Broadening Wedge Pattern
Inverse Head and Shoulders Pattern
According to Elliott Wave theory , by breaking the Resistance zone($3,387-$3,357) , we can confirm the start of an impulsive wave .
Also, given the increasing tension between Ukraine and Russia in recent days, there is a possibility that the price of Gold will increase due to the increased tensions .
I expect Gold to start rising again after a pullback to the neckline and resistance lines , and after breaking the Resistance zone($3,387-$3,357) , to rise to the target I have indicated on the chart.
Note: If Gold touches $3,299 , we should expect further declines.
Note: There is a possibility of emotional movements in the chart today when Fed Chair Powell speaks.
Gold Analyze ( XAUUSD ), 2-hour time frame.
Be sure to follow the updated ideas.
Do not forget to put a Stop loss for your positions (For every position you want to open).
Please follow your strategy; this is just my idea, and I will gladly see your ideas in this post.
Please do not forget the ✅' like '✅ button 🙏😊 & Share it with your friends; thanks, and Trade safe.

GOLD - where is current Resistance? Holds or not??#GOLD... perfect holdings and bounced back and now market have his ultimat resistance area is 3382-84
Thats play key role from yesterday and in today it will be our key level.
Keep close and only hold shorts below that other use not
Note: above 3382 we will go for cut n reverse on confirmation.
Good luck
Trade wisely

GOLD (XAUUSD): Strong Bullish Pattern
Following my previous analysis, Gold in going up.
Your next signal to buy will be a bullish breakout
of a neckline of an ascending triangle pattern on a 4H time frame.
A 4H candle close above 3392 will confirm a violation.
Next resistances will be 3408 / 3428
❤️Please, support my work with like, thank you!❤️
I am part of Trade Nation's Influencer program and receive a monthly fee for using their TradingView charts in my analysis.

I still have a short position.Although gold has risen sharply to above 3380 due to the intensification of the Russian-Ukrainian conflict, it has not made a substantial breakthrough, and has not stabilized above 3380. The bulls are not determined, which also shows that the technical suppression in the 3290-3295 area above is still strong. If gold does not break through in one fell swoop, gold is likely to usher in a wave of retracement in the short term.
Due to the fundamental impact of tariff issues and geopolitical conflicts, for short-term trading, we should not have too high expectations for the extent of the retracement for the time being, but it is expected to retrace to the 3365-3355 area. In terms of short-term trading, I still hold a short position executed near 3375, and I hope that gold can fall back and hit TP as expected.
Trading strategy:
Consider shorting gold in the 3375-3385 area, TP: 3365-3355
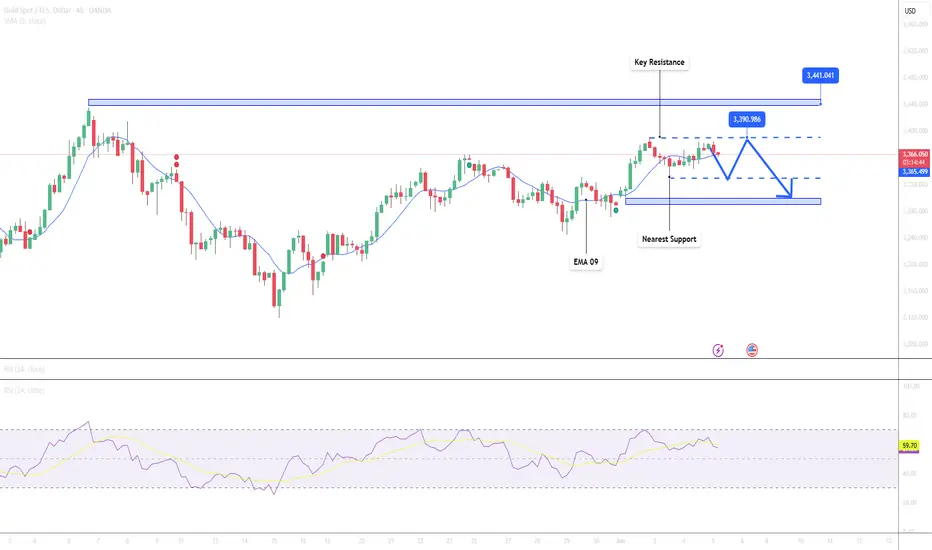
Gold Approaches Key Resistance – Minor Pullback Possible📊 Market Overview:
Gold prices continue their upward momentum and have now reached $3,367/oz, as markets await the upcoming U.S. Nonfarm Payrolls (NFP) report later this week. The U.S. dollar is slightly weaker and Treasury yields are stable, helping gold maintain its strength. However, mixed forecasts from major financial institutions are creating psychological pressure on investors.
📉 Technical Analysis:
• Key Resistance: $3,390 – $3,440
• Nearest Support: $3,330 – $3,300
• EMA: Price remains above both EMA 50 and EMA 9 → indicating a sustained uptrend.
• RSI (H4): Near 66 → not overbought yet, but limited room for further upside.
• Candle pattern: Recent H1 candles show long upper wicks → signaling profit-taking at higher levels.
📌 Outlook:
Gold may face a minor short-term correction if it fails to break above the $3,390 resistance area, especially as the upcoming U.S. jobs report could potentially strengthen the U.S. dollar.
💡 Suggested Trading Strategy:
SELL XAU/USD at: $3,375 – $3,390
🎯 TP: $3,355
❌ SL: $3,405
BUY XAU/USD at: $3,345 – $3,330
🎯 TP: $3,365
❌ SL: $3,315
Gold Pullback Entry Opportunity Gold resumed its rally, sparked by recent tarrif news. Price is pulling back at the moment and has entered an sweet spot where we can confidently take our first low risk Buy.
BUYING HERE BECAUSE
1. We're entering into a low volume area, which is also in line with an FVG on the 1hr chart
2. When a new uptrend starts, i like to buy first 2 instances price pullback to bounce from my trend cloud indicator We didn't get a perfect bounce as it has broken below it, but i'am still buying regardless due to my first reason above about the low volume gap.
PROFIT TARGET
Setting my profit target to my trusted Exofade peak. As long as the uptrend continues, Exofade peaks will ALWAYS get taken out. That why i love this indicator, and its free. It's my gift to y'all :) . Just search for it in trading view indicators.

Continue to short gold after the reboundTechnical analysis:
Gold rebounded after hitting 3333 overnight. So far, it has reached 3361. However, it can be clearly seen from the rebound process that the rebound is not strong, so I think the rebound space may not be too high. In the short term, it faces resistance in the 3365-3375 area. The strong resistance above the 3390-3400 area still exists, so it may be difficult for bulls to make a major breakthrough in the short term; and the support area below in the short term is in the 3340-3330 area, and the important support is in the area around 3320;
Trading strategy:
Consider shorting gold in the 3365-3375 area, TP: 3350-3340
Gold Continues to Rise as USD Weakens📊 Market Overview:
Gold prices are rebounding slightly after a pullback from a four-week high. The weakening USD, driven by concerns over US-China trade tensions and upcoming employment data, has bolstered safe-haven demand for gold.
📉 Technical Analysis:
• Key Resistance: $3,365 – $3,377
• Nearest Support: $3,320 – $3,290
• EMA 09: Price is above the 09 EMA, indicating a short-term uptrend.
• RSI: The RSI on the H4 timeframe is at 64.06, suggesting bullish momentum with room before reaching overbought territory
📌 Outlook:
Gold may continue its short-term rise if the USD remains weak and US employment data falls short of expectations.
💡 Suggested Trading Strategy:
SELL XAU/USD at: $3,377
o 🎯 TP: $3,357
o ❌ SL: $3,387
BUY XAU/USD at: $3,290
o 🎯 TP: $3,310
o ❌ SL: $3,280

The pullback did not change the bullish trendGold maintained a weak structure of shock in the Asian and European sessions, and the price slowly adjusted back, forming a secondary bottoming pattern during the day. The current trend is mainly structural consolidation. From a technical perspective, 3328 and 3335 below constitute key short-term support. If it does not break expectations, it will effectively stop the decline and stabilize, and provide a basis for a rebound.
At present, the profit space for chasing shorts is limited. The only stable idea is to wait for the gold price to fall back and stabilize before participating in the long position layout. In terms of operation, it is recommended to arrange long positions near the support level, focusing on the strength of gold's retracement in the 3325-3330 range, and confirming the stabilization of the decline.
Once it stabilizes and rebounds, the short-term long target can be seen at 3350 and 3378, and the extended target focuses on the previous high of 3392. If it breaks through strongly and stands firm at this position, it will further open up to 3400-3410 space.
Operation suggestion: If gold falls back to the 3325-3330 range, go long with a light position. If it falls to 3335 and stabilizes, you can enter long orders in advance, with targets at 3350 and 3378.

Gold is taking a break, the next wave will be even stronger.Gold opened at 3382 today and rebounded to 3392 for a technical decline adjustment. So far, gold has hit a low of 3351. Currently, gold continues to fluctuate around 3360. We will pay attention to the support situation at 3345-50 below. If it does not break through, we will look for opportunities to go long.
Judging from the current trend of gold prices, the overall bullish trend remains, and there is still the possibility of further upward movement in the short term. The support below focuses on the 3345-3350 area, which is an important defensive position for short-term bulls. If it falls back to this area and stabilizes during the day, you can continue to rely on this position to arrange long orders, and the bullish thinking remains unchanged. Pay attention to the 3395-3400 first-line pressure above. If this range is effectively broken, the gold price is expected to hit the previous high and further open up the upward space. From the daily level, the market is still in the "low-long" rhythm of the trend, and it is expected to maintain a volatile upward trend in the short term. The recent market fluctuations are large. In terms of operation, it is necessary to strictly control the position and pay attention to risk prevention.
Gold operation strategy recommendation: Go long when gold falls back to 3345-3355, target: 3380-3390.

GOLD (XAUUSD): Bullish Continuation Confirmed
As we discussed yesterday, Gold managed to break and close above
a resistance line of a bullish flag pattern on a daily.
It opens a potential for more growth.
Our next resistance is 3429.
For buying, consider the expanding demand zone based
on a broken horizontal resistance and a trend line.
❤️Please, support my work with like, thank you!❤️
I am part of Trade Nation's Influencer program and receive a monthly fee for using their TradingView charts in my analysis.

XAUUSD Analysis todayHello traders, this is a complete multiple timeframe analysis of this pair. We see could find significant trading opportunities as per analysis upon price action confirmation we may take this trade. Smash the like button if you find value in this analysis and drop a comment if you have any questions or let me know which pair to cover in my next analysis.

XAUUSD Analysis todayHello traders, this is a complete multiple timeframe analysis of this pair. We see could find significant trading opportunities as per analysis upon price action confirmation we may take this trade. Smash the like button if you find value in this analysis and drop a comment if you have any questions or let me know which pair to cover in my next analysis.

XAUUSD Critical Lower Highs break-out just happened.Gold (XAUUSD) broke above the Lower Highs trend-line that originated from the April 22 All Time High (ATH) and has basically re-established the long-term bullish trend and confirmed the bullish break-out.
The extension can go as high as 3700, which represents a +18.37% rise from the 1D MA50 (red trend-line) bottom. That is how much the last 1D MA50 (near) test increased (April 07). A Higher Lows trend-line (dashed) may potentially support this uptrend all the way before the next correction.
-------------------------------------------------------------------------------
** Please LIKE 👍, FOLLOW ✅, SHARE 🙌 and COMMENT ✍ if you enjoy this idea! Also share your ideas and charts in the comments section below! This is best way to keep it relevant, support us, keep the content here free and allow the idea to reach as many people as possible. **
-------------------------------------------------------------------------------
Disclosure: I am part of Trade Nation's Influencer program and receive a monthly fee for using their TradingView charts in my analysis.
💸💸💸💸💸💸
👇 👇 👇 👇 👇 👇

GOLD (XAUUSD): Sense of Fear?!
As the Russia-Ukraine peace talks are going today,
Gold shows clear signs of worry.
The market turned bullish after the opening and is currenty
breaking a resistance line of a bullish flag pattern on a daily
that we discussed earlier.
To confirm the violation, we will need a daily candle close above that.
As the results of the talks are still unknown, more moves may occur today.
So the today's close will be very important.
Let's patiently wait.
❤️Please, support my work with like, thank you!❤️

Will Gold drop to 3200 zone next week?🟡 1. What happened last week with Gold (XAUUSD)
Gold began last week by testing the 3350 resistance zone, hinting the end of the correction and the potential for an upside breakout.
However, in the following days, the market reversed aggressively, reaching as low as 3250 on Thursday — a drop of nearly 1000 pips from the local top and resistance zone.
After this sharp fall, Gold bounced back above 3300, retested the 3325–3330 area, but failed once again — closing the week below 3300.
❓ 2. Key question: Has the rebound ended or is it just a deeper trap?
The market has shown a fake-out followed by compression under resistance.
So the real question becomes: Will the 3280–3290 support finally give in, or will bulls defend it again?
________________________________________
🔻 3. Why I expect a continuation to the downside
Here’s what the chart structure tells us:
• Clear lower highs and lower lows — the trend remains bearish
• 3330 has turned into major confluence resistance
• Every bounce is sold, showing fading bullish momentum
• The support at 3280–3290 is being squeezed repeatedly
If 3280 breaks cleanly, price action will likely accelerate downward.
________________________________________
🧭 4. Trading Plan for Next Week
Focus remains on selling rallies, especially if price rises above 3300.
📉 Invalidation: any clean break and hold above 3330
🎯 Target Zones:
• 3250 = Soft target (first reaction zone)
• 3200 = Real target (bearish continuation zone if structure unfolds as expected)
Use structure, not emotion. Let the breakout confirm the plan.
________________________________________
🚀 5. Final thoughts
The price action around 3280 will likely set the tone for next week.
A breakdown here confirms the bearish structure and opens the door to 3250, then 3200.
Until then: sell rallies, manage risk, and wait for the chart to validate your edge.
Stay sharp. 🚀
Disclosure: I am part of TradeNation's Influencer program and receive a monthly fee for using their TradingView charts in my analyses and educational articles.

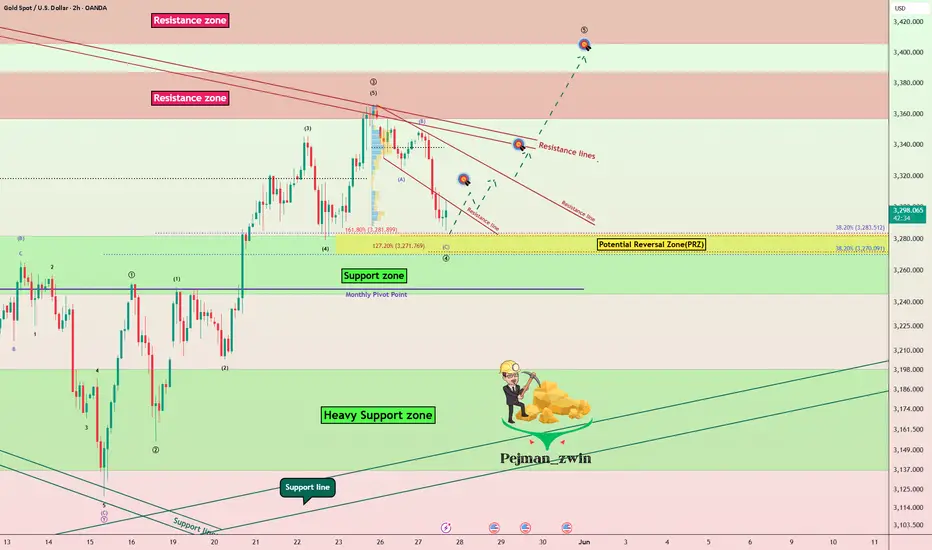
Gold Finds Support in PRZ – $3,337 in Sight? As I expected in my previous idea , Gold ( OANDA:XAUUSD ) moved towards the Support zone($3,280-$3,245) after breaking the lower line of the ascending channel.
Gold is moving near the Support zone($3,280-$3,245) , Potential Reversal Zone(PRZ) and Monthly Pivot Point .
In terms of Elliott Wave theory , Gold appears to be completing a main wave 4 . The structure of the main wave 4 can be complex . Confirmation of the end of the main wave 4 requires a break of the Resistance lines and Resistance zone($3,387-$3,357) .
I expect Gold to move up after entering the Potential Reversal Zone(PRZ) and the first target could be $3,314 and the second target could be $3,337 . If the momentum is high for Gold, you can consider higher targets for Gold to increase .
Note: If Gold touches $3,245 , we should expect further declines.
Gold Analyze ( XAUUSD ), 2-hour time frame.
Be sure to follow the updated ideas.
Do not forget to put a Stop loss for your positions (For every position you want to open).
Please follow your strategy; this is just my idea, and I will gladly see your ideas in this post.
Please do not forget the ✅' like '✅ button 🙏😊 & Share it with your friends; thanks, and Trade safe.