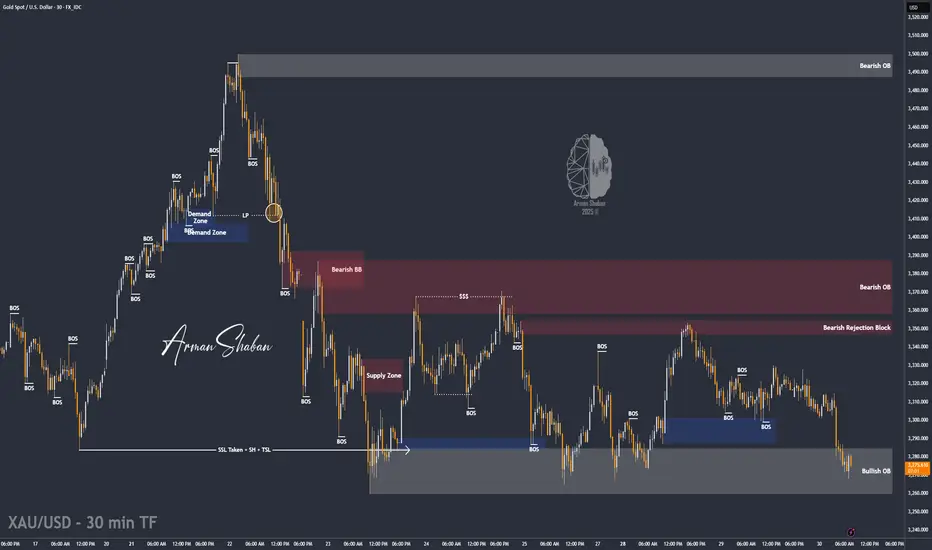
XAU/USD: High Volatility is Expected! (READ THE CAPTION)By analyzing the gold chart on the 30-minute timeframe, we can see that, as expected, the price began rising from the $3310 zone yesterday and reached $3330, delivering a 200-pip gain.
After that, selling pressure took over, and gold is now trading around $3277. Given the current market structure and today's important news events, I expect high volatility in both bullish and bearish directions.
One of the key liquidity pools likely to be targeted today lies below $3259, and before any potential drop, we may see the liquidity gap between $3288 and $3303 being filled.
Please support me with your likes and comments to motivate me to share more analysis with you and share your opinion about the possible trend of this chart with me !
Best Regards , Arman Shaban
Goldsignals
The bearish trend is obvious, 3180 is foreseeable!Fundamentals:
Focus on US economic data and Fed dynamics;
Technical aspects:
After gold fell below the recent low support area of 3260, the bearish trend became more obvious. Although gold has stopped falling near 3220, there is no obvious sign of bottoming out. From the current structure, gold still has room to fall, and the area near 3180 can be foreseen in the short term. However, after a sharp drop in gold, there may still be repetitions in the short term, so it is not advisable to over-short gold for the time being. Gold still has the possibility of a short-term rebound to the 3245-3255 area.
Trading strategy:
1. Consider waiting for gold to rebound to the 3245-3255 area before shorting gold; TP: 3235-3225;
2. Consider trying to go long on gold in small batches in the 2330-2320 area, TP: 3245-3255, and then short gold after reaching the target area.

XAUUSD Analysis todayHello traders, this is a complete multiple timeframe analysis of this pair. We see could find significant trading opportunities as per analysis upon price action confirmation we may take this trade. Smash the like button if you find value in this analysis and drop a comment if you have any questions or let me know which pair to cover in my next analysis.

XAUUSD drop to daily support?XAUUSD with the new daily open price with a gap and started to trend back down. As the market is just below a significant support, the price may continue to drop to the daily 20ema which is also previous swing high turn support.
A sell trade is high probably after price action confirmation.

Short gold, gold may continue to fall to 3245-3235Fundamentals:
1. Focus on the performance of US economic data and the dynamics of the Federal Reserve;
2. Pay attention to whether the geopolitical conflicts will escalate, including the situation between India and Pakistan, Russia and Ukraine, and the situation between the United States and Iran, etc.
Technical aspects:
The rebound momentum of gold has gradually weakened, and gold has failed to effectively break through the 3320-3330 resistance zone many times recently, and has built multiple short-term top structures in this area, which has limited the height of gold rebound and further strengthened the bearish sentiment in the market, which is conducive to further decline of gold. In addition, gold has tested the area near 3260 many times, which has weakened the support strength of this area to a certain extent. Gold may fall below this area at any time and continue to the 3245-235 zone.
Trading strategy:
Consider shorting gold again with the 3315-3325 zone as resistance, and expect gold to fall below 3260 and continue to the 3245-3235 zone.

Short gold after the rebound!Fundamentals:
1. First, focus on Trump and the Fed’s dynamics;
2. Pay attention to whether geopolitical conflicts escalate, including the situation between India and Pakistan, Russia and Ukraine, and the situation between the United States and Iran, etc.
Technical aspects:
Although gold once rebounded from around 3267 under the circumstances of the ADP data being significantly positive, reversing the downward trend in the short term. However, the recent rebound high of gold only stopped at around 3330, and multiple top turning points were built in the 3320-3330 area, which greatly limited the height of gold’s rebound and further the bearish sentiment in the market. Therefore, I think the area around 3260 is not the low point of this round of decline. I think gold is very likely to continue to fall and continue to the 3240-3230 area, or even lower.
Trading strategy:
Consider shorting gold when it rebounds to the 3315-3325 area, and expect gold to fall below 3260 and completely open up the downward space!

XAUUSD Analysis todayHello traders, this is a complete multiple timeframe analysis of this pair. We see could find significant trading opportunities as per analysis upon price action confirmation we may take this trade. Smash the like button if you find value in this analysis and drop a comment if you have any questions or let me know which pair to cover in my next analysis.

Gold insights: 30-APRIL-2025Rise and shine, traders! Start your day with actionable Gold insights. Let's grow your skills together, one chart at a time.

(XAU/USD) 1H Chart: Long Setup Targeting 3,500 with Key Support Entry Point: Suggested near 3,301.51 USD (marked with the purple support zone).
Stop Loss Zone: Below 3,266.87 to 3,221.67 USD (marked in blue and purple). This is where you limit your loss if the trade goes wrong.
First Target (Target Point One): 3,376.65 USD.
Final Target (EA Target Point): 3,523.55 USD (~8.26% potential gain from entry).
Main Setup Idea:
The price is consolidating around the support zone.
There's a plan to buy (go long) at the purple zone (Entry Point) and aim for the two target points

Key intervals and trend judgmentKey range and trend judgment:
The current gold price is in a narrow range of 3300-3305 support zone and 3325-3330 pressure zone. Technical analysis:
1. Support logic:
- 3300 is an integer psychological barrier, which coincides with the MA60 moving average (dynamic support) of the 1-hour chart;
- After hitting the bottom of 3300 several times recently, it rebounded and formed a short-term bottom structure.
2. Pressure logic:
- 3330 is the upper rail resistance of the Bollinger band on the 4-hour chart, and it is the previous high-intensive trading area;
- The top divergence signal appears at the MACD daily level, suppressing the upward space.
3. Volume characteristics: Shrinking volume oscillation, need to wait for breakthrough and large volume to confirm the direction.
Trading strategy and operation plan
1. Buy low and sell high within the range (short-term)
Long position strategy:
Entry point: 3300-3305 range (price retracement does not break, and 1-hour chart RSI <30), try long with a light position. Take profit target: 3315 (first target), 3325 (second target) Stop loss 3292 (break through the previous low support).
Short position strategy:
Entry point: 3325-3330 range (price touches pressure and falls back, 15-minute chart MACD dead cross), try short with a light position, take profit target: 3310 (first target), 3300 (second target); Stop loss: 3338 (break through the previous high pressure).
2. Follow the trend after the breakthrough (trend following) Upward breakthrough (stabilizing 3330): Pursue long signal: the price breaks through 3330 with large volume and then falls back without breaking, the target is 3350-3360 (previous high of the daily line);
Stop loss: 3320 (below the breakthrough point).
Downward break (falling below 3300): Pursue short signal: the price falls below 3300 and the pullback confirmation is invalid, the target is 3280-3260 (weekly MA20 support); Stop loss: 3310 (above the break point).
Pattern interpretation:
- The 4-hour chart converges in a symmetrical triangle, and the theoretical target after the breakthrough is the height of the triangle ; If it breaks upward, the target is 3350; if it breaks downward, the target is 3270.
Volume coordination: When breaking through, the trading volume needs to be enlarged by more than 20%, otherwise be alert to false breakthroughs.
Gold is in the stage of oscillating and choosing direction in the short term, and the strategy is mainly to sell high and buy low within the range + follow the breakthrough.

GOLD ROUTE MAP UPDATEHey Everyone,
Another great day on the charts with our analysis playing out perfectly.
After completing our bearish target yesterday, we stated that we would now look for a test at 3344 to complete our Bullish target and then a cross and lock will open the level above or failure to lock above will follow with a rejection into the lower Goldturns.
- This played out perfectly. We got the 3344 target hit, as analysed, followed with no cross and lock above 3344 confirming the rejection into the lower Goldturns just like we stated.
3306 Goldturn provided the support and bounce and if this levels holds, we will see a retest above or a further cross and lock below will open the lower Goldturns.
We will keep the above in mind when taking buys from dips. Our updated levels and weighted levels will allow us to track the movement down and then catch bounces up.
We will continue to buy dips using our support levels taking 30 to 40 pips. As stated before each of our level structures give 20 to 40 pip bounces, which is enough for a nice entry and exit. If you back test the levels we shared every week for the past 24 months, you can see how effectively they were used to trade with or against short/mid term swings and trends.
The swing range give bigger bounces then our weighted levels that's the difference between weighted levels and swing ranges.
BULLISH TARGET
3344 - DONE
EMA5 CROSS AND LOCK ABOVE 3344 WILL OPEN THE FOLLOWING BULLISH TARGETS
3367
POTENTIALLY 3390
EMA5 CROSS AND LOCK ABOVE 3390 WILL OPEN THE FOLLOWING BULLISH TARGET
3428
EMA5 CROSS AND LOCK ABOVE 3428 WILL OPEN THE FOLLOWING BULLISH TARGET
3458
EMA5 CROSS AND LOCK ABOVE 3458 WILL OPEN THE FOLLOWING BULLISH TARGETS
3478
POTENTIALLY
3503
BEARISH TARGETS
3306 - DONE
EMA5 CROSS AND LOCK BELOW 3306 WILL OPEN THE RETRACEMENT RANGE
3285 - DONE
3259
EMA5 CROSS AND LOCK BELOW 3259 WILL OPEN THE SWING RNGE
3233
3201
EMA5 CROSS AND LOCK BELOW 3201 WILL OPEN THE SECONDARY SWING RANGE
SECONDARY SWING RANGE
3159 - 3112
As always, we will keep you all updated with regular updates throughout the week and how we manage the active ideas and setups. Thank you all for your likes, comments and follows, we really appreciate it!
Mr Gold
GoldViewFX

GOLD (XAUUSD): Market Outlook & Short Update
Regarding Gold.
I received multiple requests to provide the update after
the price bounced to a target level, as I predicted earlier on Sunday.
At the moment, we see a perfect example of a consolidation.
The price is trading within a horizontal parallel channel - range.
As always, the market will most likely continue staying within that till the release
of important high impact news.
The closest ones we can find in the economic calendar.
Tomorrow we are expecting US GDP and Personal Spending Data.
For now, probabilities will be high that a consolidation will continue.
Consider looking for trading opportunities from the boundaries of the range.
After a news release, a breakout of the range will provide a strong confirmation
and accurately indicate the future direction of the market.
❤️Please, support my work with like, thank you!❤️
I am part of Trade Nation's Influencer program and receive a monthly fee for using their TradingView charts in my analysis.

Doubletop suppressionVS multi-bottom support Entry at key pointsGold rose sharply in the U.S. market yesterday, and the daily line finally closed the Yang cross star, approaching the end of the monthly line. Recently, it has been a yin-yang cycle sweep pattern. Therefore, today we need to be careful to prevent the market from falling back and then closing in the negative range. The wide sweeping range remains at 3370-3270. If the position is broken, look at the unilateral direction. In the 4H cycle, the continuous positive pattern breaks through the mid-track, and the short-term trend is stronger. , but Bollinger has not opened his mouth, and is not optimistic about the breakthrough range. The short-term support is around 3315, which is also yesterday's low point. If it falls below, it will go to 3302. Therefore, today's operation will continue to grasp the key positions. The upper pressure will focus on 3354 and 3370, and the lower support will focus on 3315 and 3300. Go high and low in the range! Do high-altitude and low-multiple in the range!
Operation suggestion: Buy gold near 3305-3300, look at 3320 and 3345!

THE KOG REPORT THE KOG REPORT:
In last week’s KOG Report we said we would be looking for the price to continue upside into the region given which gave us a fantastic capture for the start of the week. We then had to adapt as the bias level and targets on the red box indi changed suggesting more upside. We continued to complete all our bias above targets as well as Excalibur and LiTE giving us 100% again for the week!
It wasn’t easy as it sounds, it took a lot of work and constant monitoring but the pip capture on gold was out of this world and well worth it!
So, what can we expect from the week ahead?
For this week we seem to be creating a DB on the 4hr chart which entails caution. We have resistance just above at the 3330-35 with extension 3240-45 region which if attacked and rejected in the early session could give the potential short trade into the support level 3295-8 which is the key level that needs to break for us to go lower.
There is a lot of liquidity above, especially those who like us shorted and held trades from the 3450 levels so the bias this week changes to the 3350-55 level, break above and we will confirm the move higher, otherwise, our thoughts are a test is likely on the high but we would like to get that long from lower to again create a new ATH.
Let’s see how we open, these markets need to be adapted to every day so making long terms plans as intra-day traders isn’t on our agenda at the moment. The market is giving short term, so why not take advantage of the conditions while they last.
Potential for gaps on open so please be careful, we’re on red boxes and extreme levels only.
RED BOXES INDI LEVELS:
Break above 3320 for 3327, 3330, 3335, 3345, 3347 and above that 3362 in extension of the move
Break below 3310, for 3306, 3297, 3295, 3280, 3266 and 3255 in extension of the move
Even the scalping levels are HUGE!
Please do support us by hitting the like button, leaving a comment, and giving us a follow. We’ve been doing this for a long time now providing traders with in-depth free analysis on Gold, so your likes and comments are very much appreciated.
As always, trade safe.
KOG

XAUUSD correcting to its 4H MA200.Gold (XAUUSD) has been trading within a Bullish Megaphone pattern since the start of the year. Last week's rejection on its top (Higher Highs trend-line) has resulted into a break below the 4H MA50 (blue trend-line).
This has technically been the signal that started the previous 2 Bearish Legs, which both bottomed upon touching the 4H MA200 (orange trend-line) and once the 4H RSI got oversold below 30.00.
As a result, we expect more downside, targeting 3160.
-------------------------------------------------------------------------------
** Please LIKE 👍, FOLLOW ✅, SHARE 🙌 and COMMENT ✍ if you enjoy this idea! Also share your ideas and charts in the comments section below! This is best way to keep it relevant, support us, keep the content here free and allow the idea to reach as many people as possible. **
-------------------------------------------------------------------------------
💸💸💸💸💸💸
👇 👇 👇 👇 👇 👇

XAUUSD Analysis today: Support break?Hello traders, this is a complete multiple timeframe analysis of this pair. We see could find significant trading opportunities as per analysis upon price action confirmation we may take this trade. Smash the like button if you find value in this analysis and drop a comment if you have any questions or let me know which pair to cover in my next analysis.

GOLD Price Analysis: Key Insights for Next Week Trading DecisionAfter testing a fresh record high around the $3,500 zone, gold made a sharp U-turn, erasing much of its gains and dropping toward the $3,260 support zone.
This reversal came as the US Dollar found fresh strength, following US President Trump’s major backtracking on tariffs against China and the dismissal of Fed Chair Powell.
Markets have since stayed volatile, swinging between "risk-on" and "risk-off" sentiment.
As we head into next week, gold price action is at a critical decision point, and it is unclear whether buyers or sellers will take control.
In this video, I break down the key technical zones, share my trading plan, and discuss potential opportunities to help navigate the uncertainty ahead.
Disclaimer:
This is my take based on experience and what I see on the charts. It’s not financial advice—always do your research and consult a licensed advisor before trading.
#GoldAnalysis #XAUUSD #ForexTrading #GoldForecast #TechnicalAnalysis #GoldPrice #TradingPlan #GoldVsDollar #WeekendMarketAnalysis

Actionable Gold insights: 28-APRIL-2025Rise and shine, traders! Start your day with actionable Gold insights. Let's grow your skills together, one chart at a time.

XAUUSD Analysis todayHello traders, this is a complete multiple timeframe analysis of this pair. We see could find significant trading opportunities as per analysis upon price action confirmation we may take this trade. Smash the like button if you find value in this analysis and drop a comment if you have any questions or let me know which pair to cover in my next analysis.

GOLD (XAUUSD): Very Bullish Setup
Gold closed on Friday in a strong bullish mood.
The price started to rise after a test of the underlined blue
support cluster.
A breakout of a resistance line of a falling channel on an hourly
provides a strong intraday confirmation.
I expect a rise at least to 3439
❤️Please, support my work with like, thank you!❤️
I am part of Trade Nation's Influencer program and receive a monthly fee for using their TradingView charts in my analysis.

GOLD LONG-TERM FORECAST UPDATEMonthly Chart: Gold is forming an internal high and low, indicating a potential reversal.
Weekly Chart: Inside bar formation, waiting for market sweep. Expecting a bullish move after sweep.
Daily Chart: CRT pattern confirmed, targeting lower levels. Our bullish area remains at $2580-
Stay tuned for further updates!

Gold’s ATH Rally Slowing Down – Needs Correction!!!Gold ( OANDA:XAUUSD ) has been on a strong uptrend in recent weeks , creating a new All-Time High(ATH) almost every day. Will a new ATH be created after $3,500 in the coming days? What do you think?
Gold is moving between the Resistance zone($3,386-$3,357) and Support zone($3,282-$3,245) .
In terms of Elliott Wave theory , it seems that Gold has started to form Corrective Waves after recording the latest ATH . Gold is completing a Zigzag Correction wave (ABC/5-3-5) ( most likely ).
I expect Gold to start declining again after approaching the Resistance zone($3,386-$3,357) and attack the Support lines and Support zone($3,282-$3,245) . It seems like Gold needs a correction , do you agree with me!? In the worst-case scenario for my analysis, Gold starts falling from the resistance zone($3,431-$3,406) .
Note: If Gold can move above $3,440, we can expect more pumps and maybe make na ew All-Time High(ATH).
Gold Analyze ( XAUUSD ), 1-hour time frame.
Be sure to follow the updated ideas.
Do not forget to put a Stop loss for your positions (For every position you want to open).
Please follow your strategy; this is just my idea, and I will gladly see your ideas in this post.
Please do not forget the ✅' like '✅ button 🙏😊 & Share it with your friends; thanks, and Trade safe.

XAU/USD: Bull or Bear? (READ THE CAPTION)By analyzing the gold chart on the 30-minute timeframe, we can see that yesterday, right after posting the analysis, the price quickly hit the first target at $3307, then experienced a bounce and rallied to the $3369 supply zone. From there, gold faced more downward pressure and eventually reached the targets at $3303, $3297, and nearly $3285.
Currently, gold is trading around $3291, and if $3285 is broken, we could expect further downside toward levels below $3259.
Please support me with your likes and comments to motivate me to share more analysis with you and share your opinion about the possible trend of this chart with me !
Best Regards , Arman Shaban
