XAUUSD SEEMS BEARISHAs we can see gold has created Descending triangle pattern which lead the gold in more bearish momentum.
Goldsignals

XAUUSD 4H Golden Cross preparing a massive break-out.Gold (XAUUSD) has been trading on a 3-week Channel Up, which is approaching its top but at the same time, it's been trading within a 3-month Triangle, which is also approaching its top.
The key here is the formation today of a Golden Cross on the 4H time-frame, the first since May 28. Being at the end of the long-term Triangle pattern is technically translated to the structure's tendency to look for a decisive break-out above its top that attracts volume (buyers).
It is possible to see an initial rejection followed by a break-out that will re-test the top of the Triangle as Support and then follow the long-term trend dynamics. Those are technically bullish and previous break-out in April targeted the 2.618 Fibonacci extension. Our Target remains a little below it at $3770.
-------------------------------------------------------------------------------
** Please LIKE 👍, FOLLOW ✅, SHARE 🙌 and COMMENT ✍ if you enjoy this idea! Also share your ideas and charts in the comments section below! This is best way to keep it relevant, support us, keep the content here free and allow the idea to reach as many people as possible. **
-------------------------------------------------------------------------------
Disclosure: I am part of Trade Nation's Influencer program and receive a monthly fee for using their TradingView charts in my analysis.
💸💸💸💸💸💸
👇 👇 👇 👇 👇 👇

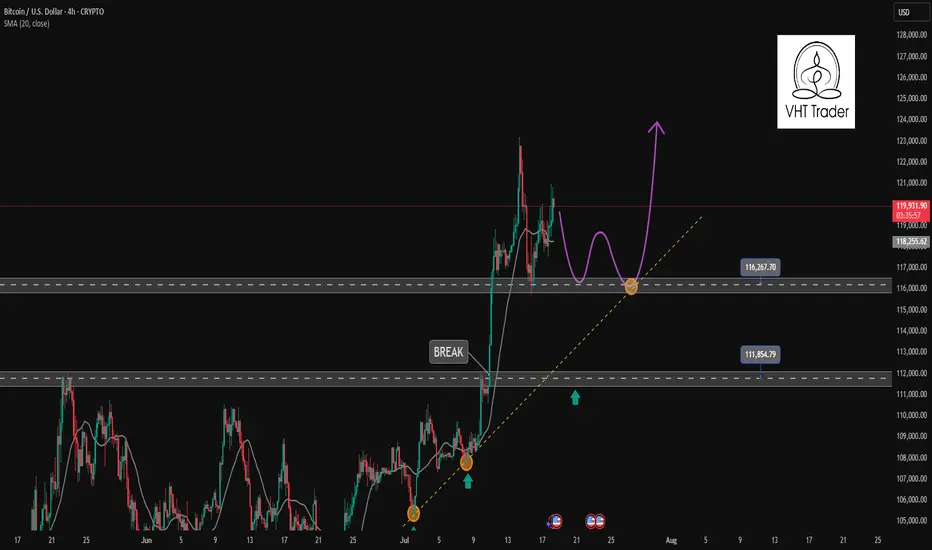
Find a recovery point to continue buying BTC✏️ CRYPTO:BTCUSD is trading near the all-time high. The trading strategy is to wait for some investors to take profit so that the price can return to the nearest support zones and continue to buy to the new all-time high zones.
📉 Key Levels
BUY Trigger: confirms the recovery from the support trend line 116000
BUY zone 112000 (Strong support zone)
Target 129000
Leave your comments on the idea. I am happy to read your views.
XAUUSD Analysis Today Hello traders, this is a complete multiple timeframe analysis of this pair. We see could find significant trading opportunities as per analysis upon price action confirmation we may take this trade. Smash the like button if you find value in this analysis and drop a comment if you have any questions or let me know which pair to cover in my next analysis.

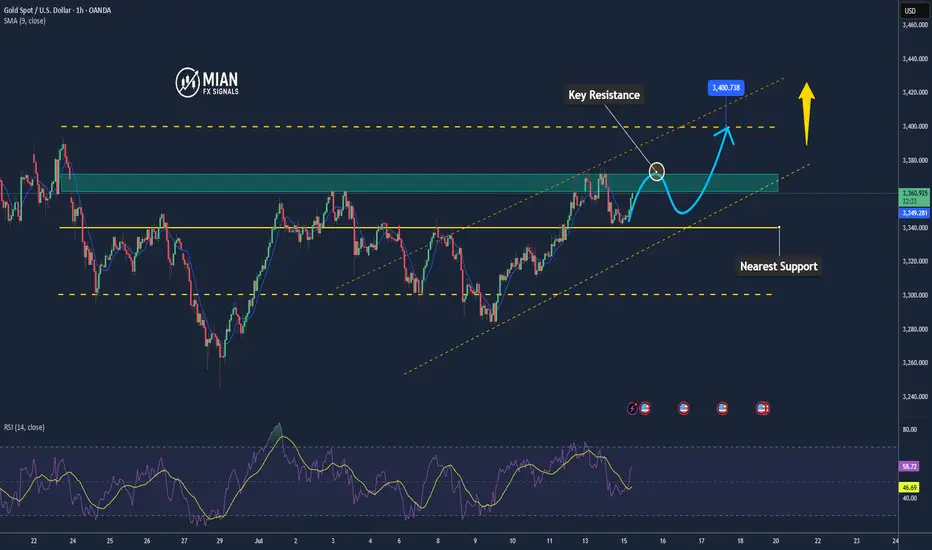
Gold Approaches New Resistance – Potential Short-Term Pullback📊 Market Update
Gold is currently trading around $3,368–$3,370/oz, up approximately 0.5% today, supported by a weaker USD and slightly declining US Treasury yields. This comes amid global trade concerns and expectations that the Fed may adjust policy in upcoming meetings.
📉 Technical Analysis
•Key Resistance: $3,375–$3,380 (pivot R2: $3,374.9, R3: $3,389.6)
•Nearest Support: $3,360 (S1: $3,335.8)
•EMA: Price is trading above the EMA9 / EMA20 / EMA50 / EMA200, confirming a strong uptrend
•Candlestick / Volume / Momentum:
o MACD & ADX still confirm strong bullish momentum
o Price consolidating in a rectangle range of $3,352–$3,366 → watch for breakout or rejection at resistance
📌 Outlook
Gold may pull back slightly if it fails to break through the $3,375–$3,380 resistance area and RSI continues hovering near overbought levels.
💡 Suggested Trade Strategy
🔻 SELL XAU/USD at: $3,375–$3,380
🎯 TP: 40/80/200 pips
❌ SL: $3,385
🔺 BUY XAU/USD at: $3,345–$3,348
🎯 TP: 40/80/200 pips
❌ SL: $3,339

Why do you always miss the most stable trading opportunities?The market is always moving forward in the game between long and short positions. Sometimes the market is strong and sometimes it is falling rapidly. We cannot control the market trend. The only thing we can do is to protect the principal and stay rational. When the market is unclear, it is better to decisively exit and wait and see than to blindly waste energy. Whether the market rises or falls is not the most important thing. What you really need to think about is how you will deal with it, how much profit you can get when you are right, and how much loss you can avoid when you are wrong. This is the fundamental of trading.Trading method: follow the trend, macro resonance, refuse to bet everything, and implement iron discipline. Welcome like-minded friends to exchange technology, methods and trading experience, write analysis honestly, and trade seriously. I just hope you can take fewer detours!
Review of this week's upward trend analysis: This week, we did very well in gold. From Monday to Friday, the daily analysis layout and entry position were very accurate, the trend was correct, and it was simple and easy to do. Gold showed an overall volatile upward trend, which was in line with my previous prediction: First, the decline of the US dollar supported the gold price. The weakening of the US dollar increased the purchasing power of non-US currency holders, pushed up the demand for gold, and precious metals strengthened across the board. Second, the rise in risk aversion was affected by uncertainties such as the US fiscal deficit, tariff policy, and the independence of the Federal Reserve. The market's risk aversion demand increased, and bullish sentiment continued to be released.
As for the gold trend next week, the gold price bottomed out and rebounded this week, with obvious characteristics of washing and consolidation. The trend structure further converged and waited for the direction to be chosen. The weekly line closed with a long lower shadow and a small negative line. The daily line alternated between positive and negative, running between the middle and upper rails of the Bollinger Bands, continuing the slow bull shock pattern. Next week, focus on the break of the 3377-3309 range. If it does not break, maintain the high-altitude and low-multiple ideas. If it breaks, follow the unilateral trend. The short-term pressure is concentrated in the 3360-3370 area. It rose to this position on Friday and then fell back, showing obvious pressure. The lower support focuses on the 3330 line. It has not broken through many downward explorations, which has key support significance and needs special attention. If 3330 is lost, the bears may take the initiative. If it holds on and does not break, the bulls still have the upward momentum. Breaking through 3375 will open up the trend of rising space. In terms of operation rhythm, the short-term support focuses on 3345-3335. The key pressure above pays attention to the vicinity of 3380. Under the premise of no news stimulation, the market will most likely maintain a shock range this month.

GOLD (XAUUSD): Sticking to the Plan
Update for my last Sunday's post for Gold.
Previously, we spotted a cup & handle pattern on a daily time frame.
It turned into an ascending triangle pattern - another bullish formation this week.
I am sticking to the same plan - our strong bullish signal is a breakout
of a neckline of the pattern and a daily candle close above 3378.
It will confirm a strong up movement.
❤️Please, support my work with like, thank you!❤️
I am part of Trade Nation's Influencer program and receive a monthly fee for using their TradingView charts in my analysis.

Gold. 14.07.2025. The plan for the next few days.The nearest resistance zones are where it's interesting to look for sales. It's not certain that there will be a big reversal, but I think we'll see a correction. We're waiting for a reaction and looking for an entry point.
The post will be adjusted based on any changes.
Don't forget to click on the Rocket! =)

Gold Maintains Bullish Tone – Eyes on $3,350 Breakout📊 Market Overview
• Gold is trading around $3,339 – $3,340, after rebounding from the session low at $3,332.
• The USD is temporarily weakening, and safe-haven flows remain steady — key factors supporting gold.
• Markets are awaiting fresh U.S. economic data for clearer directional cues.
📉 Technical Analysis
• Key Resistance Levels:
– Near-term: $3,344 – $3,345
– Extended: $3,352 – $3,356 (weekly highs)
• Key Support Levels:
– Near-term: $3,332 – $3,335
– Extended: $3,320 – $3,325 (MA confluence + technical base)
• EMA: Price remains above EMA 09, confirming a short-term uptrend.
• Candle Pattern / Volume / Momentum: RSI is around 54–56; momentum remains positive but has cooled — suggesting potential consolidation.
📌 Outlook
Gold is maintaining a bullish technical structure — if it breaks above $3,345, a move toward $3,352 – $3,356 is likely. On the downside, a drop below $3,332 could trigger a retest of $3,325 – $3,320.
💡 Suggested Trading Strategy
🔺 BUY XAU/USD: $3,324 – $3,327
• 🎯 TP: 40/80/100 pips
• ❌ SL: $3,320
🔻 SELL XAU/USD :$3,352 – $3,355
• 🎯 TP: 40/80/100 pips
• ❌ SL: $3,359

Double Top + Zigzag Complete: Are Bears About to Take Over Gold?Yesterday, the financial markets in general, including Gold ( OANDA:XAUUSD ) , acted like a roller coaster after the news of Powell's dismissal . After this news was denied , Gold returned to its main trend, which I published in my previous idea .
Gold is currently re-attacking the Support line , Support zone($3,326-$3,325) and 50_SMA(Daily) .
In terms of classic technical analysis , it seems that gold has formed a Double Top Pattern for support breakdowns, where a Support line breakdown can also be accompanied by a neckline breakdown .
From the perspective of Elliott Wave theory , it seems that Gold has managed to complete the Zigzag Correction(ABC/5-3-5) , and we should wait for the next bearish waves .
I expect Gold to break its supports and move towards $3,290 ; support breaks are best done with high momentum . An important price that can change the direction of Gold's downside is $3,350 .
Note: If Gold breaks the Resistance lines and forms an hourly candle above $3,351(Stop Loss (SL)), we can expect further Gold gains.
Gold Analyze (XAUUSD), 2-hour time frame.
Be sure to follow the updated ideas.
Do not forget to put a Stop loss for your positions (For every position you want to open).
Please follow your strategy; this is just my idea, and I will gladly see your ideas in this post.
Please do not forget the ✅ ' like ' ✅ button 🙏😊 & Share it with your friends; thanks, and Trade safe.

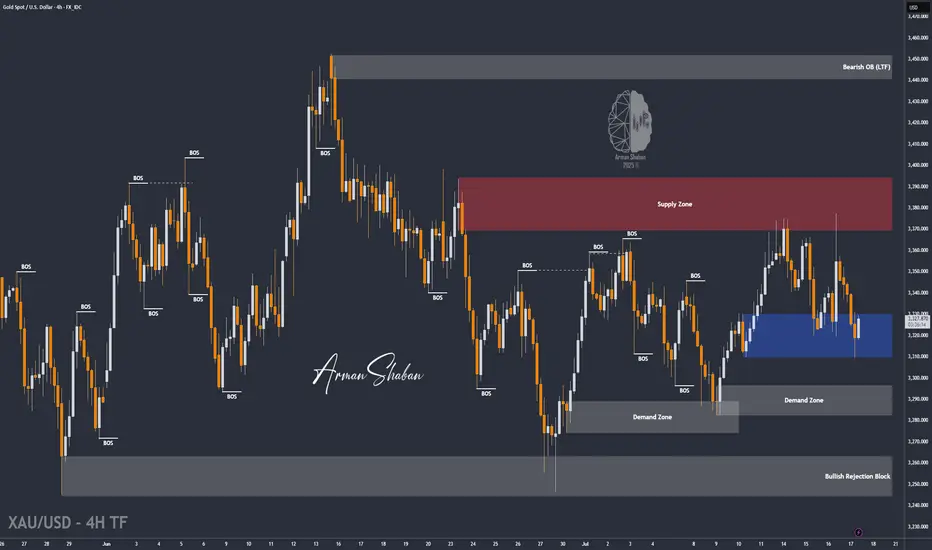
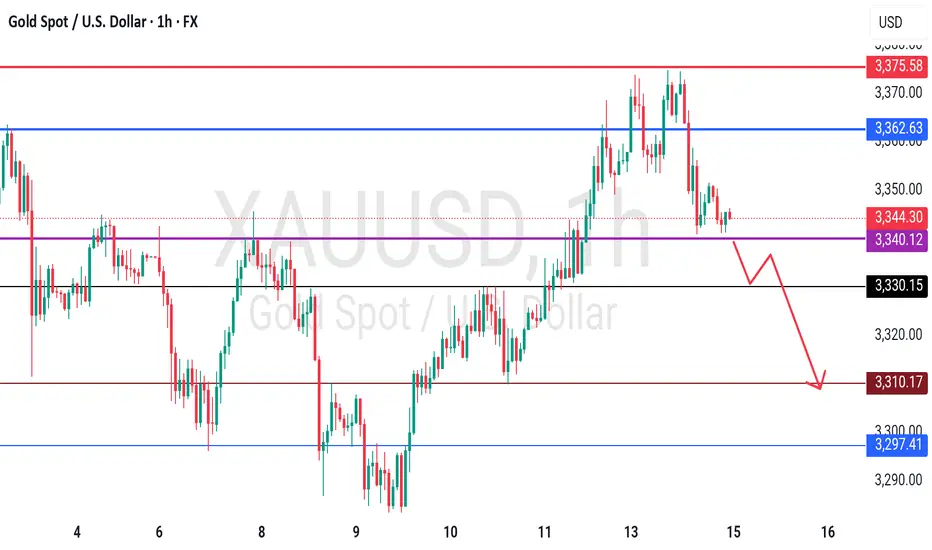
XAU/USD | First LONG to $3345, Then a Potential DROP Below $3300By analyzing the gold chart on the 4-hour timeframe, we can see that last night the price first tapped into the $3340 level, showing an initial push up to $3352. However, the drop intensified soon after, breaking the $3340 resistance and, according to the second scenario, falling to $3310. Upon reaching this key demand level, buying pressure kicked in, pushing the price back up to $3325. Now, the key question is whether gold can hold the $3310 support. If this level holds, we can expect a rise toward $3331 as the first target and $3345 as the second. After this move, a rejection from the $3345 area could trigger another drop, possibly pushing gold below $3300. So, first LONG, then SHORT!
THE LATEST VIDEO ANALYSIS :
Please support me with your likes and comments to motivate me to share more analysis with you and share your opinion about the possible trend of this chart with me !
Best Regards , Arman Shaban
TradeIdea – Gold (XAUUSD)Looks like a bullish breakout is brewing!
✅ Price has broken out of the descending channel
✅ Retested the global trendline support
✅ Reclaimed the 200-day moving average (MA200)
✅ Momentum indicator surged above the 100 mark
✅ Visible imbalance zone above — potential target area
📌 If price consolidates above $3350, consider a long setup:
🎯 Target 1: $3370
🎯 Target 2: $3375
🧠 Watch for confirmation before entry — structure and momentum alignment is key.

Gold Surges Late Session – Targeting $3,345+📊 Market Overview:
• Gold has just broken higher to $3,339, extending its bullish move after clearing the $3,335 resistance zone.
• Market sentiment remains supportive as the USD weakens and U.S. bond yields stabilize, while the Fed still shows no signs of cutting rates soon.
📉 Technical Analysis:
• Next resistance: $3,345 – $3,350
• Nearest support: $3,335 – $3,336
• EMA 09: Price remains above EMA 09 → confirms short-term uptrend
• Momentum: RSI stays bullish, and price continues to follow breakout momentum from the recent consolidation zone
📌 Outlook:
Gold is holding its bullish structure — if it stays above $3,335, a move toward $3,345–$3,350 is likely during the Asian session.
💡 Suggested Trading Strategy
🔺 BUY XAU/USD at: 3,336 – 3,338
🎯 TP: 3,350
❌ SL: 3,330

3340-3300: Lock in the buy high and sell low in this area!Under the influence of unemployment benefits and zero monthly sales data, gold fell sharply in the short term, but it did not effectively fall below 3310 during multiple tests, effectively curbing the further downward space of the shorts. Multiple structural supports are also concentrated in the 3310-3300 area, so as long as gold does not fall below this area, gold bulls still have the potential to rebound.
However, for the current gold market, it may be difficult to see a unilateral trend in the short term. After experiencing discontinuous surges and plunges, gold may focus on consolidation and repair, and the consolidation range may be limited to the 3340-3300 area.
So for short-term trading, first of all, I advocate going long on gold in the 3320-3310 area, and expect gold to rebound and reach the 3330-3340 area;
If gold reaches the 3335-3345 area as expected, we can start to consider shorting gold, and expect gold to step back to the 3320-3310 area during the shock and rectification process.
Gold Continues Short Term Uptrend📊 Market Overview:
💬Gold is currently trading around $3,340 – $3,352/oz, down slightly (~0.25%) on the day but still consolidating near recent highs around $3,500.
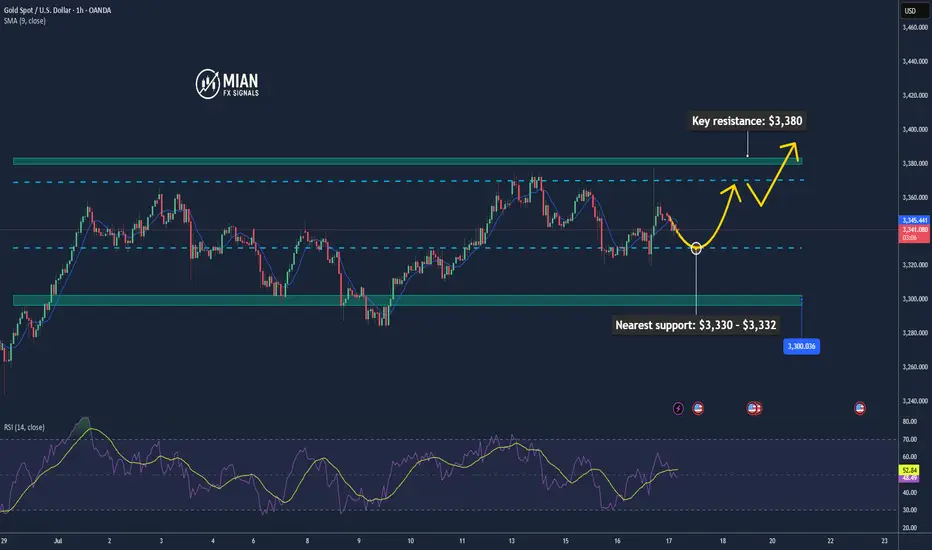
🌍 Geopolitical tensions (trade wars, Middle East conflicts) and strong central bank gold purchases continue to support long-term demand.
📅Markets are awaiting key U.S. inflation data and Fed signals, which may trigger volatility in the short term.
📉 Technical Analysis:
🔺Key resistance: $3,360 – $3,380, with the psychological zone at $3,400–$3,420.
🔻Nearest support: $3,330 – $3,332, followed by a firmer zone at $3,300–$3,326 (based on Fibonacci and moving averages).
• EMA/MA:
✅ Price is trading above the 50-day MA ($2,862), confirming a medium-term uptrend.
⚠️ While no specific EMA 09 data is noted, current price action suggests bullish momentum.
• Momentum / Candlestick / Volume:
📏RSI (14) is near 50–55, signaling positive momentum without being overbought.
🔄MACD is slightly negative but the overall structure remains bullish.
📌 Outlook:
Gold may continue to rise in the short term if it holds above the $3,330–$3,332 support zone, with potential to test resistance at $3,360–$3,380 and possibly revisit the $3,400 level.
A break below $3,330 could open the path toward deeper support around $3,300.
💡 Suggested Trading Strategy:
SELL XAU/USD: 3,367–3,370
🎯 TP: 40/80/200 pips
❌ SL: 3,374
BUY XAU/USD: 3,330–3,333
🎯 TP: 40/80/200 pips
❌ SL: 3,326
GOLD - Its Breakout? Short now??#GOLD.. perfect move as per our analysis, and now market just break hit current supporting area that was actually 3328
so keep close it and if market stay below that then we can expect a further drop towards our next supporting areas.
good luck
trade wisely
XAUUSD Analysis todayHello traders, this is a complete multiple timeframe analysis of this pair. We see could find significant trading opportunities as per analysis upon price action confirmation we may take this trade. Smash the like button if you find value in this analysis and drop a comment if you have any questions or let me know which pair to cover in my next analysis.

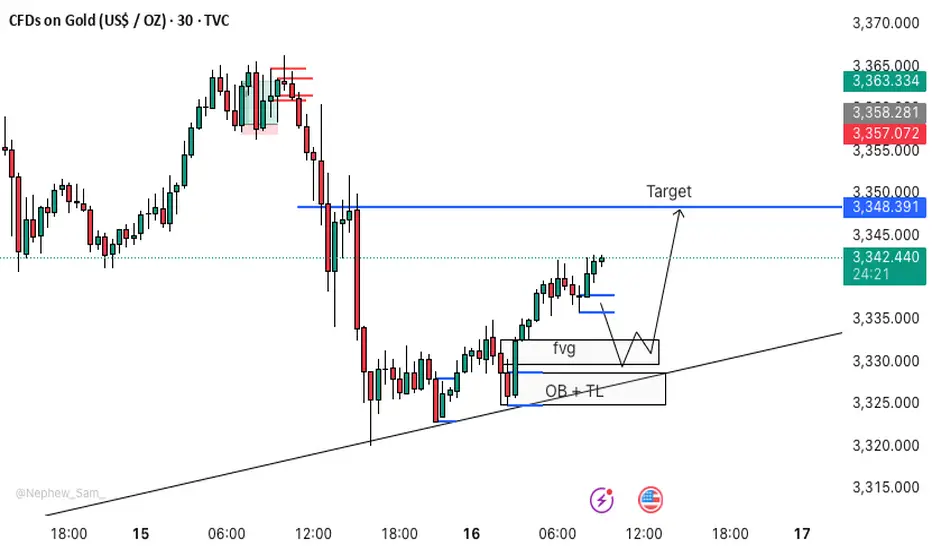
XAUUSD M30 BEST BUYING SETUP FOR TODAY📈 GOLD TRADING SCENARIO 🪙
Gold is currently in bullish momentum, making this the perfect buying zone. ✅
🟨 Buy Zone: 3332 – 3327
We have three strong confirmations in this zone:
🔹 FVG (Fair Value Gap)
🔹 OB (Order Block)
🔹 TL (Trendline)
This is a valid entry point for gold. 📌
🔔 Action: If price reaches the 3332–3327 zone, buy gold and wait patiently for the move to play out. 🧘♂️
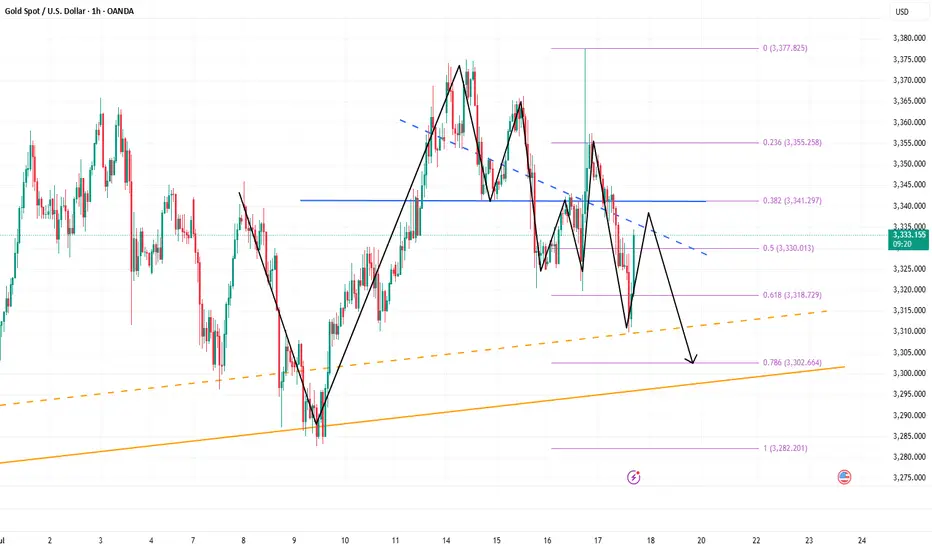
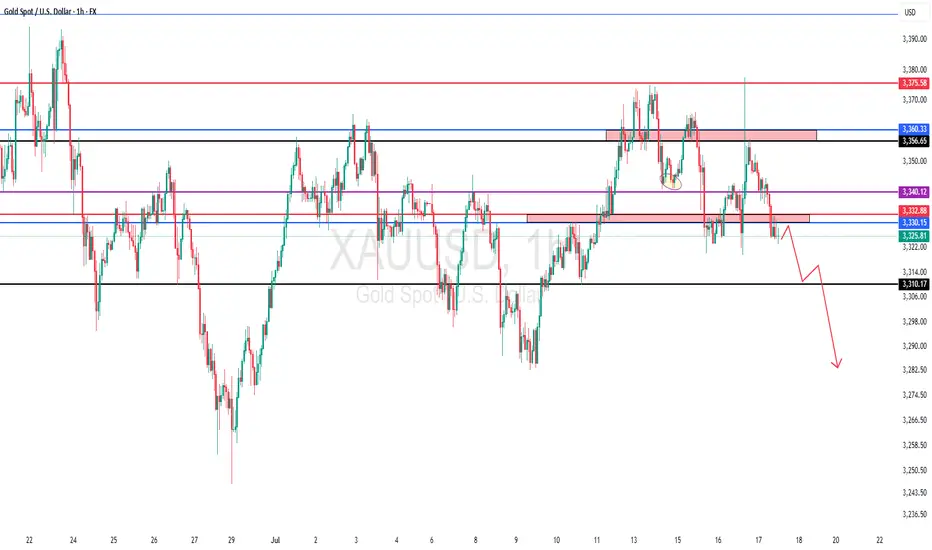
Gold Roadmap: Next Stop $3,325 After Ascending Channel Break?Gold ( OANDA:XAUUSD ) failed to touch the Potential Reversal Zone(PRZ) in the previous idea , and I took the position at $3,351 = Risk-free.
Gold is moving in the Resistance zone($3,366-$3,394) and has managed to break the lower line of the ascending channel .
In terms of Elliott Wave theory , with the break of the lower line of the ascending channel, it seems that gold has completed the Zigzag correction(ABC/5-3-5) .
I expect Gold to trend downward in the coming hours and succeed in breaking the Support zone($3,350-$3,325) and attacking the Support line again , and probably succeeding in breaking this line this time.
Note: Stop Loss (SL) = $3,396
Gold Analyze (XAUUSD), 1-hour time frame.
Be sure to follow the updated ideas.
Do not forget to put a Stop loss for your positions (For every position you want to open).
Please follow your strategy; this is just my idea, and I will gladly see your ideas in this post.
Please do not forget the ✅ ' like ' ✅ button 🙏😊 & Share it with your friends; thanks, and Trade safe.

Gold Holds Key Support Zone📊 Market Summary
– Gold is currently trading at $3,338/oz, hovering near a key technical support level.
– US Treasury yields remain elevated and the USD is strong, both pressuring gold; however, ongoing concerns over US–EU/Mexico trade tensions continue to support safe-haven demand.
– The market is awaiting the upcoming US PPI data to determine the next directional move.
📉 Technical Analysis
• Key Resistance: $3,372 – $3,375 (23.6% Fibonacci zone – short-term ceiling)
• Nearest Support: $3,338 – $3,330 (tested and bounced at 3,338 per Oanda); deeper support at $3,325 – $3,320 if broken
• EMA 9: Price is below the MA20/50/100 but above MA200 (H1); EMA9 is flat, suggesting a sideways/consolidation trend
• Momentum / Indicators:
• RSI around 44–52 – neutral to slightly bullish
• MACD slightly positive; Stochastic above 50, hinting at short-term overbought conditions
📌 Outlook
– Gold is holding above the 3,338–3,330 support zone. If this level holds and rate-cut expectations strengthen, the price may rebound toward 3,372–3,375.
– However, if the USD continues to strengthen and PPI/CPI data surprises to the upside, gold could break support and head lower toward 3,325–3,320.
💡 Trade Strategy Proposal
🟣 SELL XAU/USD at 3,372 – 3,375
🎯 TP: ~ 40 / 80 / 200 pips
❌ SL: ~ 3,378
🟢 BUY XAU/USD at 3,330 – 3,333
🎯 TP: ~ 40 / 80 / 200 pips
❌ SL: ~ 3,327

Treat intraday fluctuations as long first and short later!Gold started to rebound near 3322 at the opening. Our long positions near 3324 are also in floating profit. We first focus on the short-term suppression of 3340-3345 on the upper side. The support below is at 3325-3320. We operate in this range. Technically, it needs to rebound and repair the demand when it falls back to 3320, so we can find opportunities to go long to grasp the profit space of the rebound.
4-hour cycle analysis: The strong dividing line of long positions below is at the 3320 first-line mark, and the short-term support focuses on the 3325-3320 range. The overall bullish rhythm of pulling back to lows and going long is maintained. Short-term pressure focuses on around 3340-3345. The overall main tone of participating in the high-altitude and low-multiple cycles remains unchanged relying on this range.
Gold operation strategy: Go long on gold when it falls back to around 3325-3320, target 3335-3340, and continue to hold if it breaks through.

GOLD - CUT n REVERSE area, what's next??#GOLD ... perfect move as per our video analysis and now market just reached at his today most expensive area, that is 3340-41
Keep close that area and only holding of that area can lead us towards further bounce otherwise not.
So keep in mind we should didn't holda our longs below 3340-41
And obviously we will go for cut n reverse below 3340-41 in confirmation.
Good luck
Trade wisely
Gold Likely to Extend Gains as USD Weakens, but Faces Resistance📊 Market Move:
Gold surged to a three-week high near $3,370/oz, driven by safe-haven demand amid renewed trade tensions between the U.S. and EU/Mexico and threats of a 100% tariff on Russian imports.
Investors are now focused on upcoming U.S. CPI data, which could trigger sharp moves if inflation comes in below expectations.
📉 Technical Analysis:
• Key Resistance: ~$3,365–$3,372; a breakout could open the way to $3,400–$3,440
• Nearest Support: ~$3,340 (S1), then ~$3,326 (SMA50), and deeper at $3,300–$3,320 (Fibonacci zone)
• EMA: Price remains above short-term EMAs (20/50/100), suggesting a continuing bullish bias
• Candlesticks / Volume / Momentum:
• RSI is neutral-to-bullish around 54; MACD shows strengthening bullish momentum
• Bollinger Bands are narrowing, signaling potential for a breakout
📌 Outlook:
Gold may continue edging higher or consolidate around the $3,365–$3,372 resistance zone if no new geopolitical shocks occur. However, if U.S. CPI comes in below expectations or if USD/Yields weaken, gold could rally further toward $3,400–$3,440.
________________________________________
💡 Suggested Trading Strategy
🔻 SELL XAU/USD at: $3,370–3,373
🎯 TP: 40/80/200 pips
❌ SL: $3,376
🔺 BUY XAU/USD at: $3,340–3,337
🎯 TP: 40/80/200 pips
❌ SL: $3,334