XAUUSD Analysis todayHello traders, this is a complete multiple timeframe analysis of this pair. We see could find significant trading opportunities as per analysis upon price action confirmation we may take this trade. Smash the like button if you find value in this analysis and drop a comment if you have any questions or let me know which pair to cover in my next analysis.
Goldsignals

XAUUSD Analysis todayHello traders, this is a complete multiple timeframe analysis of this pair. We see could find significant trading opportunities as per analysis upon price action confirmation we may take this trade. Smash the like button if you find value in this analysis and drop a comment if you have any questions or let me know which pair to cover in my next analysis.

Gold trading insights: 26-MAR-2025Gold trading insights: Not signals, but informative zones to aid your decision-making. Please note: These zones are not trading advice. Use them as a starting point for your own analysis.

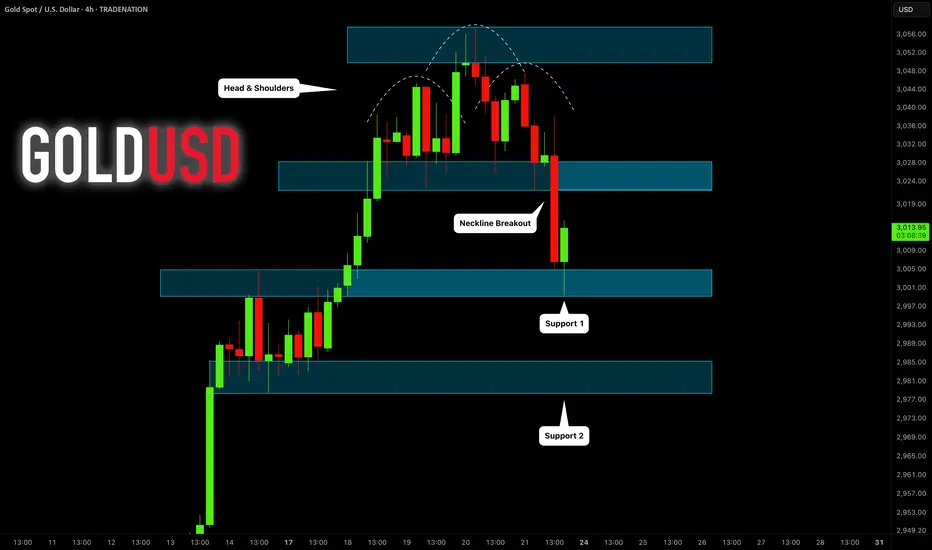
Gold’s Bearish Setup – What’s Next for $XAUUSD?Gold ( OANDA:XAUUSD ) fell to $3,003 as I expected in my previous post . Of course, since this is a round number , we can expect good support .
In terms of Classic Technical Analysis , Gold appears to have succeeded in breaking the neckline of the two patterns , the Head and Shoulders Pattern and the Three Falling Peaks Pattern .
Educational Note : The Three Falling Peaks is a bearish reversal pattern that occurs after an uptrend, where the price forms three consecutive lower peaks. Each peak represents a failed attempt to continue the uptrend, signaling weakening bullish momentum. A breakdown below the support confirms the pattern and signals a potential downtrend.
In terms of Elliott Wave theory , it seems that Gold has completed 5 impulsive waves and we should wait for corrective waves .
I expect Gold to attack the $3,000 at least once more after completing the pullback , and the next target could be the Support zone($2,989-$2,976) .
Note: If Gold goes above $3,039, we should expect more pumps.
Gold Analyze ( XAUUSD ), 1-hour time frame.
Be sure to follow the updated ideas.
Do not forget to put a Stop loss for your positions (For every position you want to open).
Please follow your strategy; this is just my idea, and I will gladly see your ideas in this post.
Please do not forget the ✅' like '✅ button 🙏😊 & Share it with your friends; thanks, and Trade safe.

Gold (XAU/USD) Bearish Setup – Potential Drop to $2,991This is a trading setup for Gold (XAU/USD) on the 30-minute timeframe, showing a potential bearish move.
Analysis:
Key Indicators:
200 EMA (blue line) at 3,019.55: Acting as a resistance level.
30 EMA (red line) at 3,017.45: Providing short-term trend guidance.
Price Action & Structure:
The price previously rejected from a resistance zone (purple area) and started forming lower highs.
Repeated bearish patterns suggest another potential drop.
The chart highlights measured moves of previous declines (-30.62, -24.75), indicating a possible repeat of the pattern.
Trade Setup:
Bearish Outlook: Price is expected to drop towards the target point at 2,991.43.
Entry: Near the break of the lower trendline in the ascending wedge.
Target: 2,991.43 (marked as "TARGET POINT").
Risk Management: Ensure proper stop-loss placement above recent highs.
Conclusion:
If price respects the pattern, a downward move is likely.
A confirmed break below support could accelerate the drop.

XAU/USD: First Long, Then SHORT! (PLEASE READ THE CAPTION)Gold's 2-hour chart shows that the price successfully reached a new high of $3057 today before retracing to $3025. Currently, gold is trading around $3037, and I expect a short-term push towards $3049 before looking for a trigger to potentially ride a correction down to targets below $3022. Stay tuned—this analysis will be updated soon!
Please support me with your likes and comments to motivate me to share more analysis with you and share your opinion about the possible trend of this chart with me !
Best Regards , Arman Shaban

XAUUSD Analysis todayHello traders, this is a complete multiple timeframe analysis of this pair. We see could find significant trading opportunities as per analysis upon price action confirmation we may take this trade. Smash the like button if you find value in this analysis and drop a comment if you have any questions or let me know which pair to cover in my next analysis.

"XAU/USD (Gold) Potential Reversal Setup — Bullish Recovery or FAlright! Let's break down the chart analysis for XAU/USD (Gold vs. USD) 📊💛:
Structure & Trend:
The market is in a corrective phase after a clear downtrend. The trendline break shows potential bullish momentum.
Zone Analysis:
The gray box represents a supply zone (strong resistance). Price may struggle to break above this area.
The target points (TP1 and TP2) are likely support levels where price might react if it drops.
Trade Setup:
The blue box indicates the potential buy zone with a stop loss slightly below it.
The stop loss is set around 3,030.71 - 3,031.00, aiming to minimize risk.
TP1: 3,014.58 — Short-term target.
TP2: 3,005.69 — A more conservative, safer target.
Bias:
The bullish arrow suggests a possible move upward if the price can maintain above the current support.
📌 Conclusion:
If you plan to buy, wait for a strong bullish confirmation (like a bullish engulfing candle) before entering.
If price breaks the stop loss level, a deeper drop may occur toward 2,993.55 - 2,993.21.

XAU/USD: Bullish Momentum Holds with Breakout PotentialXAU/USD closed its third straight bullish week, with price testing Tuesday’s low before rebounding and closing near the 50% mark of the weekly range. Despite a brief dip, the candle closed above last week’s high, showing continued strength. A breakout above the 3,000 level raises the potential for further gains, especially if the market opens with a gap up.
On the daily timeframe, Friday's candle recovered after early weakness, resembling a previous pullback seen earlier this month. With a 1.90% retracement, the structure suggests possible upward continuation. The market is currently moving sideways within Friday’s range, hovering around the 3,030 key level.
While high-impact news could cause volatility, any pullback toward the 3,000 support zone—aligned with the trendline and previous week’s high—may offer buying opportunities. A breakout from the inside bar pattern forming on the daily chart could target the 3075 resistance zone

Gold trading zones: 25-MAR-2025Good morning! Find today's Gold trading zones and enhance your market analysis.

XAU/USD(20250325) Today's AnalysisToday's buying and selling boundaries:
3015
Support and resistance levels:
3046
3034
3027
3004
2996
2985
Trading strategy:
If the price breaks through 3015, consider buying, the first target price is 3027
If the price breaks through 3004, consider selling, the first target price is 2996

THE KOG REPORT THE KOG REPORT:
In last week’s KOG Report we said we would anticipate a potential curveball and that being that price may just support on the open at the immediate support level and give the move upside into the 3010 and above that 3020 region which was achieved. We then updated traders with the FOMC report suggesting a further move upside into the 3050-55 region which is where we suggested the potential short will come from.
After the push up into the level and then some accumulation, Friday gave us the volume we needed to break away from the range and complete the move downside to end the week.
Again, nearly all of our bias level targets were completed, the bias level worked well, Excalibur performed well and the red box indi’s worked a dream, even in the choppy market conditions.
So, what can we expect in the week ahead?
We have an issue with gold at the moment, although it’s broken the immediate range, it’s still above 3000 with a larger range low around the 2990 and below that 2970-75 region. That potential swing point below is an area of interest for us this week and leading up towards the end of the month. For that reason, if we can support at the first red box below, and continue the move that started on Friday up into those 3025, 3030 and above that 3035-7 price points we’ll want to monitor this careful for a reversal to form. If we can get it, an opportunity to add or take the short may be available to traders, this time in attempt to break below the 3000 level into those lower support level mentioned and shown on the chart, which also correspond with the red boxes. As many of you have seen over the last year or so, we’ve been sharing these indicator boxes on the 4H for the wider community for free, as they are extremely powerful in identifying turning points and entry and exit points for traders. So let’s keep an eye on them this week for the break and closes, RIP’s and rejections.
We’re mostly looking for this one move to complete, however, there has to be a flip! This week, the flip is breaking above that 3035-37 level which will also be this week’s bias level. If we do breach, we’ll be looking at this to then continue higher, breaking 3050 and then resuming the move into the active Excalibur targets above which ideally, we don't want to see happen yet!
So, we know we want higher, what we do want though is better entry levels for the longs, until then, if we can capture these short trades we’ll of course gratefully take them.
KOG’s bias for the week:
Bearish below 3040 with targets below 3010, 3006, 2997, 2985 and below that 2978
Bullish on break of 3040 with targets above 3050, 3055, 3063 and above that 3067
RED BOXES:
Break above 3037 for 3040, 3047, 3050, 3055, 3063 and 3066 in extension of the move
Break below 3010 for 3006, 3000, 2997, 2990 and 2985 in extension of the move
This should give you an idea of your levels, please use them!
Please do support us by hitting the like button, leaving a comment, and giving us a follow. We’ve been doing this for a long time now providing traders with in-depth free analysis on Gold, so your likes and comments are very much appreciated.
As always, trade safe.
KOG

XAUUSD Analysis todayHello traders, this is a complete multiple timeframe analysis of this pair. We see could find significant trading opportunities as per analysis upon price action confirmation we may take this trade. Smash the like button if you find value in this analysis and drop a comment if you have any questions or let me know which pair to cover in my next analysis.

XAUUSD The 4H MA50 makes all the difference.Gold (XAUUSD) is so far maintaining its long-term bullish trend and will continues to do so even on the short-term, as long as it holds the 4H MA50 (blue trend-line). There are three different Channel Up patterns involved and as long as the 4H MA50 holds, the (dotted) short-term Channel targets 3080 at least.
If the price breaks below the 4H MA50 and the dotted Channel Up, it would be best to close any buys and short instead, targeting the 4H MA200 (orange trend-line) at 2960. It has to be said that every time the 4H RSI traded downwards as it has since Wednesday, a stronger pull-back to the bottom of the long-term Channel Up took place, so that has to favor 2960.
-------------------------------------------------------------------------------
** Please LIKE 👍, FOLLOW ✅, SHARE 🙌 and COMMENT ✍ if you enjoy this idea! Also share your ideas and charts in the comments section below! This is best way to keep it relevant, support us, keep the content here free and allow the idea to reach as many people as possible. **
-------------------------------------------------------------------------------
Disclosure: I am part of Trade Nation's Influencer program and receive a monthly fee for using their TradingView charts in my analysis.
💸💸💸💸💸💸
👇 👇 👇 👇 👇 👇

Potential Gold price decline in the coming weekHello traders,
Gold experienced a significant decline during the last two days of the previous trading week. On Friday, we saw a break below the 3022 level, which led to a shift in market sentiment. While the long-term bullish momentum remains intact, the current price action suggests a strong pullback may be underway, potentially continuing into the coming week.
We should closely monitor the 3028 level for a potential selling opportunity, with the first target set at last week's low of 2999, and an extended target around 2966.
However, if Gold reclaims 3040, we may see bullish momentum resume, given the ongoing geopolitical tensions and risk-off sentiment, which means we need to be very careful and stick to a trading plan.
How do you plan to trade Gold this week? Share your thoughts in the comments!
If you found this analysis helpful, please support it with a boost. Make sure to follow to receive new updates.

XAUUSD Top-down analysis Hello traders, this is a complete multiple timeframe analysis of this pair. We see could find significant trading opportunities as per analysis upon price action confirmation we may take this trade. Smash the like button if you find value in this analysis and drop a comment if you have any questions or let me know which pair to cover in my next analysis.

GOLD (XAUUSD): Support & Resistance Analysis For Next Week
Here is my latest support & resistance analysis
for Gold for next week.
Consider these structures for pullback/breakout trading.
❤️Please, support my work with like, thank you!❤️
I am part of Trade Nation's Influencer program and receive a monthly fee for using their TradingView charts in my analysis.

Gold’s Uptrend Strong, But Is a Short-Term Drop Coming?Gold ( OANDA:XAUUSD ) has increased by more than +5% over the past seven days and has managed to create new All-Time High(ATH) daily. The reasons for the increase in Gold prices include US economic statistics and the tensions in the Middle East that have increased these days.
The question is how long this bullish trend in Gold will continue. It seems that Gold needs at least a correction to continue its upward trend and I tried to find the starting zone of the correction with technical analysis tools (for the short term ).
Gold is moving near the Potential Reversal Zone(PRZ) , this zone could be a correction zone for Gold for at least the short term .
Gold also responds well to the Pitchfork tool lines , the Pitchfork lines can be considered as support and resistance lines for gold .
From an Elliott Wave theory perspective, Gold appears to be completing microwave 5 of main wave 5 (these five waves are likely to be part of main wave 3 ).
Also, we can see the Regular Divergence(RD-) between Consecutive Peaks .
I expect Gold to drop to at least $3,003 after breaking the Uptrend line , and my second target is $2,986 .
Note: The worst Stop Loss(SL) for your Short position could be $3,061.
Gold Analyze ( XAUUSD ), 2-hour time frame.
Be sure to follow the updated ideas.
Do not forget to put a Stop loss for your positions (For every position you want to open).
Please follow your strategy; this is just my idea, and I will gladly see your ideas in this post.
Please do not forget the ✅' like '✅ button 🙏😊 & Share it with your friends; thanks, and Trade safe.

GOLD (XAUUSD): Selling Now is HIGH RISK
The head & shoulders pattern that I spotted earlier
perfectly played out and we saw a strong bearish move after the
NY session opening.
HOWEVER, be extremely careful.
Many traders started to sell heavily, anticipating an extended bearish reversal.
For now the price nicely respected 3000 psychological support
that previously was a resistance.
I suggest not placing any short trades this week.
Let's wait till Monday and how the market opens.
❤️Please, support my work with like, thank you!❤️
I am part of Trade Nation's Influencer program and receive a monthly fee for using their TradingView charts in my analysis.
XAUUSD Analysis todayHello traders, this is a complete multiple timeframe analysis of this pair. We see could find significant trading opportunities as per analysis upon price action confirmation we may take this trade. Smash the like button if you find value in this analysis and drop a comment if you have any questions or let me know which pair to cover in my next analysis.

Gold trading zones: 21-MAR-2025Good morning! Find today's Gold trading zones and enhance your market analysis.

3074 ! Next price zone, gold ATH reached⭐️GOLDEN INFORMATION:
Gold prices (XAU/USD) continue their consolidation phase into the European session on Thursday, as traders exercise caution amid slightly overbought conditions. Additionally, a prevailing risk-on sentiment limits the metal’s intraday advance to a new record high. However, downside risks remain contained due to lingering uncertainty surrounding US President Donald Trump’s aggressive trade policies and their potential ramifications for the global economic outlook.
⭐️Personal comments NOVA:
Bulls continue their excitement, pushing prices higher, amid global trade tensions.
⭐️SET UP GOLD PRICE:
🔥SELL GOLD zone: $3062 - $3064 SL $3067 scalping
TP1: $3058
TP2: $3050
TP3: $3040
🔥SELL GOLD zone: $3073 - $3075 SL $3080
TP1: $3065
TP2: $3050
TP3: $3040
🔥BUY GOLD zone: $3003 - $3001 SL $2996
TP1: $3009
TP2: $3015
TP3: $3023
⭐️Technical analysis:
Based on technical indicators EMA 34, EMA89 and support resistance areas to set up a reasonable BUY order.
⭐️NOTE:
Note: Nova wishes traders to manage their capital well
- take the number of lots that match your capital
- Takeprofit equal to 4-6% of capital account
- Stoplose equal to 2-3% of capital account

MarketBreakdown | GOLD, GBPUSD, DOLLAR INDEX, EURAUD
Here are the updates & outlook for multiple instruments in my watch list.
1️⃣ #GOLD XAUUSD 1H time frame 🥇
Earlier on Sunday, I shared a completed head & shoulders pattern on Gold.
Its neckline was respected and the price bounced from that, setting a new historic high.
That same neckline is now a perfect base for a new head & shoulders pattern.
The plan remains the same, if the price violates and closes below that
a correctional movement will be expected.
2️⃣ #GBPUSD daily time frame 🇬🇧🇺🇸
GBPUSD looks weak and shows a clear signs of a strong overbought state.
We see a breakout attempt of a rising parallel channel at the moment.
Daily candle close below that will trigger a correctional movement with a high probability.
3️⃣ DOLLAR INDEX #DXY daily time frame 💵
Dollar Index shows clear strength after 2 recent US fundamental releases.
The last obstacle for the bulls is the underlined blue resistance,
its breakout and a daily candle close above will trigger more growth.
4️⃣ #EURAUD daily time frame 🇪🇺🇦🇺
It feels like the pair is returning to a global bullish trend.
The price has recently retraced and perfectly respected the underlined support.
With a high probability, we will see a test of a current high soon.
Do you agree with my market breakdown?
❤️Please, support my work with like, thank you!❤️
❤️Please, support my work with like, thank you!❤️
I am part of Trade Nation's Influencer program and receive a monthly fee for using their TradingView charts in my analysis.
