XAUUSD Analysis todayHello traders, this is a complete multiple timeframe analysis of this pair. We see could find significant trading opportunities as per analysis upon price action confirmation we may take this trade. Smash the like button if you find value in this analysis and drop a comment if you have any questions or let me know which pair to cover in my next analysis.
Goldsignals

GOLD (XAUUSD): Correctional Movement Ahead?
After a test of 3000 psychological level, Gold looks overbought.
Analysing a 4H time frame, we can spot a completed head & shoulders pattern.
A bearish movement will be confirmed with a breakout of its horizontal neckline.
If a 4H candle closes below 2978, we can expect a retracement much lower
at least to 2955.
❤️Please, support my work with like, thank you!❤️
I am part of Trade Nation's Influencer program and receive a monthly fee for using their TradingView charts in my analysis.

Gold (XAUUSD) 15-Minute Chart Analysis – Bullish Trade SetupGold (XAUUSD) 15-Minute Chart Analysis
Key Observations:
Price Action:
The price is currently at $2,981.96.
The price has been in an uptrend, forming higher highs and higher lows.
Moving Averages:
EMA 30 (red line): At $2,965.00, acting as a dynamic support level.
EMA 200 (blue line): At $2,935.17, indicating a long-term bullish trend.
Trade Setup:
Entry Level: Around $2,981.96.
Stop Loss: Placed at $2,966.81.
Take Profit Targets:
TP1: $2,985.86
TP2: $2,992.23
TP3: $2,998.08
Final Target: $3,005.50
Risk-Reward Ratio:
The risk is defined by the distance between the entry price and the stop loss.
The reward is defined by the distance between the entry price and each take-profit level.
Given the setup, the trader is aiming for a favorable risk-to-reward ratio.
Trading Perspective:
Bullish Bias: The trend is strongly bullish, supported by the EMA 30 and EMA 200.
Confirmation Needed:
If the price sustains above $2,985, it increases the probability of hitting higher targets.
A break below $2,970 could invalidate the trade setup.
Would you like a deeper analysis with Fibonacci levels or volume data?

GOLD (XAUUSD): 3000 Level Reached! What's Next?
Well, the most important thing about this week is of course a continuation of a bullish rally on Gold.📈
The price rapidly violated the all-time high and went much higher reaching 3000 level.
Technical analysis skeptics should admit how perfectly the 3000 psychological structure started to absorb the market supply, not letting the price go higher. 📈
What will happen next?
Still not clear, 3000 is definitely not a limit but probably just a local pit stop.
While many traders feel happy about the extraordinary Gold rally, the truth that Gold price action has a very strong correlation with negative global events. Though I am not sure what exactly caused this rally on Thursday, something definitely is going on behind the scenes and I think that it is not good.🧐
Have a great weekend, traders!
❤️Please, support my work with like, thank you!❤️

XAUUSD Analysis todayHello traders, this is a complete multiple timeframe analysis of this pair. We see could find significant trading opportunities as per analysis upon price action confirmation we may take this trade. Smash the like button if you find value in this analysis and drop a comment if you have any questions or let me know which pair to cover in my next analysis.

SILVER (XAGUSD): Bullish Rally Continues
With a yesterday's strong bullish movement, Silver
broke and closed above a key daily resistance cluster.
Watching how strong is the bullish momentum today,
I think that the market will continue rising.
Next resistance - 3440
❤️Please, support my work with like, thank you!❤️
I am part of Trade Nation's Influencer program and receive a monthly fee for using their TradingView charts in my analysis.

GOLD VIEW 3H READ THE CAPTAINHello 👋 gold traders
3-hour timeframe of Gold Spot (XAU/USD) with technical analysis levels and moving averages. Here’s a breakdown of the key points:
Key Observations:
1. Support & Resistance Levels:
Support Level: Around 2,909.870 - 2,902.340 (marked as the buying zone).
Resistance Level: 2,930.173.
Target Point: 2,960.607.
2. Exponential Moving Averages (EMAs):
30 EMA (Red Line): 2,909.870 (Short-term trend).
200 EMA (Blue Line): 2,884.578 (Long-term trend, acting as strong support).
3. Price Action:
The price is currently in a consolidation phase around the resistance zone.
If the price breaks above 2,930, we might see a bullish move toward the target at 2,960.
If the price fails to break resistance, a pullback to the buying zone (support level at 2,909-2,902) is possible.
Trading Strategy Ideas:
Bullish Scenario (Breakout Above 2,930): Look for long positions targeting 2,960.
Bearish Scenario (Rejection at Resistance): A retest of the buying zone (2,909 - 2,902) before another push higher.

XAU/USD Chart"Do you think gold can give us a profit before it closes its weekly candle, reaching from the current price of 2958?"
"Do you think gold can give us a profit before it closes its weekly candle, reaching from the current price of 2958? And if you were in this trade, where would you set your take profit and stop loss?"

GOLD (XAUUSD): Rise Continues
Gold broke and closed above a resistance line of a horizontal
consolidation range on a daily.
We can expect a bullish movement to the All-Time high now.
Goal - 2952
❤️Please, support my work with like, thank you!❤️

XAUUSD, 1H, 12/03/2025, 09/30.As explained Target achieved in Buy setup.
As we are looking for another set-up.
XAUUSD Buy Setup.

XAU/USD: Another Fall Ahead ? (READ THE CAPTION)By analyzing the 2-hour timeframe for gold, we see that the price remains range-bound with no clear directional trend. Currently, gold is trading around the $2900 level, and if it fails to break above $2913 again, we can expect a downward correction. Potential targets for this correction are $2870, $2861, and $2853. Keep an eye on price reactions at each of these key levels, as all three could present opportunities for buy positions!
Please support me with your likes and comments to motivate me to share more analysis with you and share your opinion about the possible trend of this chart with me !
Best Regards , Arman Shaban

Ready for CorrectionThe price cannot break this resistance and has been repeatedly rejected, indicating a corrective move to 2.880.
Give me some energy !!
✨We spend hours finding potential opportunities and writing useful ideas, we would be happy if you support us.
Best regards CobraVanguard.💚
_ _ _ _ __ _ _ _ _ _ _ _ _ _ _ _ _ _ _ _ _ _ _ _ _ _ _ _ _ _ _ _
✅Thank you, and for more ideas, hit ❤️Like❤️ and 🌟Follow🌟!
⚠️Things can change...
The markets are always changing and even with all these signals, the market changes tend to be strong and fast!!

XAUUSD Top-down analysis Hello traders, this is a complete multiple timeframe analysis of this pair. We see could find significant trading opportunities as per analysis upon price action confirmation we may take this trade. Smash the like button if you find value in this analysis and drop a comment if you have any questions or let me know which pair to cover in my next analysis.

Gold (XAU/USD) Breakdown Potentialhello guys.
The previous trendline was broken, leading to a bearish move.
Price formed a range, consolidating between key levels.
A breakout occurred below the range, signaling weakness.
The current retest suggests a potential rejection and continuation to the downside.
If price fails to reclaim the range, we could see a drop towards the $2,875 - $2,860 support zone.
Traders should watch for confirmation of rejection before entering short positions.

You will be glad you have a short positionBrothers, I have clearly reminded you in the above two article updates that I am very optimistic about gold's retreat to the 2905-2895 area. In the short term, gold has shown signs of retreat after touching the area near 2922 several times, and formed a distinct long upper shadow in the candle chart, further strengthening the effectiveness of the resistance area 2925-2935 area, further stimulating the willingness of gold to fall.
In the short term, I think gold still has the opportunity to retreat to the 2905-2895 area again. I am still patiently holding my short position and looking forward to further declines in gold, which will bring us rich profits.
Bro, do you have the courage to short gold with me?Trading means that everything has results and everything has feedback. I have been committed to market trading and trading strategy sharing, striving to improve the winning rate of trading and maximize profits. If you want to copy trading signals to make a profit, or master independent trading skills and thinking, you can follow the channel at the bottom of the article to copy trading strategies and signals

Be bold and short gold to reap profitsBros, gold continued to rebound to around 2922, but after touching 2922 several times, gold could not continue to make an effective breakthrough and showed signs of retracement. This proves that the upper pressure is strong. According to the current momentum of gold, it cannot easily break through the resistance of the 2925-2930 zone above.
Then gold must have the need to retrace and accumulate power, so my trading strategy in the above article is still valid. We have shorted gold in the 2915-2925 area according to the trading plan. Now we are patiently waiting for gold to fall deeper and expand our profits. It is expected that gold will retest the 2905-2895 zone again.
Bros, gold is now like a drunken old man, swaying from side to side as he walks. At any moment, he might stumble and fall along the way.
Trading means that everything has results and everything has feedback. I have been committed to market trading and trading strategy sharing, striving to improve the winning rate of trading and maximize profits. If you want to copy trading signals to make a profit, or master independent trading skills and thinking, you can follow the channel at the bottom of the article to copy trading strategies and signals

XAUUSD 1H, 11/03/2025, 02:00PMAs i explained this Gold setup its going up. SL below entry candle, Target as mentioned.
XAUUSD 1H, 11/03/2025. 08:00 IST. Gold is in sideways condition in this situation we should take entry as per market shows the direction, I have clearly mentioned how to take entry where to take entry and where should be the target but SL should be at the opening of entry candle.

GOLD Daily Analysis: Is This the Start of a Deeper Correction?OANDA:XAUUSD is moving inside a clear ascending channel, with the upper boundary acting as long-term resistance and the lower boundary providing dynamic support. Price has been respecting this channel, with multiple touches on both the upper and lower boundaries, reinforcing its structure. Recently, the price formed a double top near the upper boundary, a classic reversal signal suggesting bullish exhaustion.
If the price continues to hold below this level, it could lead to further downside. The next major support is around 2,780 , which aligns with a previous support level and also falls within the golden pocket on the Fibonacci retracement, making it a significant area for a potential reaction.
However, if the price reclaims the double-top region and pushes above recent highs, it would invalidate the bearish outlook and suggest another attempt to break the channel’s upper boundary. For now, the structure remains bearish, with 2,780 as the main downside target.

XAUUSD One more push to 3100 to price the Top.Gold (XAUUSD) continues to trade within its 2025 Channel Up, in fact the uptrend started a little bit sooner on the November 14 2024 bottom. As we've mentioned before and you can see again today, this is a recurring pattern which has been in effect since October 2022, the bottom of the Inflation Crisis.
This involves the market forming Channel Up patterns of around +20% price increase, which are supported by the 1D MA50 (blue trend-line) and when that breaks, they bottom around the 0.382 Fibonacci retracement level and then turn into a buy opportunity for the next Channel Up.
The 1D RSI Double Tops and signals the price (Channel Up) High. It's first Top is where Gold is right now, typically within the 0.5 - 0.382 Fib Zone. The only time it was above the 0.382 Fib, was when it rose by +22%. As a result, we expect a similar course and a price peak around $3100 but the most effective sell signal remains when the 1D RSI Double Tops.
-------------------------------------------------------------------------------
** Please LIKE 👍, FOLLOW ✅, SHARE 🙌 and COMMENT ✍ if you enjoy this idea! Also share your ideas and charts in the comments section below! This is best way to keep it relevant, support us, keep the content here free and allow the idea to reach as many people as possible. **
-------------------------------------------------------------------------------
Disclosure: I am part of Trade Nation's Influencer program and receive a monthly fee for using their TradingView charts in my analysis.
💸💸💸💸💸💸
👇 👇 👇 👇 👇 👇

XAUUSD Analysis Today Hello traders, this is a complete multiple timeframe analysis of this pair. We see could find significant trading opportunities as per analysis upon price action confirmation we may take this trade. Smash the like button if you find value in this analysis and drop a comment if you have any questions or let me know which pair to cover in my next analysis.

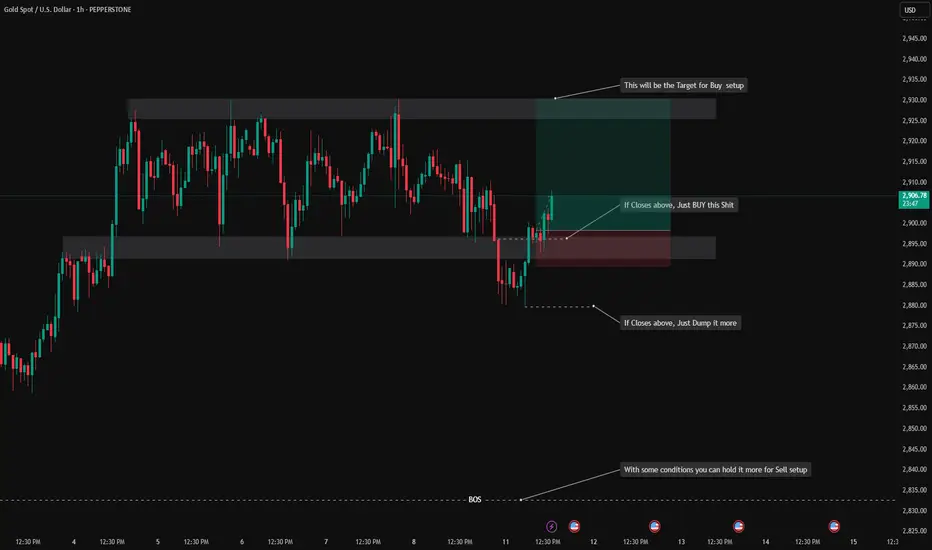
XAUUSD Possible sell on break of structureXAUUSD with the market opening price has initially bounced from the daily support with strong rejection from the top showing potential drop to the support level. Upon break of structure, expecting a potential sell opportunity to the support level as the price is still showing bearish pressure.

Gold market analysis: 10-Mar-2025Good morning! Happy New Week! Happy New Day! Here's your daily Gold market analysis. Learn, grow, and trade wisely.
