XAUUSD Analysis todayHello traders, this is a complete multiple timeframe analysis of this pair. We see could find significant trading opportunities as per analysis upon price action confirmation we may take this trade. Smash the like button if you find value in this analysis and drop a comment if you have any questions or let me know which pair to cover in my next analysis.
Goldsignals

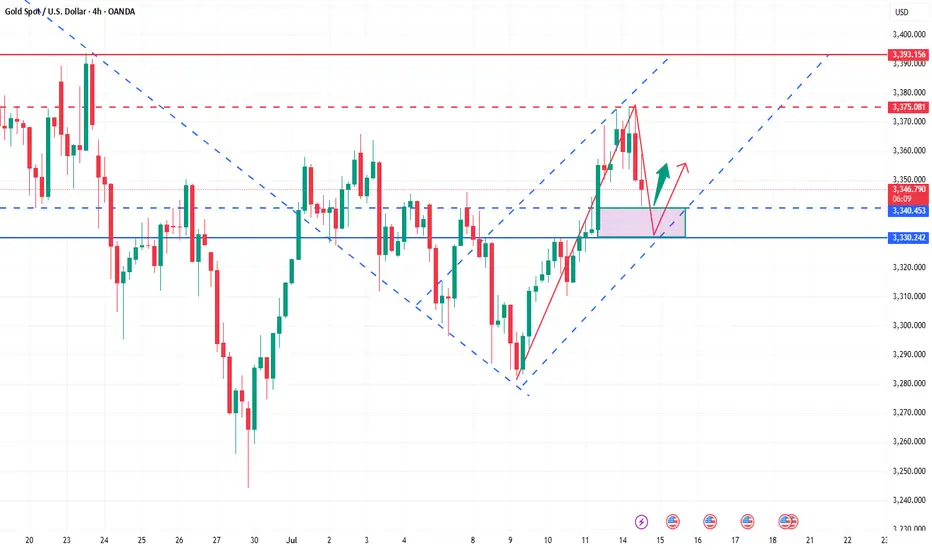
Two lines of defense for bulls: 3340 and 3330 are the key!Gold maintains a strong pattern in the short term, and it is recommended to mainly buy on dips. The short-term support below focuses on the neckline of the hourly line at 3340 last Friday. The more critical support is locked at the 3330 line. This range is an important watershed for judging the continuation of short-term bullish momentum. As long as the daily level can remain stable above the 3330 mark, the overall trend will remain upward. Before falling below this position, we should adhere to the idea of buying low and buying low, and rely on key support levels to arrange long orders. At present, the price has completed a technical breakthrough and broke through the upper edge of the 3330 convergence triangle under the dual positive factors of Trump's tariff landing to stimulate risk aversion and the support of the Fed's interest rate cut expectations, and formed three consecutive positive daily lines. It is necessary to pay attention to the short-term pressure at the 3375 line. The overall operation strategy will be combined with the real-time trend prompts during the trading session, and pay attention to the bottom in time.
XAUUSD Triangle about to break upwards aggressively.Gold (XAUUSD) has been trading within a Triangle pattern since the April 22 High. It is now above its 1D MA50 (blue trend-line), which has been turned into its Pivot and technically it is about to break upwards as it is running out of space.
As long as the 1D MA100 (green trend-line) holds, the market technically targets the 2.618 Fibonacci extension, which is what the last two Bullish Legs hit, which currently sits at 3770. A 1D RSI break above its own Lower Highs trend-line, could be an early buy signal.
-------------------------------------------------------------------------------
** Please LIKE 👍, FOLLOW ✅, SHARE 🙌 and COMMENT ✍ if you enjoy this idea! Also share your ideas and charts in the comments section below! This is best way to keep it relevant, support us, keep the content here free and allow the idea to reach as many people as possible. **
-------------------------------------------------------------------------------
Disclosure: I am part of Trade Nation's Influencer program and receive a monthly fee for using their TradingView charts in my analysis.
💸💸💸💸💸💸
👇 👇 👇 👇 👇 👇

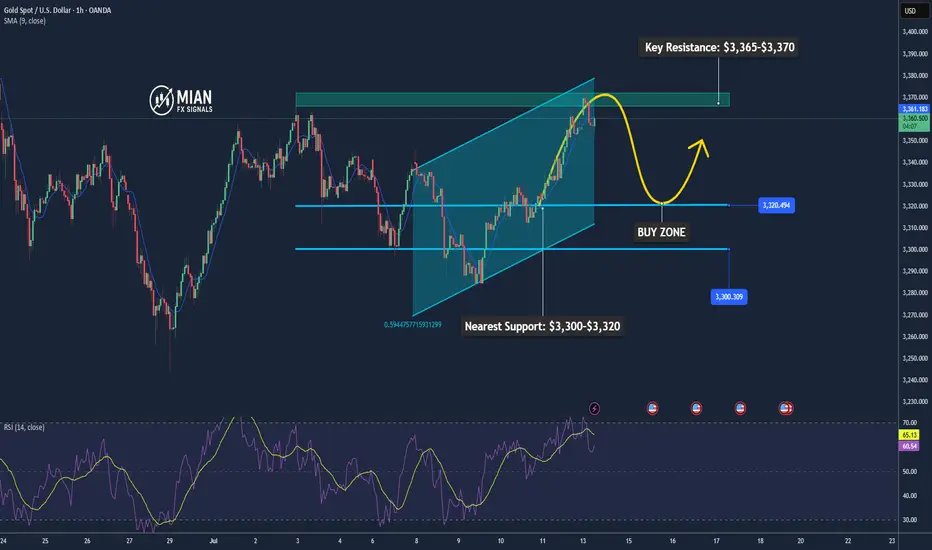
Gold May Temporarily Correct Under Resistance Pressure📊 Market Overview:
• Gold reached resistance around $3,365–$3,370/oz before showing signs of cooling due to mild profit-taking.
• Ongoing trade tensions and geopolitical risks — such as President Trump’s tariff plan — continue to support safe-haven demand, driving gold close to a three-week high.
• Strong central bank purchases reinforce the long-term bullish outlook.
📉 Technical Analysis:
• Key Resistance: $3,365–$3,370
• Nearest Support: $3,300–$3,320
• EMA 09: Price is currently below the EMA 09, suggesting a potential short-term pullback. (Price is still above the EMA50, supporting the recent uptrend.)
• Candlestick patterns / Volume / Momentum:
o RSI near 57 – neutral but slightly declining.
o MACD and ADX remain bullish, indicating underlying strength but with possible short-term consolidation ahead.
📌 Outlook:
Gold may experience a short-term pullback if it fails to break through the $3,365–$3,370 zone and geopolitical tensions ease.
However, the medium-to-long-term trend remains bullish, especially as central banks continue to accumulate gold and global risks persist.
💡 Suggested Trading Strategy:
SELL XAU/USD: $3,363–$3,366
🎯 Take Profit: 40/80/200 pips
❌ Stop Loss: $3,369
BUY XAU/USD : $3,317–$3,320
🎯 Take Profit: 40/80/200 pips
❌ Stop Loss: $3,214
THE KOG REPORT THE KOG REPORT:
In last week’s KOG Report we said we would be looking for the price to spike down into potentially the extension level 3310 and then give us the tap and bounce we wanted to be able to capture the long trade in to the 3345-50 region initially. It was those higher resistance levels that we said we would stick with and the bias was bearish below. This move resulted in a decent long trade upside into the region we wanted, and then the decline we witnessed mid-week completing all of our bearish target levels which were shared with everyone.
On top of that, we got the bounce we wanted for the long trade but only back up into the 3335 level which was an Excalibur active target. The rest, we just sat and watched on Friday as unless we were already in the move, the only thing we could have done is get in with the volume, which isn’t a great idea with the limited pull backs.
All in all, a great week in Camelot not only on Gold, but also the other pairs we trade with the DAX swing trade being a point to point swing move executed with precision by the team.
So, what can we expect in the week ahead?
We’ll keep it simple again this week but will say this, there seems we may see a curveball on the way this week. With tariff news over the weekend we may see price open across the markets with gaps, one thing we will say is if you see these gaps, don’t gap chase until you see a clean reversal!
We have the higher level here of 3375-85 resistance and lower support here 3350-45. If support holds on open we may see that push upside into the red box which is the one that needs to be monitored. Failure to breach can result in a correction all the way back down into the 3335 level initially. Again, this lower support level is the key level for this week and needs to be monitored for a breach which should then result in a completed correction of the move.
Our volume indicators are suggesting a higher high can take place here and if we do get a clean reversal we should see this pull back deeply. As usual we will follow the strategy that has been taught and let Excalibur guide the way.
KOG’s bias for the week:
Bullish above 3350 with targets above 3360, 3373, 3375 and 3383 for now
Bearish below 3350 with targets below 3340, 3335, 3329, 3320 and 3310 for now
RED BOX TARGETS:
Break above 3365 for 3372, 3375, 3382, 3390 and 3406 in extension of the move
Break below 3350 for 3340, 3335, 3329, 3322 and 3310 in extension of the move
It’s a HUGE RANGE this week so play caution, wait for the right set ups, don’t treat it like it’s your every day market condition. News from Tuesday so expect Monday to be choppy!
Please do support us by hitting the like button, leaving a comment, and giving us a follow. We’ve been doing this for a long time now providing traders with in-depth free analysis on Gold, so your likes and comments are very much appreciated.
As always, trade safe.
KOG

Gold Building Momentum for BUY MoveGold has tested the global trend level is showing a rebound the price is testing the support level of 3368 if it maintain support level the growth will continue to 3400 level
we suggest BUY XAUUSD 3368 entry point
target point 3400

XAUUSD Analysis todayHello traders, this is a complete multiple timeframe analysis of this pair. We see could find significant trading opportunities as per analysis upon price action confirmation we may take this trade. Smash the like button if you find value in this analysis and drop a comment if you have any questions or let me know which pair to cover in my next analysis.

GOLD (XAUUSD): Another Bullish Pattern
Gold perfectly respected a rising trend line on a daily and
bounce from that, as I predicted earlier.
I see a strong bullish pattern on that now.
The price formed a cup & handle pattern and closed
on Friday, testing its neckline.
The next bullish confirmation that you should look for is its breakout.
Daily candle close above 3367 level will provide a breakout validation.
A bullish continuation will be expected then.
❤️Please, support my work with like, thank you!❤️
I am part of Trade Nation's Influencer program and receive a monthly fee for using their TradingView charts in my analysis.

Although the bulls are strong, don't chase them at high levelsGold trend analysis:
The market is fluctuating repeatedly now, and it is possible to rise or fall, but under the bullish trend, the main force is still rising. Therefore, this week's trading is to fall back and do more at a low price. Whether it is the previous 3285, 3306, or 3315, there are good profits. Although it is temporarily unable to break out of the bullish volume, at least the trend remains unchanged, and there will definitely be a large upward space in the future. Today is Friday, and we still pay attention to the possibility of bullish volume. This week, we have been emphasizing that if it rises during the week, we will see the 3370 high point. If 3370 breaks, there are still 3380 and 3400 above. On Friday, we will see whether this idea is realized.
From a technical point of view, there was a sharp pull this morning, with the big sun breaking through the upper track of the downward channel 3326 in the above figure, and then stepping back to confirm stabilization and bottoming out, which means that the breakthrough is effective, so you can directly follow the bullish trend in the morning, and during the European session, it repeatedly went up and down around the 3345-3332 range. With the experience of yesterday's trend, today we have been waiting for it to approach the 10-day moving average and then continue to be bullish on dips, and the entry point is basically good; currently it has broken through the resistance level of 3345 in the European session, so it depends on whether it can stand directly on it tonight. Once it stands, it can gradually rush to 3370, and the second is 3374, etc.; Of course, if it just pierces but does not stabilize, it will continue to spiral slowly upward around the yellow channel in the figure, so continue to wait patiently for the 10-day moving average, which is also the lower track position to grasp the low and long; Therefore, tonight gold 3345-3333 continues to rise on dips, with 3330 top and bottom positions as nodes, resistance at 3370, further resistance at 3374, etc.; If there is an unexpected big negative inducement to empty the market like yesterday, pay attention to stabilization above 3320 and still bullish;
Gold operation strategy: It is recommended to go long when it falls back to 3333-3345, and the target is 3360-3370.

Try shorting once below 3355!The market closed at 3326 on Thursday and still failed to break through the small range of long and short positions. The overall market is in a strong bullish trend and this trend indicates the possibility of a breakout in the future. In this week's trading example, after confirming that the 3315 low support is effective, a short-term long operation was successfully carried out below the area and profited. The picture and truth can be checked in the article on Thursday. In the short term, continue to pay attention to the range shock and pay close attention to the breakthrough direction of key points. The first thing to pay attention to is the strong pressure of 3355. If it breaks through and stands firmly at this position, it will open up further upward space, and the potential target can be seen in the 3365 or even 3400 area. On the contrary, if the gold price is always under pressure below 3355, the market is likely to continue the current shock and consolidation rhythm. Therefore, breaking through the 3355 mark will be a key signal to judge whether the market can release significant upward momentum in the future. Before the effective breakthrough, continue to intervene in the low-long opportunity at the 3325-15 support level of the shock range. On the upper side, you can arrange short positions at 3345-3455.

GOLD - at cut n reverse Region? what's next??#GOLD .. perfect ride as per our last idea regarding gold and now market just above his ultimate area/region.
that is around 3320-23
keep close and if market hold it then further bounce expected otherwise not..
NOTE: we will cut n reverse our position below 3320 on confirmation.
good luck
trade wisely
Gold in Equilibrium, Possible Minor Pullback📊 Market Overview:
• Spot gold currently trades around 3,332–3,333 USD/oz
• A slightly weaker US dollar and declining Treasury yields are supporting gold
• Yet strong US jobs data and delayed Fed rate cuts are limiting gold’s upside
• Escalating trade tensions and new tariffs keep safe-haven demand intact
📉 Technical Analysis:
• Resistance: 3,345–3,350 USD, repeatedly tested zone
• Support: 3,316–3,322 USD, strong bottom near 3,310 USD
• EMA 9: Price hovering around it—no clear trend direction
• Momentum/RSI: RSI fading from overbought, momentum weakening
• Candle Patterns/Volume: Narrow consolidation, forming pennant structure
📌 Outlook:
Gold is likely to remain range-bound or dip slightly if USD strengthens. Conversely, renewed economic headwinds or Fed dovishness could push gold higher, especially on a break above 3,345 USD.
💡 Suggested Trade Strategy:
SELL XAU/USD : 3.347–3.350
🎯 TP: 40/80/200 pips
❌ SL: 3.355
BUY XAU/USD : 3.316–3.319
🎯 TP: 40/80/200 pips
❌ SL: 3.310

XAUUSD Trade UpdateYesterday price failed to hold below key support.
Gold has now broken out of a descending channel after reclaiming the global trendline. It’s trading above the nearest fractal and testing the MA200, with Awesome Oscillator flashing bullish momentum.
#TradeIdea
🔼 Buy XAUUSD — only if we get a clear consolidation above $3340
🎯 Target 1: $3360
🎯 Target 2: $3385 (only after Target 1 is hit)
⚠️ Wait for confirmation — no premature entries.

Repeated cycle, timing is keyMarket fluctuations are oscillating about 70% of the time, and only about 30% of the time are unilateral upward or downward, so accumulating small victories into big victories is the magic weapon for long-term success. What we need to do is to plan our positions well, and make this investment with a plan, direction, and guidance. A good trader will make your investment journey smoother. How to operate in a volatile market? The ancients said: Do not do good things because they are small, and do not do evil things because they are small. If we move it to financial management, it can be understood as: Don't be too greedy, enter the market in batches. When entering the market and covering positions, the position should be small. Although the profit is less, accumulating small victories into big victories is the key to success. The investment philosophy is composed of the investor's psychology, philosophy, motivation, and technical level. It mainly includes: stability, patience, independent thinking, discipline, trend, etc.
Judging from the current trend of gold, in the 4H cycle, it has touched 3330 many times under pressure, and the K-line has continuously closed with upper shadows, which is quite similar to yesterday's rhythm. So we must first look at the strength of the decline. The support below is at 3314 and 3306. In terms of operation, it should be treated as mainly long and auxiliary short. The upper pressure still focuses on the gains and losses of 3330.

XAU/USD (Gold) Bearish Outlook – H1/H4 Chart AnalysisGold is currently showing signs of weakness within a confirmed downtrend, forming lower highs and lower lows on the short-term charts. The price structure suggests continued bearish momentum as sellers maintain control beneath key resistance levels.
At present, a potential bearish opportunity is observed if price retraces near the 3320 zone, which aligns with a recent supply area and resistance in the ongoing downtrend. From this level, price action could continue its downward move in line with trend dynamics.
Entry Zone: Around 3320
Primary Target: 3300 (near-term support level)
Final Target: 3280 (extended target aligning with previous demand zone)
Invalidation/Stop Loss: Above 3340 (a break above this may invalidate the bearish bias)
🔸Disclaimer; This setup is based on technical structure and market flow, not financial advice. Always confirm with your own analysis and risk management plan.

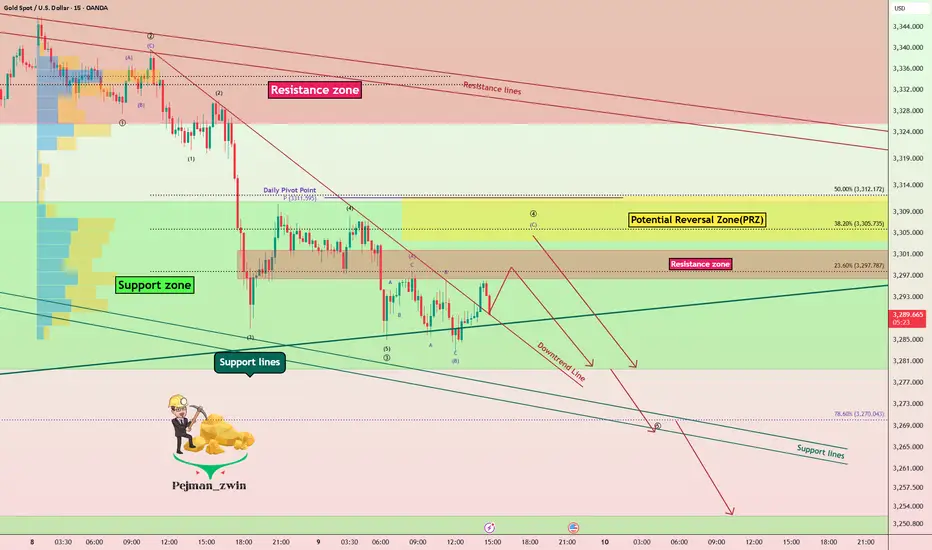
Support Under Siege – Is Gold Ready for Another Leg Down?As I expected in the previous idea , Gold ( OANDA:XAUUSD ) rose to $3,343 on the 1-hour time frame , but failed to break the Resistance zone($3,350-$3,326) and started to fall with relatively good momentum .
Do you think Gold can finally break the Support zone($3,312-$3,280) and Support lines , or will it rise again?
Gold is currently trading in the Support zone($3,312-$3,280) and near the Support line s. It has also managed to break the downtrend line .
In terms of Elliott Wave theory on the 15-minute time frame , Gold appears to be completing a main wave 4 . The main wave 4 appears to follow Double Three Correction(WXY) . Also, the main wave 3 is extended due to the high downward momentum.
I expect Gold to start falling again by entering the Potential Reversal Zone(PRZ) or Resistance zone($3,302-$3,296) and eventually breaking the Support zone($3,312-$3,280) and Support lines, Gold's falling targets are clear on the chart.
Note: Stop Loss (SL) = $3,313
Gold Analyze (XAUUSD), 15-minute time frame.
Be sure to follow the updated ideas.
Do not forget to put a Stop loss for your positions (For every position you want to open).
Please follow your strategy; this is just my idea, and I will gladly see your ideas in this post.
Please do not forget the ✅ ' like ' ✅ button 🙏😊 & Share it with your friends; thanks, and Trade safe.
Gold shows signs of slowing down, are the bears ready?This wave of bullish pull-up is a complete rebound. With the help of the timeliness of fundamentals, the highest rebound only reached around 3330 and then began to fall. At this time, many people probably think that the short-term trend has begun to change. I still stick to my bearish thinking. The important target pressure is definitely around 3330. As long as this position is under pressure and falls back to 3280 again, it will be shaky. At present, the stop loss is based on the break of 3335. If it really breaks, it will be similar to the break of 3280. Even if 3340-3345 is short, it is also a short-term bull correction. If the falling channel is broken, I can't convince myself to continue to be short and stick to it. Once 3335 breaks, I can really confirm the reversal of the short-term trend. Then 3280 will also be the bottom of the medium term. In short, since I am shorting near 3320-3330 in the direction of the band and the short-term negative, I think that the stop loss will be given to 3335. The stop profit target is uncertain. The channel has not been broken. Now the short-term long and short conversions are frequent. It is definitely the best choice in my own trading system. No one will win all the time. It is too fake to win all the time. Make your moves according to your own ideas without regrets. If this wave of strategy verification fails, everyone is welcome to supervise. We dare to take responsibility and review every judgment.

XAUUSD Analysis todayHello traders, this is a complete multiple timeframe analysis of this pair. We see could find significant trading opportunities as per analysis upon price action confirmation we may take this trade. Smash the like button if you find value in this analysis and drop a comment if you have any questions or let me know which pair to cover in my next analysis.

GOLD (XAUUSD): Important Decision Ahead
As I predicted, Gold went up from a trend line yesterday.
The price is now testing another trend line - a falling resistance
of a bullish flag pattern.
The next reliable bullish signal that you can look for is its
bullish breakout and a daily candle close above that.
A bullish move is going to follow then.
❤️Please, support my work with like, thank you!❤️
I am part of Trade Nation's Influencer program and receive a monthly fee for using their TradingView charts in my analysis.

Gold Rebounds from 3283, Eyes 3315 Resistance📊 Market Overview:
• Gold dropped sharply to a low of $3283 earlier today before rebounding strongly back to around $3312, supported by renewed buying interest.
• The recovery is fueled by risk-off sentiment amid ongoing trade negotiation uncertainty and a mild pullback in the U.S. Dollar Index.
• Central bank buying continues to underpin gold’s base, despite mild pressure from rising U.S. bond yields.
________________________________________
📉 Technical Analysis:
• Key Resistance: $3315 – $3335
• Nearest Support: $3280
• EMA 09: Price is trading above the 9-period EMA, signaling a short-term bullish trend.
• Candle pattern / Momentum: A strong bullish engulfing candle formed after bouncing from $3283 on the H1 chart. MACD is crossing upward, and RSI is approaching the 60 level, suggesting bullish momentum.
________________________________________
📌 Outlook:
Gold may continue to recover in the short term if it holds above the $3300 level and successfully breaks through $3315 resistance. However, failure to break above this resistance could lead to a short-term pullback toward $3290–$3280.
________________________________________
💡 Suggested Trading Strategy:
🔻 SELL XAU/USD at: $3315–3325
🎯 TP: $3295
❌ SL: $3330
🔺 BUY XAU/USD at: $3285–3295
🎯 TP: $3315
❌ SL: $3280

The risks of shorting at low levels have been informed!Today, I have reminded you many times not to chase short positions at low levels. Now you can see that gold has bottomed out and rebounded. We also bought gold in batches at 3285-3295, and the long positions also made perfect profits. I believe that friends who follow my articles can see that I have always emphasized not to short at low levels. It is also obvious to everyone that we bought long positions near 3295-3285. In the future, we will continue to pay attention to the suppression of the upper 3318-3325 line. If the rebound does not break, we will look for opportunities to short. I hope everyone can grasp the entry position and hold the profit. The rebound will first look at the previous break point of the 3325 line, and then short when the rebound is suppressed! If your current gold operation is not ideal, I hope I can help you avoid detours in your investment. Welcome to communicate with me!
From the current analysis of gold trend, today's upper short-term resistance focuses on the hourly top and bottom conversion position of 3318-3325. The intraday rebound relies on this position to go short once and look down. The lower short-term support focuses on 3280. The overall support relies on the 3280-3325 area to maintain the main tone of high-altitude low-multiple cycles. In the mid-line position, keep watching and do less, be cautious in chasing orders, and wait for the opportunity to enter the market after the key points are in place.
Gold operation strategy: short gold rebounds near 3318-3325, target 3305-3295.

Gold Drops to 3,284 – Short-Term Support at Risk📊 Market Overview
Gold fell sharply this morning to $3,284/oz amid a modest USD rebound and profit-taking pressure following several range-bound sessions. The lack of fresh catalysts also contributed to weaker momentum.
📉 Technical Analysis
• Key Resistance: 3,315 – 3,330
• Nearest Support: 3,280 – 3,275
• EMA 09: Price is currently trading below the EMA 09 on both the H1 and H4 timeframes → short-term bearish signal
• Candle Patterns & Momentum:
– H1 candle shows a bearish engulfing pattern near the 3,305 area → confirms downward pressure
– RSI is below 45, MACD has crossed below its signal line → bearish momentum dominant
– If the 3,275 level is breached, gold could continue to fall toward 3,260
📌 Outlook
Gold is leaning toward further downside unless it can hold above the 3,280 support level during today’s session.
💡 Trade Strategy
🔻 SELL XAU/USD at: 3,295 – 3,398
🎯 TP: 40/80/200 PIPS
❌ SL: 3,305
🔺 BUY XAU/USD at: 3,275 – 3,278
🎯 TP: 40/80/200 PIPS
❌ SL: 3,269

GOLD (XAUUSD): Time to Recover?!
Gold reached an important rising trend line on a daily.
I see 2 nice intraday bullish reactions to that on a 4H time frame
and a double bottom pattern formation.
Its neckline breakout and a 4H candle close above 3309
will confirm a start of a bullish correctional movement.
Goal will be 3327.
Alternatively, a bearish breakout of the trend line will push
the prices lower.
❤️Please, support my work with like, thank you!❤️
I am part of Trade Nation's Influencer program and receive a monthly fee for using their TradingView charts in my analysis.
