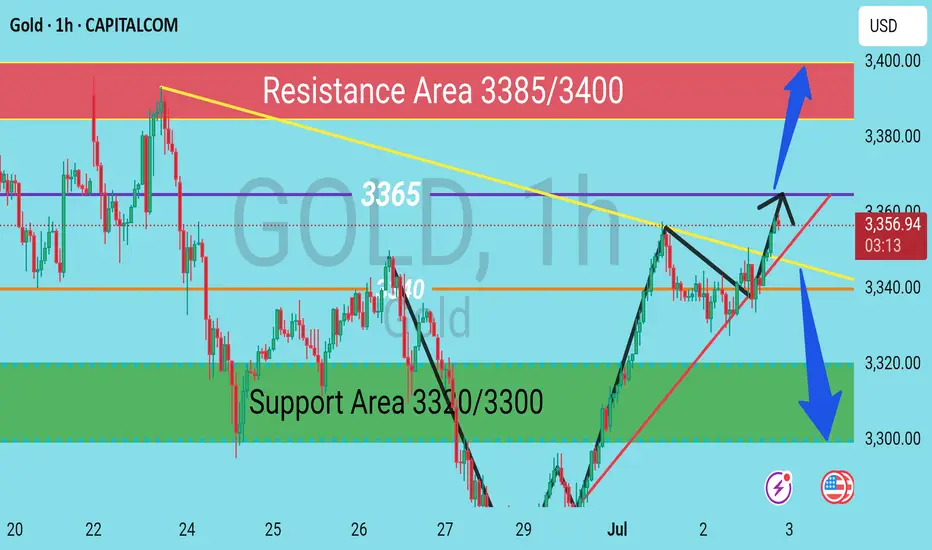
XAU/USD (GOLD) H1 Chart Outlook – Supply & Demand PerspectiveGold is currently consolidating in a tight range near the 3355–3358 zone, showing indecision ahead of a potential breakout. Based on supply and demand dynamics, here’s what to watch:
---
🔼 Bullish Scenario
If the H4 candle closes above 3365, this would confirm a bullish breakout above the immediate supply zone. In that case, expect upside momentum to target key resistance levels:
🎯 3385 – Minor resistance
🎯 3400 – Major resistance and potential reversal zone
A confirmed breakout with strong volume could open room for a short-term bullish rally.
---
🔽 Bearish Scenario
On the flip side, if the H4 candle closes below 3340, it would signal weakness and a possible rejection from the current range. This breakdown could shift the momentum to the downside, targeting the following support levels:
🛑 3320 – Near-term support
🛑 3300 – Critical demand zone
Failure to hold 3300 could indicate further bearish pressure in the coming sessions.
Goldsignals
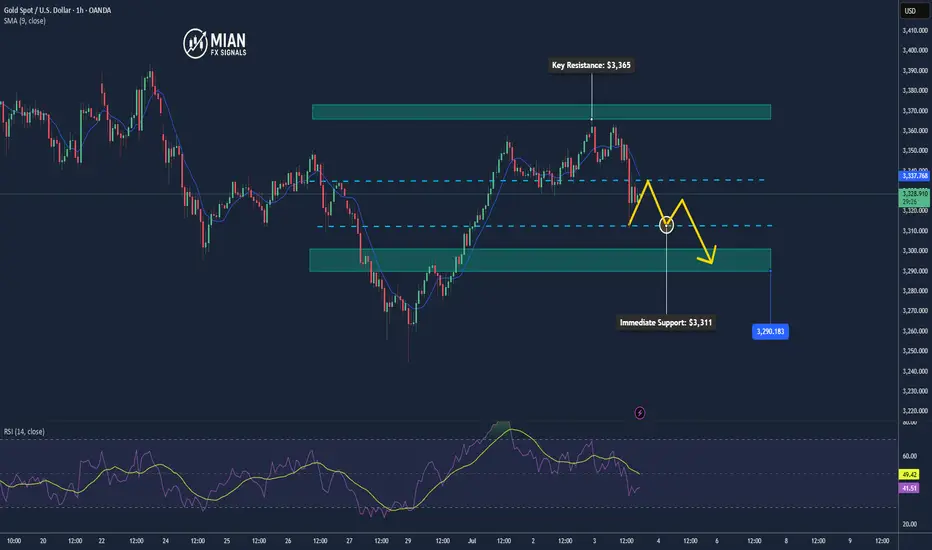
Gold Drops as NFP Beats, USD Gains📊 Market Overview:
• June’s Non-Farm Payrolls came in stronger than expected at +147K (vs 110K forecast), with unemployment ticking down to 4.1%.
• The US Dollar surged (DXY up ~0.5%) and Treasury yields rebounded following the release.
• Gold dropped sharply after the report, hitting a session low of $3,311 and is now trading around $3,328.
📉 Technical Analysis:
• Key Resistance: $3,364
• Immediate Support: $3,311
• EMA 09 (H1): Price is below the 09 EMA → confirms short-term bearish trend.
• Pattern / Momentum: A bearish engulfing candle near $3,364 signaled strong seller control. The failure to bounce afterward suggests persistent bearish pressure. RSI is tilting lower, confirming weakening momentum.
📌 Outlook:
Gold may continue to decline toward the $3,300–$3,290 area if USD and yields remain firm, especially if upcoming US data (such as ISM Services PMI) also supports the dollar strength.
💡 Suggested Trade Setup:
🔻 SELL XAU/USD at: $3,333 – $3,335
🎯 TP: $3,300
❌ SL: $3,339
🔺 BUY XAU/USD at: $3,293 – $3,290
🎯 TP: $3,330
❌ SL: $3,287
Continue to maintain the rhythm of short tradingUnder the influence of NFP, gold fell sharply as expected. What I had suggested before was proven correct by the market again. "Gold rose in advance to reserve room for the NFP market to fall." After NFP, gold fell to around 3311 and the decline narrowed. Therefore, we accurately seized the opportunity to go long on gold near 3312 and set TP: 3330. Obviously, gold successfully hit TP during the rebound and made an easy profit of 180 pips.
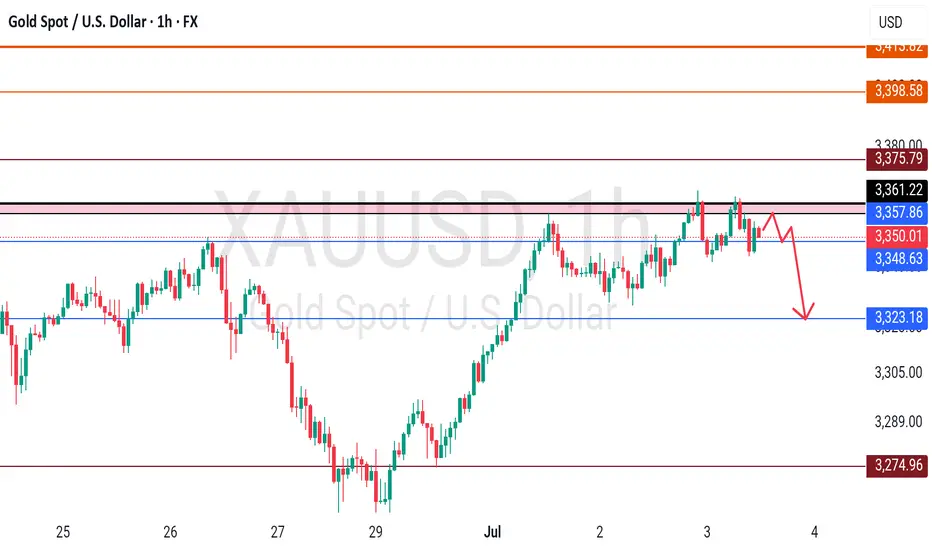
From the current gold structure, gold encountered resistance and retreated twice near 3365, and built a double top structure in the short-term structure. In order to eliminate the suppression of the double top structure, gold still needs to continue to fall after the rebound. After the cliff-like decline of gold, the short-term resistance is in the 3340-3345 area, and the short-term support below is in the 3320-3310 area.
So I think that gold can still continue to short gold after the rebound, and I have already shorted gold around 3336 with the 3340-3345 area as resistance. Now we just need to wait patiently for gold to hit TP. Let us wait and see!

GOLD - High placed? Short now?#GOLD... market placed 3362-64 after our last idea regarding gold buying.
And market behaved indicate us that that is a final high for now and below that a dip can be possible.
So keep close and don't buy until market holds..
Good luck
Trade wisely
Gold May Pull Back After Day’s High📊 Market Overview:
• Gold is currently trading around $3,350/oz, with the daily high at $3,366/oz.
• The rally stalled as traders took profits near the session high, while a slight rebound in the USD and rising U.S. Treasury yields weighed on gold’s momentum.
📉 Technical Analysis:
• Key Resistance: ~$3,366 (today’s high), with next level at ~$3,375–3,380 if breached.
• Nearest Support: ~$3,342 (intra-day low), stronger support seen at $3,329–3,330.
• EMA 9/21: Price is hovering near the EMA21 (~$3,350); this area is crucial to determine the short-term trend.
• Candle/Momentum Indicators:
o RSI is around 53-55, signaling a neutral stance;
o MACD shows weakening bullish momentum after hitting resistance.
📌 Viewpoint:
Gold may see a minor pullback in the short term, possibly testing the $3,342–3,329 zone after reacting to the daily high. However, if it holds above EMA21 and EMA50, the medium-term bullish trend remains intact.
💡 Suggested Trading Strategy
SELL XAU/USD at: $3,363–3,366
🎯 TP: 40/80/200 pips
❌ SL: $3,370
BUY XAU/USD at: $3,329–3,332
🎯 TP: 40/80/200 pips
❌ SL: $3,325

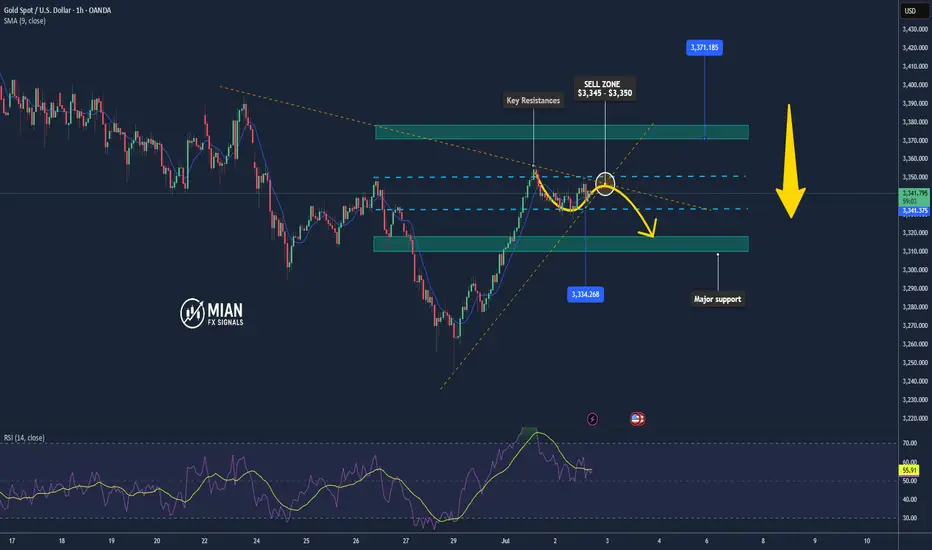
I have shorted gold as expected and held on patientlyEven under the influence of the ADP data, which is bullish for the gold market, gold has not effectively broken through 3350, and even showed signs of falling back after rising several times. The resistance above is becoming more and more obvious, which may further weaken the market's bullish sentiment and confidence, thereby strengthening the dominance of the bears.
Although gold has not effectively fallen yet, from the perspective of the gold structure, even if gold wants to rise, it still needs to be backtested and support confirmed before rising, and the current retracement is far from enough, so gold still has a need for structural retracement; and before the NFP market, gold rose slowly but was far from enough to break upward, and there was no volume support, so the illusion of gold rising may be to lure and capture more bulls;
Therefore, out of caution, I try to avoid chasing gold at high levels; and I believe that shorting gold is still the first choice for short-term trading at present. And I have executed short trades in the 3340-3350 area according to the trading plan, and held it patiently. I hope that gold can retreat to the 3320-3310-3300 area as expected.

Gold Sees Volatile Swings – Pullback Risk Remains📊 Market Highlights:
Gold surged to $3,351 earlier today after weaker-than-expected US ISM manufacturing data, which boosted expectations of a Fed rate cut. However, profit-taking quickly pushed prices down to $3,334 before recovering to $3,342.
📉 Technical Analysis:
• Key Resistance: $3,351
• Nearest Support: $3,334
• EMA: Price is above EMA 09 → uptrend still intact.
• Candles / Volume / Momentum: H1 candle shows a long upper wick, indicating selling pressure near the recent high. Bullish momentum is slowing, and volume has started to normalize.
📌 Outlook:
Gold may face a short-term pullback if it fails to break above $3,351 and the USD strengthens during the US session.
________________________________________
💡 Suggested Trading Strategy:
🔻 SELL XAU/USD at: $3,345 – $3,350
🎯 TP: $3,334
❌ SL: $3,353
🔺 BUY XAU/USD at: $3,332 – $3,334
🎯 TP: $3,350
❌ SL: $3,323
Gold Pulls Back Slightly After Peaking at $3,357📊 Market Overview:
Gold rallied to $3,357 yesterday following weak US manufacturing PMI, sparking expectations of an upcoming Fed rate cut. This morning, prices are pulling back to around $3,340 as traders await the FOMC meeting minutes for further guidance.
📉 Technical Analysis:
• Near resistance: $3,357
• Key resistance: $3,370
• Near support: $3,330
• Major support: $3,318
• EMA: Price is still above the 09 EMA, but starting to slope downward → short-term weakness emerging.
• Candlestick & momentum: Doji candle with a long upper wick on H4 chart around $3,357 → showing fading bullish momentum. RSI dropping out of overbought zone confirms potential short-term pullback
📌 Outlook:
Gold is currently in a mild downward correction, and may continue to decline toward $3,330 – $3,318 if the FOMC minutes do not suggest strong dovish intent.
💡 Suggested Trading Strategy:
🔻 SELL XAU/USD at: $3,350 – $3,354
🎯 TP: $3,330
❌ SL: $3,359
🔺 BUY XAU/USD at: $3,328 – $3,332
🎯 TP: $3,350
❌ SL: $3,318

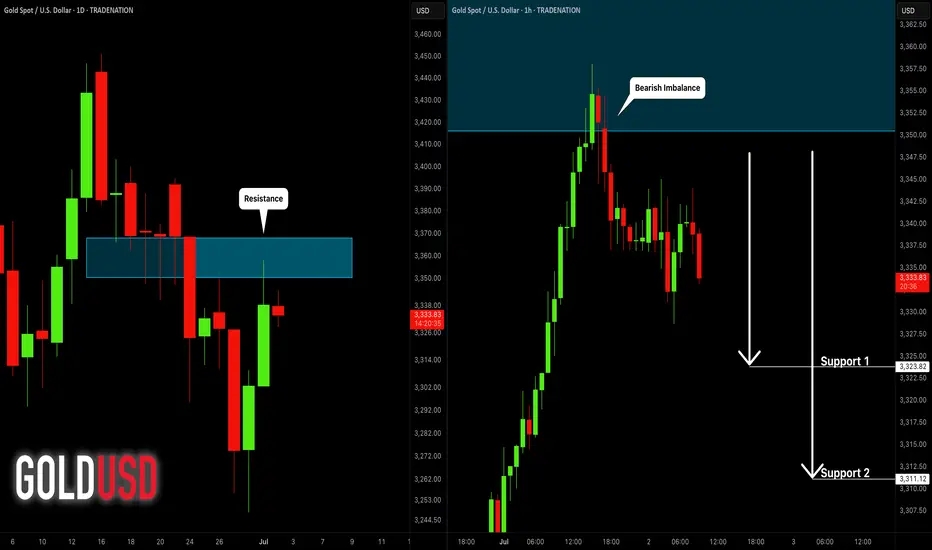
GOLD (XAUUSD): Bearish Move From Resistance
Gold went overbought after a test of a key daily resistance cluster.
A formation of multiple bearish imbalance candles on an hourly time frame
signifies a local dominance of the sellers.
The price will continue retracing at least to 3323 support.
❤️Please, support my work with like, thank you!❤️
I am part of Trade Nation's Influencer program and receive a monthly fee for using their TradingView charts in my analysis.
Gold Trading Strategy June 27✏️The price reaction at 3348 forms a sustainable bearish structure. 3296 is an important zone when broken, it will continue to fall deeply without any recovery on Friday.
Today the downtrend will encounter less resistance than the uptrend. Therefore, it is not difficult to touch the support zones of 3278 and 3255.
Any recovery in the price in the European session is considered a good opportunity for a Sell signal towards the target of 3278 and 3255.
As analyzed, the SELL zone today is noted at many resistance zones and consider the price reaction for the SELL signals.
📈 Key Levels
Break out: 3296
Support: 3278-3255
Resistance: 3300-3312-3325-3336-3348-3363
📊 Recommended Trade Setups
BUY 3278-3276 SL 3272
SELL 3325-3327 SL 3330

Gold Rebound Underway – Support Zone Holds Strong! - Short termGold( OANDA:XAUUSD ), as I anticipated in the previous idea , has attacked the Support zone($3,281-$3,243) and Support lines .
From an Elliott Wave theory perspective , it appears that Gold has completed 5 sub-waves of the main wave C .
Also, we can see the Regular Divergence(RD+) between Consecutive Valleys.
I expect Gold to rise to at least $3,307 in the coming hours.
Second Target: $3,321
Note: Stop Loss (SL) = $3,240
Gold Analyze (XAUUSD), 1-hour time frame.
Be sure to follow the updated ideas.
Do not forget to put a Stop loss for your positions (For every position you want to open).
Please follow your strategy; this is just my idea, and I will gladly see your ideas in this post.
Please do not forget the ✅ ' like ' ✅ button 🙏😊 & Share it with your friends; thanks, and Trade safe.

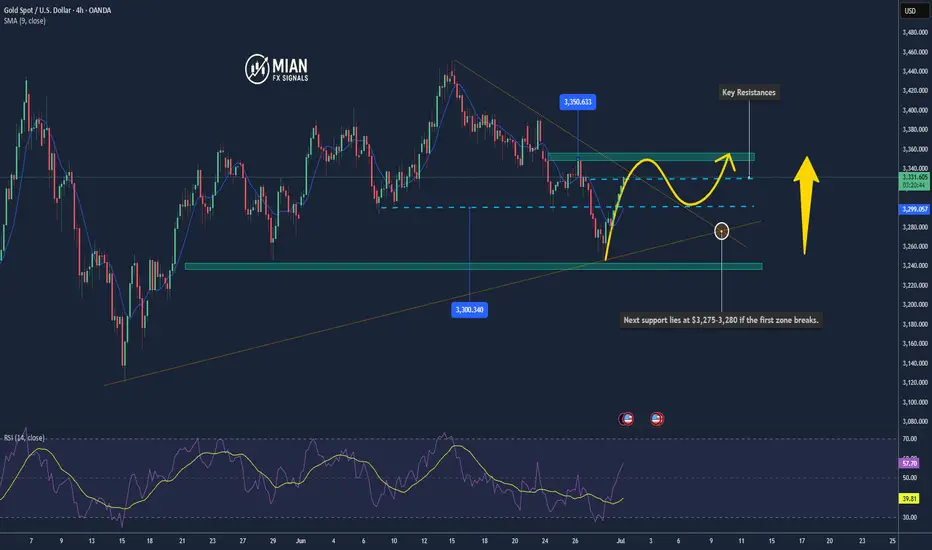
Gold Might Break Higher As It Hits $3,330 Resistance📊 Market Drivers
Gold has just climbed to $3,330/oz, supported by ongoing safe-haven demand and a slightly weaker U.S. dollar ahead of Fed Chair Powell’s speech. Investor expectations of a rate cut in September are keeping bullish momentum alive.
________________________________________
📉 Technical Analysis
• Resistance:
→ $3,330–3,335 (50-day SMA & Fibonacci level)
A breakout above $3,335 could open the door to $3,350+.
• Support:
→ $3,300–3,310 (psychological level & EMA9)
→ Next support lies at $3,275–3,280 if the first zone breaks.
• EMA09:
Price is currently above the 9-EMA, confirming a short-term bullish trend.
• Momentum Indicators:
o MACD is bullish; Stochastics is high — all signaling upside, though a short-term pullback may occur if the resistance holds.
________________________________________
📌 Outlook
Gold is likely to continue climbing in the short term if it breaks above the $3,330–$3,335 resistance zone, fueled by bullish sentiment and dovish Fed expectations.
If it fails to break higher, a minor correction toward $3,300–$3,310 could follow.
________________________________________
💡 Suggested Trade Strategy
BUY XAU/USD : $3,320–3,325
🎯 TP: 40/80/200 pips
❌ SL: $3,310
SELL XAU/USD : $3,340–3,345
🎯 TP: 40/80/200 pips
❌ SL: $3,350
Gold Bounces from Demand Zone – Next Targets in Sight!By analyzing the gold chart on the 4-hour timeframe, we can see that today, price once again dipped into our key demand zone (Bullish Rejection Block) between $3245 and $3262, where it faced strong buying pressure and rallied up to $3296.
Currently, gold is trading around $3281, and as long as price holds above $3273, we expect further upside. The next potential targets are $3294, $3300, and $3309.
🎥 If you enjoyed this video analysis and found it helpful, please show your support with a LIKE and COMMENT below!
These video-style breakdowns take time and effort, and I’ll only continue them with your support 🙌
Your engagement is my biggest motivation to keep going 💛
Thanks for being part of the journey!

The bearish trend is confirmed, it’s time to participate.Gold overnight short orders have been stopped at a loss, because it broke through the key pressure of 3325. However, we must grasp the trend of the market, adhere to the idea of technical analysis as the main and news as the auxiliary, and make a comprehensive judgment. Don't be at a loss about the market analysis because of the stop loss. There is nothing wrong with waiting for the market to step back and do more, but the market does not give opportunities, but forces you to chase the rise. Of course, from the perspective of risk ratio, high altitude is definitely more stable than chasing more.
From the current gold trend analysis, the focus on the upper side is the 3340-3350 line of pressure, the short-term support on the lower side is around 3310-3320, and the key support on the 3295-3301 line is focused. Relying on this range as a whole, the main tone of high-altitude and low-multiple participation remains unchanged. In the middle position, it is recommended to wait and see, chase orders cautiously, and wait patiently for key points to enter the market.
Operation strategy 1: Short gold near 3340-3350, target 3325-3315.
Operation strategy 2: Go long on gold around 3310-3320, target 3330-3340.

Gold encounters resistance at 3310-3320 and is about to fallAt present, gold has reached the 3300-3320 area as expected. As I mentioned in my previous article, we can consider shorting gold in batches in the 3300-3320 area;
Although gold once rebounded and stood above 3300, we can clearly see that when facing the short-term resistance area of 3310-3320, the bullish energy of gold has converged and began to show signs of stagflation, so the short-term resistance area of 3310-3320 is still valid.
Before gold breaks through 3310-3320, gold bears still have the upper hand. So as long as gold stays below 3310-3320 in the short term, don't be afraid of gold rebounds. Rebounds are opportunities to short gold. So I still tend to short gold at present, and have opened short gold positions according to the trading plan, hoping that gold can retreat to the target area: 3285-3275-3265. Do you think gold will fall as expected?

Short gold, it will fall again when encountering resistanceIn the short term, gold retreated to around 3274 and then rebounded again, and it is only one step away from 3300. Will gold regain its bullish trend again?
I think it is difficult for gold to break through in the short term. Although gold retreated to around 3274 and successfully built a double bottom structure with the second low point and the low point of 3245, it only increased the rebound space; it is not enough for gold to regain its bullish trend. Since gold fell and broke through, the confidence of bulls has been hit hard. The previous support at the technical level has formed a strong resistance area after the top and bottom conversion, and to a certain extent helped the short force. In the short term, gold faces resistance in the 3310-3320 area. Before gold breaks through this area, the short energy still has the upper hand.
Therefore, shorting gold is still the first choice for short-term trading.
It is appropriate to consider shorting gold in batches in the 3300-3320 area, and look at the target: 3385-3375-3365

Gold Faces Resistance Near $3,300 Ahead of U.S. Jobs Data📊 Market Highlights:
Gold holds firm above $3,280 supported by expectations of future Fed rate cuts, but upside momentum has stalled as traders await this Friday’s U.S. jobs report. A slight rebound in the U.S. dollar and elevated bond yields are pressuring gold in the short term.
📉 Technical Analysis:
• Key Resistances:
– $3,300 (strong psychological and profit-taking level)
– $3,320 (last week’s high – potential heavy selling zone)
• Key Supports:
– $3,255 (short-term dynamic support – EMA 09)
– $3,230 (major support from previous breakout structure)
• EMA 09: Price remains above the 09 EMA → trend still bullish
• Momentum: The bullish momentum is weakening. A shooting star candle near $3,300 and RSI approaching overbought territory (>70) suggest a possible short-term correction.
📌 Outlook:
Gold may retreat to $3,255 or lower if it fails to break above the $3,300–$3,320 resistance zone. However, the overall bullish trend remains intact as long as price holds above $3,230.
💡 Suggested Trade Setup:
🔻 SELL XAU/USD at: $3,295 – $3,300
🎯 TP: 40/80/200 pips
❌ SL: $3,305
🔺 BUY XAU/USD at: $3,255 – $3,260
🎯 TP: 40/80/200 pips
❌ SL: $3,245

XAU/USD Trade Setup – June 30, 2025📉 XAU/USD Trade Setup – June 30, 2025
Bias: Short (Sell Position)
Entry Zone: Around $3,363–$3,370
Stop-Loss: 🔺 $3,259 (Above recent highs)
Take-Profit 1: 🎯 $3,308
Take-Profit 2: 🎯 $3,302
Risk/Reward: Favorable (1.8–2.2:1 depending on entry)
🔍 Technical View
Trend: Bearish below $3,370
Structure: Price rejected key resistance at $3,370–$3,380
Indicators:
RSI weakening near 50 (bearish bias)
MACD crossing down on H1
Key Zone: A break and close below $3,350 will likely drive price toward your TP zones at $3,308 and $3,302.
⚠️ Notes
Volatility expected near NY session open or if macro data hits (e.g. Fed speakers, inflation prints)
Consider scaling out partial profits at TP1 ($3,308) to lock gains

XAUUSD Channel Down starting new Bearish Leg.Gold (XAUUSD) has been trading within a 2-week Channel Down, recently rejected on its 4H MA50 (blue trend-line). The last Lower High was priced on the 0.5 Fibonacci retracement level, so currently we are on the ideal level for a new short.
With a 4H Death Cross emerging, we are targeting the 1.382 Fibonacci extension (as the previous Bearish Leg did) at 3210 for the Channel's new Lower Low.
-------------------------------------------------------------------------------
** Please LIKE 👍, FOLLOW ✅, SHARE 🙌 and COMMENT ✍ if you enjoy this idea! Also share your ideas and charts in the comments section below! This is best way to keep it relevant, support us, keep the content here free and allow the idea to reach as many people as possible. **
-------------------------------------------------------------------------------
Disclosure: I am part of Trade Nation's Influencer program and receive a monthly fee for using their TradingView charts in my analysis.
💸💸💸💸💸💸
👇 👇 👇 👇 👇 👇

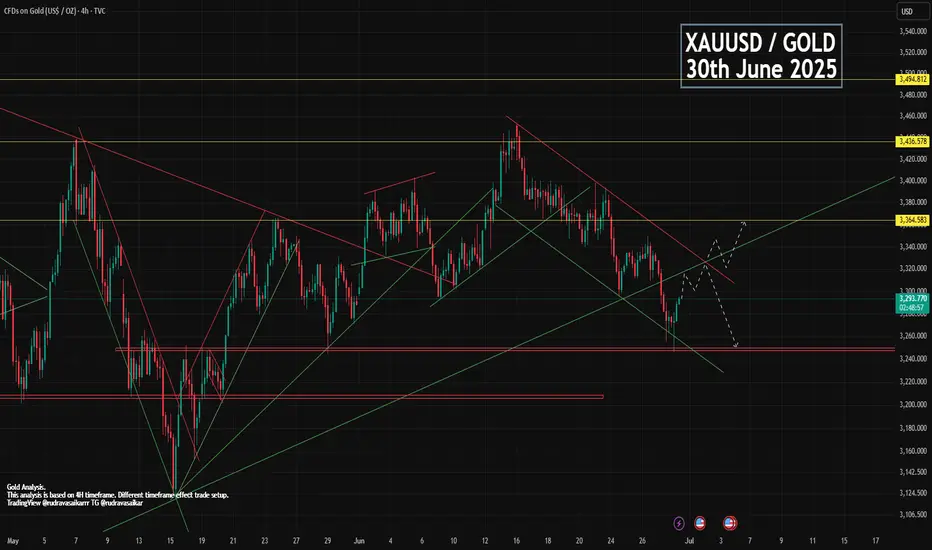
GOLD 30th JUNE - MONTH-END BULLISH OR BEARISHDue to war no update on gold, gold made bolt move downward. Slowly war has been becoming calm but no good news about it has been stopped completely. But you can see some great and correct structure in gold chart where you can find amazing entry and exit points. Gold lower was 1246 since then. Now gold is trading in bullish flag and expecting to breakout. And after breakout we can expect a big move upward.
Key point.
Support - 3248, 3272, 3289
Resistance - 3298, 3313, 3332, 3349
Comment and like for analysis. Love it then follow
Any Query Reach Us or comment down.
Follow for more updates.
Rudra Vasaikar Wishes You A Great And Very Amazing Trading Life. Trade Safe, Trade Right.
RISK WARNING 🔴 🔴 🔴
There is high risk of loss in Trading Forex, Crypto, Indices, CFDs, Features and Stocks. Choose your trade wisely and confidently, please see if such trading is appropriate for you or not. Past performance is not indicative of future results. Highly recommended - Information provided by Rudra Vasaikar/Pro Trading Point are for Educational purpose only. Do your investment according to your own risk. Any type of loss is not our responsibility.
HAPPY TRADING.
Gold continues to be weak, but be careful about operations
📣Gold prices fell 2% last Friday, hitting a near one-month low. Optimistic trade-related agreements boosted risk appetite and weakened the attractiveness of gold as a safe-haven asset. This week, the market will usher in a group meeting of major central bank governors around the world (Fed Chairman Powell, European Central Bank President Lagarde, Bank of England Governor Bailey, Bank of Japan Governor Kazuo Ueda, and Bank of Korea Governor Lee Chang-yong). The market will also usher in non-agricultural data. In addition, Powell's remarks on whether to resign may ignite the market this week. Gold prices may fluctuate more around the lower track of the Bollinger Band at $3,270/ounce this week.
Technical analysis:
Last Friday, the K-line had a lower shadow, and the Bollinger Band did not diverge. It is not easy to go short directly in operation, but wait for the rebound to confirm 3295 and the key resistance of ma5 to be short.
💰 Operation strategy: Rebound to 3280-3283 to go short, target 3270-3265, stop loss 3288-3290

XAUUSD Analysis todayHello traders, this is a complete multiple timeframe analysis of this pair. We see could find significant trading opportunities as per analysis upon price action confirmation we may take this trade. Smash the like button if you find value in this analysis and drop a comment if you have any questions or let me know which pair to cover in my next analysis.

GOLD (XAUUSD): Your Trading Plan for Monday
Gold went strongly rejected from a key daily support on Friday.
Your confirmation signal for a pullback trade from that will
be a bullish breakout and an hourly candle close above
3283 intraday resistance.
After that the price will likely reach 3292 level.
❤️Please, support my work with like, thank you!❤️
I am part of Trade Nation's Influencer program and receive a monthly fee for using their TradingView charts in my analysis.
