Gold Consolidates Around $3,340–Mild Bullish Bias Ahead CPI Data📊 Market Summary
Gold is consolidating around $3,340/oz, up about 0.5% today, as investors seek safe-haven assets amid ongoing US–China trade tensions. The market is also closely watching the upcoming U.S. CPI data release.
📉 Technical Analysis
Key Resistance:
• $3,350–3,360 – recent swing highs, aligning with the intraday EMA50 and Fibonacci resistance.
• $3,370–3,380 – major monthly high, potential breakout zone.
Nearest Support:
• $3,320–3,330 – EMA20–21 zone, daily support and key pivot level.
• Below $3,320, next support lies near $3,300.
EMA 09:
• Price is trading above EMA9 but still below EMA21–50 → suggests neutral-to-slightly bullish intraday bias.
Candlesticks / Volume / Momentum:
• Small-bodied candles with low volume → signs of sideways movement.
• RSI on H1 ~60, H4 ~55 → modest upward momentum, not yet overbought.
📌 Outlook
Gold is likely to continue consolidating around $3,340, with mild upside potential if the U.S. CPI data comes in hot or trade talks remain inconclusive.
💡 Suggested Trading Strategy
SELL XAU/USD at: $3,350–3,355
🎯 TP: $3,330–3,335
❌ SL: $3,360
BUY XAU/USD at: $3,320–3,330
🎯 TP: $3,340–3,345
❌ SL: $3,310
Goldsignals

The gold trend is perfectly in line with expectations.The recent trend of gold is consistent with my expectations. Overall, the rebound is mainly based on fluctuating downward, and the rhythm of the oscillation between long and short positions is perfectly grasped. The upper resistance is still strong, and gold can still be shorted if the rebound is not broken.
From the current analysis of the gold trend, the lower support focuses on the area around 3315-3305. If it falls back to this position range, continue to look at the continuation of the rebound upward; the upper resistance focuses on the area around 3350-3362. The overall rhythm of the high-altitude and low-multiple range is still maintained, and the strategy is mainly to participate in the range back and forth.
1. Go long when gold falls back to 3315-3305, and the target is 3330-3340;
2. Go short when gold rebounds to 3350-3360, and the target is 3340-3330.

Gold rebound is still a short-selling opportunityFirst of all, let's take a look at why the market is still not reversing after a big rise, and there is a rapid rise and fall?
The data is bullish, and gold is rising rapidly, but we should pay attention to the sustainability of the rise, and secondly, the current trend direction. The overall trend of gold is still fluctuating downward recently, so even if the data is bullish, it is likely to just give an opportunity to "go high and short".
Although gold performed strongly after the data was released, it began to fall under pressure at the 3360 line, the trading concentration area of the last box shock, indicating that the bulls' volume is still not enough to break through the upper resistance. It is reasonable to rise and fall.
Since gold is currently in a market that is tempting to buy more, it means that the main trend is still bearish. The rebound is still dominated by short selling. The gold 1-hour cycle closed with a long upper shadow, indicating that the upward attack is weak, indicating that the area above 3350 is still a strong pressure area. This upward rush is just a short-term effort with the help of data benefits, which is a typical false breakthrough. Therefore, gold rebounded to the 3350-3360 area in the US market, and it is still dominated by high shorts.
This is the charm of the market - some people are always hesitant in the ups and downs, while others can always grasp the key turning points. The premise is to be able to see the trend clearly and follow the trend.
Don't be led by the market, but understand: Is the current fluctuation a trap or an opportunity?
If the direction is wrong, the effort will be in vain; if the direction is right, you will get twice the result with half the effort.
Don't make excuses for failure, just find ways to succeed. Have you found it?
All recent trading strategies and ideas have been realized, and the point predictions are accurate. If your current gold operation is not ideal, we hope to help you avoid detours in your investment. Welcome to communicate with us!

XAUUSD Top-down analysis Hello traders, this is a complete multiple timeframe analysis of this pair. We see could find significant trading opportunities as per analysis upon price action confirmation we may take this trade. Smash the like button if you find value in this analysis and drop a comment if you have any questions or let me know which pair to cover in my next analysis.

Gold V-shaped reversal still has room to rise In the morning, the market was under pressure at 3328, and two consecutive big negative lines fell to the low of 3302, breaking through the lower track of the descending flag consolidation channel, forming an effective break. 3317 was originally the confirmation point of the channel counter-pressure, and it was also the 618 split resistance at the time. Then the middle track was lost, and the trend was bearish, so it tried to rebound but continued to fall under pressure.
But the market immediately made a V-shaped reversal, breaking through the morning high of 3328, and had attacked to 3342 before the US market. The European session was volatile and strong, and with the help of a pullback before and after the U.S. session to lure short sellers, there is still hope for a second rise
The focus of the support for the retracement is on two positions: one is the 3322 line, corresponding to the middle track and 50% split support; the other is 3318, corresponding to the 618 split support. If it stabilizes after touching it, it will most likely point to the 3348 counter-pressure position.
If the pressure of 3348 cannot be broken, there is still a possibility of repeated fluctuations in the short term. It is necessary to pay attention to whether the secondary low point appears when it pulls back to further consolidate the support structure. If the market directly breaks through and stands above 3348, 3293 may have been confirmed as a short-term low.
The recent trading strategy ideas are all realized, and all the points are predicted accurately. If your current gold operation is not ideal, I hope I can help you avoid detours in your investment. Welcome to communicate with us!

XAUUSD 200 pip FVG drop?XAUUSD Finally started to break below to the major direction of the trend. After crossing the daily high, price started to break below upon retest of the neck line of the 4H head and shoulder.
As the market has got rejected from daily resistance we see possible drop back to daily low or even test of the strong liquidity zone on the monthly support level.
Upon price action confirmation, a sell trade is high probable

Perfect grasp of the high altitude and low multi rhythm!The current trend of gold continues yesterday's trend, maintaining a high rebound and volatile market. But don't panic, focus on the performance of the rebound. If the rebound fails to break through the upper resistance level, continue to focus on shorting. The upper suppression area is locked at the 3335-3345 line. Although the bullish performance has been strengthened, if it cannot effectively break through this range, it is still a short-term weak signal. From the current market, the upper pressure is obvious, and the rebound can rely on this range to layout the main short, focusing on the continuation of the decline. The lower support focuses on the 3293-3300 integer mark, and the overall long and short wide range of volatile market is maintained. Before the daily level fails to effectively break through and stand firm at the 3345 mark, it is difficult to say that the bulls will turn strong, and operations need to be cautious. If the market adjusts, the strategy will be updated simultaneously.
Operation strategy suggestion: Gold rebounds to the 3335-3345 first-line area to choose the opportunity to short, target the 3295-3306 range, strictly control risks, and follow the trend.

$Gold Fills the Gap – Is a Bullish Bounce Toward $3350 Next?By examining the gold chart on the 4-hour timeframe, we can see that in last week’s analysis, the price successfully hit all four targets: $3338, $3332, $3326, and $3317, and finally closed on Friday at $3309. This move delivered over 390 pips of return, and I hope you made the most out of it!
Now, let’s move on to the latest gold analysis: As you can see, today gold dropped to the $3294 zone, finally filling the liquidity gap previously marked on the chart. Currently, gold is trading around $3315, and I expect further bullish movement toward the $3330 area as the first upside target.
After that, we should closely watch the $3332–$3352 zone for a potential corrective reaction.
There are more details in this analysis that I’ll share soon — with your support!
THE MAIN TA :

Gold at risk if US–China talks fail📊 Market Overview:
• Spot gold is trading around $3,309–$3,311/oz (according to TradingEconomics, Kitco…), slightly down by 0.5% as markets await the outcome of US–China trade talks in London.
• The US dollar has eased following some positive signals from the talks, but overall market caution remains high ahead of the June 11 CPI release and the upcoming Federal Reserve decision.
📉 Technical Analysis:
• Key resistance: $3,340 (June consolidation ceiling); further upside at $3,353–$3,370 if a breakout occurs.
• Nearest support: $3,298 (monthly pivot); if breached, price may move toward $3,270 → $3,243.
• EMA09/EMA20/EMA50: Price is trading below the short- to mid-term EMAs, indicating a consolidating or slightly bearish trend.
• Candlestick/momentum: Sideways structure within $3,298–$3,332; weak momentum. RSI and Stochastic are below mid-levels, signaling market caution.
📌 Outlook:
• Gold may continue to consolidate or edge lower in the short term if the US–China negotiations fail to deliver a significant breakthrough and no strong bullish data emerges.
• Conversely, any signs of renewed tension, failed trade talks, or unexpectedly high inflation figures could reignite bullish momentum and push prices back toward the $3,332–$3,370 range.
________________________________________
💡 Trade Strategy Suggestion:
➡️ SELL XAU/USD
Entry: $3,330–$3,335
• 🎯 TP: ~$3,310
• ❌ SL: $3,345
➡️ BUY XAU/USD
Entry: $3,298–$3,305
• 🎯 TP: ~$3,320
• ❌ SL: $3,288
Gold fluctuates repeatedly, hiding great opportunities!After the opening of gold today, the bulls and bears played fiercely. In the early trading, it fell to 3293 and received temporary support, then stabilized and rebounded. It broke through the high point of 3320 in the Asian session and continued to rise above 3330. However, the price was under obvious pressure near 3330, and the momentum indicators (MACD, RSI) showed a top divergence at the same time, reflecting the exhaustion of bullish momentum and limited short-term upside space.
From the technical structure, gold has effectively fallen below the middle track support of the H4 cycle, and at the same time lost the upward trend line built since the low point in June. The two breakout positions are highly overlapped, constituting an obvious technical weakening signal. The current trend is trapped in the key resistance suppression area, and it is expected to enter a high-level shock and weakening stage.
The operation suggestions are as follows:
🔸Strategy direction: short-term thinking
🔸Entry area: 3335–3345 range
🔸Defense reference: stop loss above 3350
🔸Target expectation: look down to 3305, break to 3293 or even 3280 near the extension support
In terms of fundamentals, the US dollar index is under short-term pressure, mainly due to the decline in the US fiscal outlook and US Treasury yields; but the non-agricultural data boosted economic resilience, which cooled the market's expectations for a rapid rate cut this year, restricting the rebound space of gold prices. Although risk aversion has support, it has not yet become a dominant driver. The current market sentiment remains cautiously neutral.
Overall judgment: The short-term rebound of gold prices is limited, and the short-term trend is gradually released after the structural break. It is recommended to follow the trend and go high, control risks, and steadily execute trading plans.

xauusd weekly analysis
**XAU/USD Weekly Analysis**
*(June 2-13, 2025)*
---
### **LAST WEEK'S PERFORMANCE (June 2-6)**
**Price Action:**
- Weekly decline: **~2%**
- Key levels:
- Resistance: $3,355–$3,381 (61.8% Fibo)
- Support: $3,272–$3,288 (38.2% Fibo)
- Range: $3,291.50 (low) to $3,365 (high)
- Close: Near $3,310–$3,316
**Key Drivers:**
1. **USD Strength**: Fiscal concerns (Senate tax bill debate adding $3.8T debt)
2. **Reduced Safe-Haven Demand**: Trump delayed EU tariffs to July 9
3. **Central Bank Caution**: Market awaited ECB/BoC decisions and U.S. jobs data
---
### **NEXT WEEK OUTLOOK (June 9-13)**
**Critical Technical Levels:**
| **Support** | **Resistance** |
|-------------------|-------------------|
| $3,272–$3,288 | $3,370–$3,375 |
| $3,295 (SMA) | $3,381 (Key Breakout) |
| $3,210–$3,214 | $3,400–$3,434 |
**Fundamental Catalysts:**
1. **Central Banks**:
- ECB Decision (June 12) → Dovish stance = USD strength
- BoC Decision (June 11) → Rate cuts may boost USD
2. **U.S. Data**:
- Non-Farm Payrolls (June 13) → Strong data = fewer Fed rate cuts
3. **Geopolitical Risks**:
- Escalations in Ukraine/Middle East → Safe-haven demand
4. **U.S. Fiscal Policy**: Senate vote on $3.8T tax bill
**Market Sentiment:**
- **Bullish Case**: Break above $3,381 targets $3,500–$3,800
- **Bearish Risks**: Breakdown below $3,272 risks drop to $3,160
---
### **TRADING STRATEGY**
**Key Approaches:**
- **🔺 Long Setup**:
- Entry: Above $3,381
- Target: $3,500
- Stop-loss: $3,320
- **🔻 Short Setup**:
- Entry: Below $3,272
- Target: $3,210
- Stop-loss: $3,310
- **Event Hedging**: Use options around ECB/BoC/NFP events
**Risk Management Note:**
> "Gold's trajectory hinges on USD dynamics and central bank guidance. A weekly close above $3,381 confirms bull trend resumption."
---
### **KEY EVENTS CALENDAR**
| Date | Event | Impact Level |
|------------|---------------------------|--------------|
| June 11 | Bank of Canada Rate Decision | High |
| June 12 | ECB Rate Decision | High |
| June 13 | US Non-Farm Payrolls | Very High |
| Mid-week | US Senate Tax Bill Vote | Moderate-High|
---
**Conclusion:**
Next week presents a binary setup for XAU/USD:
- Break above **$3,381** opens path to $3,500+
- Failure to hold **$3,272** risks correction to $3,210
Prioritize risk management during high-impact events. The long-term uptrend remains intact but short-term direction depends on USD and central bank policy.
for intra day traders and scalpers follow the range zone

Rebound is a good opportunity to short goldGold gradually rebounded after touching 3295. The highest price has rebounded to 3338. Although the rebound has reached $43, the upward momentum is not strong during the rebound. Therefore, the current rebound cannot be confirmed as a reversal trend. Moreover, gold has not yet effectively broken through the 3330-3340 area. Gold is still weak in the short term. Gold still has the potential to fall after the rebound. It will at least retest the 3315-3305 area again.
Therefore, there is no need to fear the rebound of gold for the time being. The rebound of gold is a good opportunity to short gold. I think gold will at least retest the 3315-3305 area again, and even exceed expectations to the area around 3280. Shorting gold is the password for profit in the short term!

Gold May See Short-Term Correction As US-China Talks Loom💡 Suggested Trading Strategies
SELL XAU/USD at: $3,320 – $3,326
🎯 TP: $3,300
❌ SL: $3,330
BUY XAU/USD at: $3,296 – $3,300
🎯 TP: $3,320
❌ SL: $3,290
📊 Market Summary
Gold prices have been volatile recently due to high-level trade negotiations between the US and China. Investors are cautious as a potential breakthrough could ease tensions and reduce safe-haven demand for gold.
📌 Outlook
Gold may decline slightly toward the $3,296–$3,300 range if no breakthrough is achieved in US-China talks. However, a positive outcome could trigger a rebound toward the $3,326–$3,340 zone.

XAUUSD rising while Inflation dropping. Historically BULLISH!Gold (XAUUSD) has been practically on a non-stop aggressive rise since the late 2022 Low. What's more interesting is that during this 2.5-year Bull run, the U.S. Inflation Rate (red trend-line) has been on a sharp decline, which is something you wouldn't traditionally expect out of a save haven asset like Gold.
On the contrary, Gold has been historically used as a hedge against high inflation, so when Inflation drops, you would have technically expected for Gold to drop too (and vice versa).
Since 1970, there have only been another 4 (relatively long) time periods when Inflation declined while Gold increased. On all occasions, Gold extended the rise by at least 1 year even when Inflation reversed.
In our opinion, the current divergence looks more like 1970 - 1972 and 2008 - 2009. This suggests that Gold is still within a Bull Cycle and has some more room to rise before a new Bear Cycle starts. Long-term we remain bullish on Gold.
-------------------------------------------------------------------------------
** Please LIKE 👍, FOLLOW ✅, SHARE 🙌 and COMMENT ✍ if you enjoy this idea! Also share your ideas and charts in the comments section below! This is best way to keep it relevant, support us, keep the content here free and allow the idea to reach as many people as possible. **
-------------------------------------------------------------------------------
💸💸💸💸💸💸
👇 👇 👇 👇 👇 👇

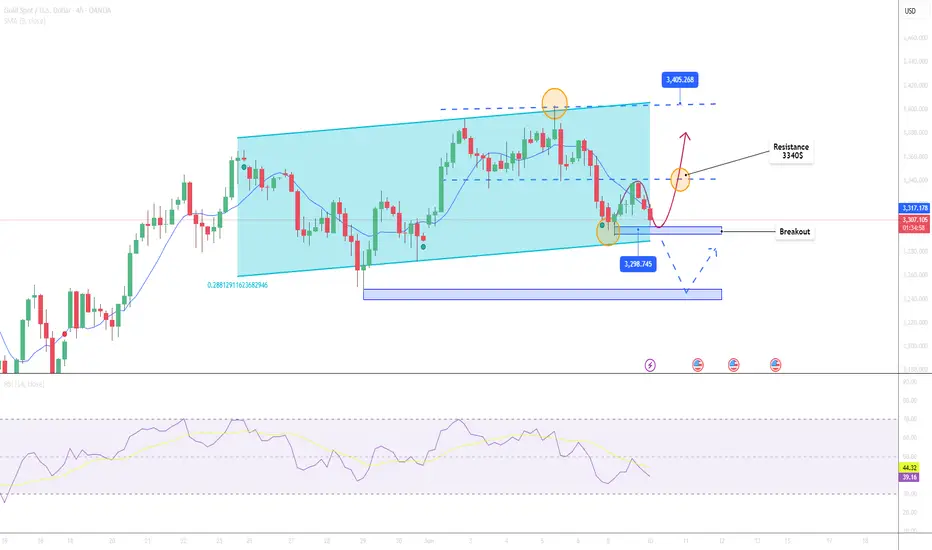
Potential Breakdown with Retest or Reversal Zone –This chart represents a classic Double Top pattern, a bearish reversal signal indicating strong resistance around the 3,380 - 3,390 USD zone (marked with two white circles).
---
🔍 Key Zones and Levels:
1. Resistance Zone (~3,380 - 3,390 USD):
Price was rejected twice here.
Suggests strong selling pressure and buyer exhaustion.
2. Mid Support/Retest Zone (~3,337.857 USD):
Marked with a horizontal white line.
Could act as a short-term resistance if price retraces.
3. Demand Zone (~3,330 - 3,337 USD):
Highlighted green box: potential reversal/retest zone.
Bullish scenario: price bounces from here and heads back to retest resistance.
4. Current Price (~3,309.980 USD):
Price has broken below the demand zone and is approaching strong horizontal support.
5. Lower Support (~3,265 - 3,270 USD):
Highlighted with blue horizontal lines and purple arrows.
Could be the next bearish target if breakdown is confirmed.
---
🔄 Two Possible Scenarios:
📉 Bearish Continuation:
Price retests the broken demand zone (now resistance).
Rejects and forms a lower high.
Falls toward the lower support around 3,265–3,270 USD.
📈 Bullish Reversal:
Price reclaims the green demand zone.
Pushes above 3,337.857 USD level.
Heads back to retest the double top area (~3,380 USD).
---
✅ Conclusion:
The bias is currently bearish, supported by:
Double top formation.
Breakdown below key demand zone.
Momentum favoring further downside.
However, a bullish reversal is possible if price reclaims the 3,337 USD zone and shows strong bullish structure.

Gold Rejected at Resistance, Targets $3,305 & Below Gold ( OANDA:XAUUSD ) rose to $3,400, as I expected in my previous idea .
Gold is trading near the Resistance zone($3,387-$3,357) and has failed to break the resistance zone validly .
In terms of Elliott Wave theory , it seems that Gold has managed to complete the microwave 5 of the main wave C with the help of Expanding Ending Diagonal . It was a corrective Zigzag(ABC/5-3-5) structure .
Also, we can see the Regular Divergence(RD-) between Consecutive Peaks.
I expect Gold to touch $3,305 after breaking the lower line of the ascending channel at the first target and then decline to the Support zone($3,281-$3,245) and Monthly Pivot Poin t.
Note: Stop Loss(SL)= 3394.000
Gold Analyze ( XAUUSD ), 4-hour time frame.
Be sure to follow the updated ideas.
Do not forget to put a Stop loss for your positions (For every position you want to open).
Please follow your strategy; this is just my idea, and I will gladly see your ideas in this post.
Please do not forget the ✅' like '✅ button 🙏😊 & Share it with your friends; thanks, and Trade safe.

Can Gold Reach $3400 This Week?📊 Market Overview:
On June 4, 2025, gold prices (XAU/USD) hovered around $3,370/oz after rebounding from the $3,333 level. However, selling pressure emerged as prices approached the strong resistance zone near $3,392–$3,400. Ongoing uncertainties regarding U.S.–China trade policies and expectations of a Federal Reserve rate cut continue to support safe-haven demand for gold.
📉 Technical Analysis:
• Key Resistance: $3,392 – $3,400
• Nearest Support: $3,333 – $3,320
• EMA 09: Price is currently above the 09 EMA, indicating a short-term uptrend.
• Candlestick Patterns / Volume / Momentum: The RSI on the H1 timeframe is at 59, suggesting bullish momentum remains but is approaching overbought territory.
📌 Outlook:
Gold may experience a short-term pullback if it fails to break above the $3,400 resistance level and profit-taking intensifies.
💡 Suggested Trading Strategy:
SELL XAU/USD at: $3,392 – $3,400
o 🎯 TP: $3,372
o ❌ SL: $3,410
BUY XAU/USD at: $3,320 – $3,333
o 🎯 TP: $3,352
o ❌ SL: $3,310

XAUUSD Analysis todayHello traders, this is a complete multiple timeframe analysis of this pair. We see could find significant trading opportunities as per analysis upon price action confirmation we may take this trade. Smash the like button if you find value in this analysis and drop a comment if you have any questions or let me know which pair to cover in my next analysis.

Gold Analysis with Signals
For the beginning of the market, we expect the price correction to continue to the specified support levels (buy signals), which will be completed until the downward channel is broken, and after collecting liquidity, we will continue to see the price rise. The 4-hour minor ceiling still has buyers' liquidity that has not been settled.
Gold May Undergo Short-Term Correction Near Resistance Levels📊 Market Overview:
As of June 6, 2025, gold prices have surged, trading around $3,373 per ounce, up $26.63 from the previous session . This increase is driven by weaker-than-expected U.S. job data, with initial jobless claims rising to 247,000, surpassing the forecast of 236,000 . This has heightened expectations that the Federal Reserve may consider cutting interest rates in the near future.
📉 Technical Analysis:
• Key Resistance Levels: $3,390 – $3,430
• Nearest Support Levels: $3,340 – $3,300
• EMA: Gold prices are currently above the 09 EMA, indicating a sustained upward trend.
• Candlestick Patterns / Volume / Momentum: The RSI on the 4-hour chart is at 58.27, suggesting that while bullish momentum persists, the market is approaching overbought territory .
📌 Outlook:
Gold may experience a short-term correction if U.S. employment data is strong, reducing expectations for Fed rate cuts. However, the long-term uptrend remains supported by safe-haven demand and central bank purchases.
💡 Suggested Trading Strategy:
SELL XAU/USD at: $3,430
o 🎯 TP: $3,400
o ❌ SL: $3,440
BUY XAU/USD at: $3,330
o 🎯 TP: $3,360
o ❌ SL: $3,220

Gold Rejected Below $3370 — Eyes on Lower Demand Zones! (READ)By examining the gold chart on the 4-hour timeframe, we can see that after our previous analysis, the price climbed to $3388, giving us nearly 150 pips of return. However, gold was rejected from that level and failed to hold above $3370, eventually dropping below $3360.
Currently, gold is trading around $3348, and we may likely see further decline toward lower levels. The potential downside targets are $3338, $3332, $3326, and $3317.
Key demand zones to watch are:
→ $3327
→ $3311
→ $3298–$3300
→ $3278
Please support me with your likes and comments to motivate me to share more analysis with you and share your opinion about the possible trend of this chart with me !
Best Regards , Arman Shaban

XAUUSD NFP Analysis todayHello traders, this is a complete multiple timeframe analysis of this pair. We see could find significant trading opportunities as per analysis upon price action confirmation we may take this trade. Smash the like button if you find value in this analysis and drop a comment if you have any questions or let me know which pair to cover in my next analysis.

VIP GOLD Analysis: Reversal & Breakout Zones Mapping + Target🧠 1. Black Mind Curve Resistance – The Psychological Ceiling
A uniquely drawn parabolic curve, referred to here as the Black Mind Curve, acts as a dynamic resistance level. Price has tested this curve multiple times, rejecting it consistently — a clear signal that this area holds institutional selling interest.
This resistance line is not static; it follows a natural flow of market psychology — early buyer excitement, mid-trend optimism, and late buyer FOMO, all fading around the curve. Until this is broken with volume, it continues to act as a ceiling for bullish rallies.
🏆 2. Cup & Handle Pattern – Bullish Continuation Setup
Notice the beautifully forming Cup & Handle-like structure:
The Cup represents a rounded consolidation bottom formed between May 27 and June 3.
The Handle shows a light pullback and reaccumulation, preparing for a potential breakout.
This is a classic bullish continuation pattern. A breakout above the handle — especially above 3,390–3,400 — can unleash a powerful upside rally.
📌 Breakout Entry Zone: 3,390+
🎯 Targets after breakout: 3,420 / 3,450 / 3,470
🛑 Invalidation: Break below 3,280
📉 3. Trendline Support – The Bullish Backbone
An upward sloping trendline support is holding the structure intact. Every time price retraced, it respected this trendline, making it a key bullish bias line. A breakdown below it may signal weakness, but until then, buyers are in control.
🌀 4. Reversal Zones – Marking the Battlefield
Mini Reversal Zone (3,330–3,345): Where short-term scalpers look for small bounces or rejections.
Major Reversal Zone (3,280–3,300): Strong institutional support is expected here if price dips. Look for bullish engulfing or pin bars in this area to catch sniper entries.
💼 5. Pro Trading Plan (VIP Zone Insight):
➡️ Bullish Scenario (Preferred):
Watch for bounce from Major Reversal Zone or breakout above 3,390
Entry: On bullish engulfing candle or breakout confirmation
Stop Loss: Below 3,270 or below handle low
Targets: TP1 – 3,420 / TP2 – 3,450 / TP3 – 3,470+
⬅️ Bearish Scenario (If Trendline Breaks):
Short on clean breakdown of trendline and retest
Entry: Below 3,270 with confirmation
Targets: TP1 – 3,240 / TP2 – 3,210
Risk: Avoid entering into reversal zones without confirmation
🔥 Why This Setup Matters:
This chart combines psychological resistance, classic technical patterns, and institutional zones. The confluence gives high probability signals for both swing traders and intraday scalpers.
📊 Whether you're a price action trader or a pattern-based analyst, this setup is screaming for attention. Stay sharp, manage risk, and wait for confirmation before execution.
🚀 Final Note:
Gold is approaching a make-or-break level. Keep your eyes on the Black Mind Curve Resistance and Trendline Support. Whichever breaks first will likely decide the next 150–200 point move.
📢 Follow for More:
If you find this analysis valuable, follow me for daily chart breakdowns, premium setups, and trading education content. Let's grow together!
