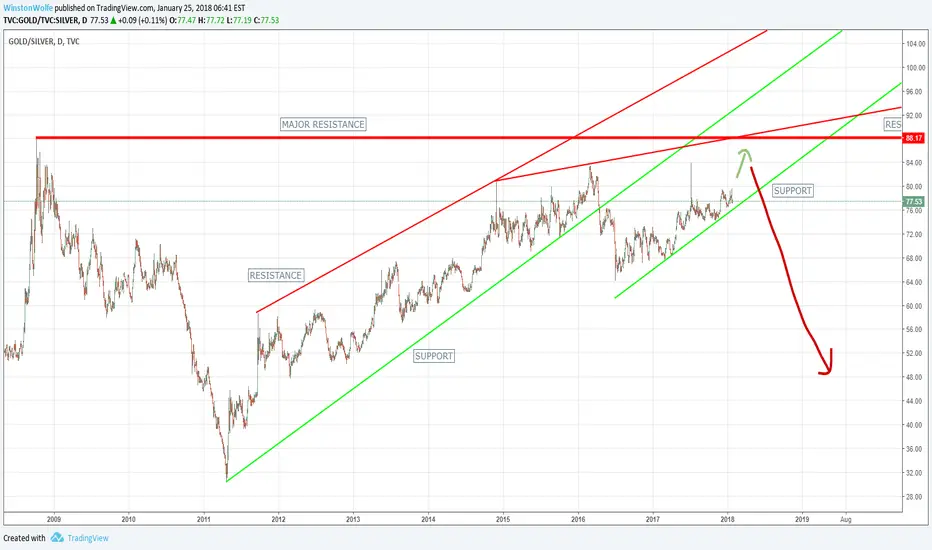
Gold / Silver Ratio PredictionExpect the gold/silver ratio to leap higher as silver underperforms Gold. Gold will rally but silver will remain muted, at least for a while. Then as the Gold/Silver ratio hits resistance at around 100 a clear buying opportunity for silver will emerge. Gold should rally as the Gold/Silver ratio collapses and therefore Silver is a screaming buy at these levels. Inflation picking up will be the key for silver and the gold/silver ratio collapsing. The Fed will lower interest rates, attempt new rounds of Qe to avoid a recession, but unfortunately all they will achieve will be inflation. Follow the breakdown of the ratio as it hits the upward resistance line, then it'll be off to the races for the pm bull market.
Goldsilverratio

GSR TO 105 - 108
GOLD BROKE OUT A COUPLE WEEKS AGO
LOGIC FOR GSR GAP CONTINUATION WOULD BE GOLD CONTINUING HIGHER WHILE SILVER PRICES REMAIN SUPPRESSED FOR POSSIBLY 1 MORE YEAR

20 Year Bearish Rising Wedge in Gold/Silver Ratio? As we all know when a 20 year trend breaks, it tends to break quickly and harshly. When the Gold/Silver ratio drops that also means Gold and Silver tend to be in a new bull market. This cannot go on for ever but I could go on for one or two more years before a decision needs to be made by both markets.

GOLD UPDATE , ONE LAST PULLBACK THEN BULLISHgold may hit to 1365-1375$ soon then fallback to 121x's or 1180$ once again this year.
target for 2021 : 1500+

Gold/Silver RATIO: some thoughtsHi Guys,
"The most common method of trading the ratio is that of hedging a long position in one metal with a short position in the other. For example, if the ratio is at historically high levels and investors anticipate a decline in the ratio that would reflect a decline in the price of gold relative to the price of silver, investors should simultaneously buy silver while selling short an equivalent amount of gold, looking to realize a net profit from a relatively better price performance of silver compared to that of gold."
(source: Investopedia www.investopedia.com)
Below Gold/silver ratio marking 29th Sept 2008 as the most recent peak at 88% same as today. I've added the same date both in #gold and #silver to show that 29th of Sept 2008 is the dip before skyrocketing. IMHO today's cause for such high ratio is not the same as in 2008. IMHO 2007-2008 Financial Crisis created a distortion that need to be taken into consideration.
Since 2011 Gold lost 45% whilst Silver 70%. More ounces of Silver are required to buy Gold but why? Today Gold is up 94% and Silver 73% from last time their ratio hit such an high level.
GOLD/SILVER RATIO www.investopedia.com
TRADING THE GOLD-SILVER RATIO www.investopedia.com
Hope the above clarifies but please do not hesitate to contact me for any queries, comments or feedbacks.
Thank you for your support and for sharing your ideas.
Don't forget to put a like if you appreciate the post and to follow me if you want to receive notifications on new and updated ideas.
Disclaimer:
Please note that I am not a professional trader and these are my personal ideas only. The information contained in this presentation is solely for educational purposes and does not constitute investment advice. The risk of trading in securities markets can be substantial. You should carefully consider if engaging in such activity is suitable to your own financial situation. Cozzamara is not responsible for any liabilities arising from the result of your market involvement or individual trade activities.

SILVER UPDATE... ONE MORE PULLBACK TO 13.xx's POSSIBLEsilver still may go down from around ~16.50 to 13.xx$ before the big bull run.
consider to take profit if you're already long.
13.50-14.00$ re-entry.
target for 2021 > 32.00$ +
good luck.

Targeting GoldSilver ratio 93 or above in crisisUninformed view. Though appears at first glace probability to peak higher, in the short term.

Gold to Silver Ratio and Elliott WavesThis analysis that I have made is to retain insight into what can happen, to look back at what happened afterwards and to look back when I discover a similar case. I do not give advice as to what someone from this analysis should do or imply. It is an important reminder for myself about what happened.

GOLD SILVER Ratio At Extreme Levels silver is extremely undervalued compared to gold.
awaiting reversal soon.
silver will outperform gold on the next upcoming bull market.
Target : 64
good luck.

Silver to rally in the coming weeks along with Gold. Gold/silver ratio upward trend line broken indicated ratio to lessen and Silver to rally faster relative to Gold.
When the ratio lessens it also means that Gold tends to rally also.

GoldSilver - BullishSeeing so many Bearish opinions on TV, I'm suggesting opposite view - Bullish ascending triangle with breakout and retest of the resistance turned into support.

Over past 5 years, gold is down 3.6% and silver is down 27%. Gold and silver have underperformed almost every other asset over the past five years, with silver being by far the worst of the two. With the gold to silver ration sitting at a five-year high of nearly 86:1, we just might see some silver shooting stars if market sentiment continues to devolve into panic. Buckle up!

Some Sunshine through the hurricaneThere does appear to be some light meaning the markets may not be ripe for the correction we all expect.

Part 6 - Risk-off August - XAU/XAG DailyXAU/XAG – Monthly Resistance & Support:
Resistance: 86.00
Support: 74.00
XAU/XAG – Summary:
Expected to start a Bullish Swing from the current 79.00 Levels and complete the Ending Diagonal pattern at or around 86.00 Levels
Bearish Impulse expected at or around 86.00 Levels

Gold and silver ratio to go to 120 before the next crisis? The price channel is indicating the ratio will go up to 120 before the next crisis. But it will also be the best opportunity of our lifetime imo.

Historic Gold Silver Ratios VisualizationAfter studying $gold and $silver History, decided to graph the Ratios ($GOLDSILVER). and this is the final result for an easy view

Gold Silver Ratio About to Explode?While the Head and Shoulders pattern is often associated with a topping formation (or bottoming in the case of an inverse head and shoulders), it can often show up as a continuation pattern.
Since most of the articles I have read recently about the Gold:Silver ratio state that silver comes out of the ground together with gold in a15:1 ratio, that the market should value this ratio at a level closer to that rather than the recent levels of 80. Some state that historically a ratio of 30 silver to 1 gold is the average. TradingView data goes back 20 years and the chart is quite revealing. It does appear that, based on the head and shoulders continuation formation, that gold is set to greatly outperform silver going forward.
Recently, both gold and silver have been falling due to higher US interest rates and a subsequent rising dollar. Silver's recent attempt to reach previous highs of several weeks back failed and the reversal appears to be strengthening, possibly causing silver (SLV) to fall to 13 or even under 10! On the opposite side, in an effort to by-pass US sanctions on Iran, Russia and other countries are looking for alternative payment methods instead of the US dollar. This might add demand to the gold side of the equation.
Nothing is yet written in stone and a breakout and test of that breakout level still needs to occur for this ratio to fulfill the measured move expectations of the head and shoulders pattern, but it's good to know that perhaps the more common narrative that the gold silver ratio is too high and needs to come down, along with the other common narrative that the Commitment of Traders report shows that speculators are heavily short silver proves that silver is due for a pop, may all be wrong.

Silver to GoldSilver has had a worse recover from the last low than Gold.
The Gold to Silver ratio rose to new highs.
Will Gold go down / sideways or will Silver go up to tighten the spread?
Or, alternative C, both will happen.
In comparison with the XAU - Index we can see a possible price zone for Gold and Silver. And in this projection Gold will lose and Silver will win in valuation, meanwhile XAU would go nearly sideways.
This no trading advice!


Gold to Silver Ratio Topping OutBeen watching the Gold to Silver ratio for years. These are perverse levels that cannot continue forever so prepare yourself. Currently you can get over 80 oz of silver for 1 oz of Gold. Look for that number to get significantly lower over the next few months. The previous low was 1:32 and I suspect we'll go lower next time.

can it hold up ?gold versus silver still in bullish side while Rsi in (weekly and monthly) looks strong and searching for further up , but in last july the pair retraced 38% of last movement (2011-2016) . so if the pair haven't holds above 75's it will continue retrace to 50-55's area before continue its rally
GLTA

Silver to rally faster than gold in the near future?Gold/Silver ratio looks to be topping out against strong resistance levels. This should see the trend reverse quite sharply as Silver is incredibly volatile. Should therefore see much higher silver prices in the latter stages of 2018.