XAUUSD DAILY BIAS : B.U.L.L.I.S.H 🐃🔱 GOLD TRADE IDEA 🔱
BIAS: Bullish
FUNDAMENTAL BIAS: Bullish
The latest inflation rate reaffirms global inflation rate & amid heightened escalations between Russia & the West.
Putin stated that talks with Ukraine are at dead-end following latter deviation from agreements reached in Turkey
TECHNICAL BIAS: Bullish
Goldspot

Bearish Alt Bat Visible On Gold's Monthly ChartThis is an update to the First Post I made on Gold's Bearish Alt-bat last year just to let you know that it is still in play and that it has just come back up to tap the PCZ a Second Time and this time on Greater Volume this looks like it could be the end and where Gold begins a Presumably Years Long retrace back to the zone between $1,129 and $718.80
If you want to see my original posting from last year on this Alt-Bat i have it on the related ideas section below.

Gold Spot to $2600 by 2024Gold ( OANDA:XAUUSD ) is forming an immature cup and handle on the monthly with a price target of $2600. On the weekly, we see it has broken above this triangle as you see in the chart below. That move is not confirmed yet either, but if next week, gold trades above this week's close, then we set a price target of $2060 and set a stop loss below the recent low.
Charting Gold versus M2 Money Supply, we see gold hitting a historical low of 2007 which has supported the price many times between 2007 and today where it remains a strong support.
Let me know what you think. Leave comments and if you like, leave a like. Cheers.

GOLD BULLISH BEAST COMING BACK!Looks like Gold is getting very Bullish now! I pulled out to take profits but will be jumping back in.

XAUUSD (Gold Spot) - February 4Hello?
Traders, welcome.
If you "follow", you can always get new information quickly.
Please also click "Like".
Have a nice day.
-------------------------------------
(XAUUSD 1W Chart) - Mid-Long-Term Perspective
The Bollinger Bands are converging on the 1781.646-1827.800 section.
Accordingly, if there is movement outside the 1781.646-1827.800 interval, the Bollinger Bands will expand.
In the CCI-RC indicator, the CCI line is falling below the +100 point and below the EMA line, so it is more likely to show a downtrend.
(1D chart)
(Full: )
1743.253-1814.376: An important section to determine the trend
Resistance section: 1814.376-1827.800
First support section: around 1781.646
Second support section: 1743.253-1751.550
The highs are moving downwards, so you should check the resistance zone for movement.
------------------------------------------
We recommend that you trade with your average unit price.
This is because, if the price is below your average unit price, whether the price trend is in an upward trend or a downward trend, there is a high possibility that you will not be able to get a big profit due to the psychological burden.
The center of all trading starts with the average unit price at which you start trading.
If you ignore this, you may be trading in the wrong direction.
Therefore, it is important to find a way to lower the average unit price and adjust the proportion of the investment, ultimately allowing the funds corresponding to the profits to be able to regenerate themselves.
------------------------------------------------------------ -----------------------------------------------------
** All indicators are lagging indicators.
Therefore, it is important to be aware that the indicator moves accordingly with the movement of price and volume.
However, for convenience, we are talking in reverse for the interpretation of the indicator.
** The MRHAB-O and MRHAB-B indicators used in the chart are indicators of our channel that have not been released yet.
(Since it was not disclosed, you can use this chart without any restrictions by sharing this chart and copying and pasting the indicators.)
** The wRSI_SR indicator is an indicator created by adding settings and options to the existing Stochastic RSI indicator.
Therefore, the interpretation is the same as the traditional Stochastic RSI indicator. (K, D line -> R, S line)
** The OBV indicator was re-created by applying a formula to the DepthHouse Trading indicator, an indicator disclosed by oh92. (Thanks for this.)
** Support or resistance is based on the closing price of the 1D chart.
** All descriptions are for reference only and do not guarantee a profit or loss in investment.
(Short-term Stop Loss can be said to be a point where profit and loss can be preserved or additional entry can be made through split trading. It is a short-term investment perspective.)
---------------------------------

GOLDSales area and resistance ...
Accompanied by Mr. Powell's speech ...
Although interest rates in Canada and the United States are still stable, I expect the Federal Reserve to raise interest rates in seven stages in March.
And this is not good for risky markets at all ...
I have shown close support so far ... and I will definitely update my analysis if this support is lost.

GOLDAt the moment, I think all the financial markets are skeptical about the issue of US inflation and the issue of tipping ... or various economic policies.
This problem will probably be resolved in the medium term.
You can see the gold analysis in the above timeframe on my page. On November 30th
This is the analysis of gold in the shorter term ...
.
.
If you have any questions, you can write it in comments below, and I will answer them
And please don't forget to support this idea with your like and follow, thank you...

Diamond Setup Forming in XAUUSD Pairs?Diamond formation happens to be one of my favorite patterns just like head and shoulder which finds its way to my target point 90% of the times.
Gold presents another opportunity for us all to earn big this NFP Friday.
Use a good SL and avoid overleveraging your account.
PPPDirhams.
Disclaimer: This is just my idea. Am not liable for the end results if adapted by anyone. Trade cautiously as there are chances that you will lose your investment..

GOLD SPOT Sell Setup Almost Completed - SHORT XAUUSDFX:XAUUSD
Our price ranging area looks pretty strong. Gold will drop to correct it's previous move as it seems.
PPPDirhams.
Disclaimer: This is just my idea. Am not liable for the end results if adapted by anyone. Trade cautiously as there are chances that you will lose your investment..

Gold Spot Set to take a DIPOANDA:XAUUSD
I think gold will rally to complete the flag formation and quickly drop to the lower bounds of or inner channel.
PPPDirhams.
Disclaimer: This is just my idea. Am not liable for the end results if adapted by anyone. Trade cautiously as there are chances that you will lose your investment..

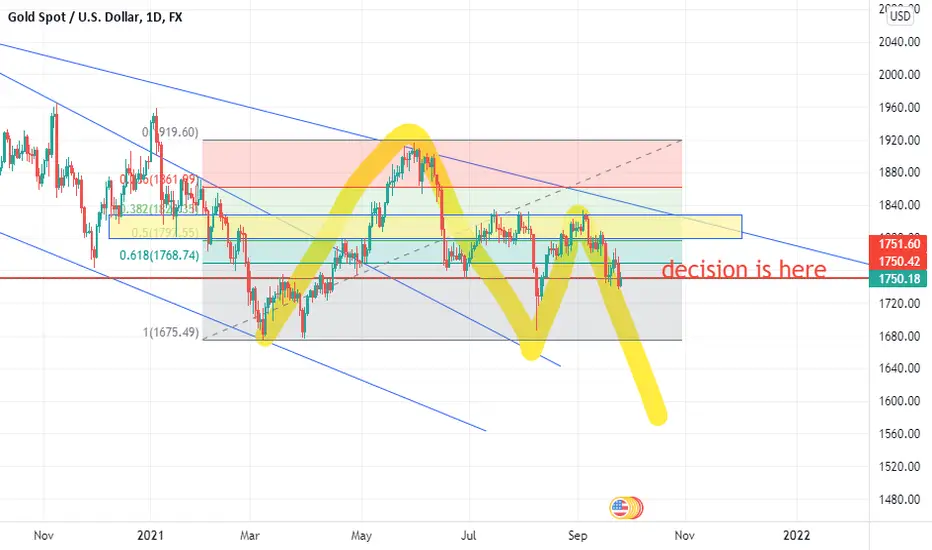
Gold to falllooking at weekly chart you can see the gold on critcal descision going lower time frame you can see in my point of view that bearish pressure continue i can expect 1678 test
XAUUSDGo see my previous analysis( XAUUSD ) , Now!
Follow me and you will be surprised AND get rich😉✌️
, saymoti 👋


Will Gold Spot Decline More? (TP 1682.6)Gold (XAUUSD) and silver (XAGUSD) has crashed in the previous week. Gold has lost -113.585 points ( -6.05% ), and silver lost -2.14315 ( -7.68% ). Millions of CFD's traders have lost money in that week.
Where's gold's bottom?
According to technical analysis and fundamentals research, gold can decline more. Gold has broken the strong support trendline (01) and marching for 02 . If it doesn't close above to trendline of 01 in the first two trading sessions, it will be unstoppable through high selling pressure by speculators. And we will see the target price 2.
Technically, the most popular indicators are indicating a complete downtrend. And Stoch RSI is signaling for a reversal. So, it can pullback up to a retracement level of 38.2% or 01 trendlines. If that not happen, gold can lose 81.635 points more.
In the previous week, gold and silver were falls due to economic events and high selling pressures by speculators. For advance traders, watch significant releases or events that may affect the movement of gold , silver & crude oil .
Tuesday, Jun 22, 2021
00:30 - FOMC Member Williams Speaks
01:00 - All CFTC Speculative net positions
11:00 - Gold Index
20:30 - FOMC Member Daly Speaks
23:30 - Fed Chair Powell Testifies
Wednesday, Jun 23, 2021
02:00 - API Weekly Crude Oil Stock
18:30 - FOMC Member Bowman Speaks
19:15 - Flash Manufacturing PMI | Flash Services PMI
20:00 - Crude Oil Inventories
20:30 - FOMC Member Bostic Speaks
Thursday, Jun 24, 2021
18:00 - Final GDP q/q | Initial Jobless Claims

Weekly outlook of Gold SpotIn June, XAUUSD and MCX Gold crash due to FOMC events. It has recovered almost 60% to 70% loss in the July month.
Gold spot needs to break 1809 levels to retest support of 1793.6 - 1783.6 . These support levels will push the gold price higher. Gold isn't sellable until the breakout of 1766 ( strong support ).
XAUUSD will touch 1858 - 1898 levels soon.
Watch significant releases or events that may affect the movement of gold, silver, crude oil, and natural gas:
Wednesday, Jul 21, 2021
02:00 API Weekly Crude Oil Stock - Medium Impact
20:00 Crude Oil Inventories - High Impact
20:00 Cushing Crude Oil Inventories - Medium Impact
Thursday, Jul 22, 2021
20:00 Natural Gas Storage - Low Impact

Part 2: What Drives Gold (XAUUSD) Prices?PREVIOUS:
-------------------
Weekly outlook of Gold Spot -
WHAT'S NEXT:
----------------------------
Key levels: 1793.6 and 1783.6
According to my previous newsletter, my gold key levels will remain the same. It's not sellable until breakout the 1766 (strong support).
In XAUUSD, buying pressures are increasing. We may see 1812 - 1824 - 1836+ levels.
Alternatively, gold is taking a reversal from the first key level, so its upside rally may be weak. But, day traders can play between my range. And stop buying when it breaks the first key level. That could drag down the gold price directly at the second key level ( 1783.6 ).
And gold's closing price below 1783.6 means blast. It may hit the strong support level directly.
Please note, don't forget to watch significant releases or events mentioned above in the chart that may affect the movement of gold, silver, and crude oil.

GOLD: XAU / USD Analysis (UPDATE). Very strong support!Hello TradingView Community!
Gold is at a very strong S/R level.
At first it functioned as a resistance, than for a long time as a support, then again as a resistance, and now the price has stopped by this level and again it functions as a support.
The price also reacts to the weekly Pivot point R1, from which it is reflected upwards.
At the moment, we prefer to be stay without a position on the Gold spot. It is possible to scalp in the direction of Long, but I would rather wait to see what the middle of the week and today's fundamental news will bring us.
Have a nice day. Your UCT Team.

GOLD: XAU / USD Analysis. Gold spot under pressure!As you know The EMA 200 Daily is very strong and psychologically divides the market into bull and bear.
At this point, the price of gold stopped by EMA 200 and bounced downwards, which means a drop in the price.
In addition, the price rebounded from the weekly level of Pivot point R2. To do this, we are just below the Trend Line, which has been with us since the 1st of June.
This is a confluence of several factors that, according to a technical analysis, tell us that the price of gold will fall this week.
However, the price will also move the fundamentals, so it is necessary to follow world events, especially the FED and the price of the dollar.
The UCT team wishes you pleasant trading.

FOMC Minutes: A confirmation for an explosive rally in XAUUSDGold has started collapsing nonstop after Nonfarm Payrolls data. And it stopped at my ' tested many times ' level. XAUUSD has recovered 50% almost in the previous week.
The gold spot needs to break the 1793.6 level to start an uptrend. Afterward, it will go for 1806 - 1826 levels. And these levels can push the gold price up to 1900 .
But if gold breaks the strong support again, it will start falling. This time, it won't stop! Hence, the short-term traders can start selling from there for the targets of 1744 - 1726 - 1684 .
For advance traders, watch significant releases or events that may affect the movement of gold, silver & crude oil. Especially, don't forget to watch this Wednesday's events to find out gold upcoming actions.
Tuesday, Aug 17, 2021
18:00 Core Retail Sales (MoM) (Jul) - High Impact
23:00 Fed Chair Powell Speaks - High Impact
Wednesday, Aug 18, 2021
02:00 API Weekly Crude Oil Stock - Medium Impact
20:00 Crude Oil Inventories - High Impact
23:30 FOMC Meeting Minutes - High Impact
Thursday, Aug 19, 2021
18:00 Initial Jobless Claims - High Impact
20:00 Natural Gas Storage - Low Impact
Friday, Aug 20, 2021
Baker Hughes US Oil Rig Count - Low Impact
MCX Gold Will Have An Explosive Rally This Wednesday:
MCX traders should keep their eyes on the 46720 levels. It's a trend changer.
As per XAUUSD, Indian MCX Gold can raise 47500 - 48260 after a breakout of $1793.6 . And if it breaks the strong support of Gold Spot, it will keep falling for targets of 46260 - 45860 .

XAU LOSING FANS TO BTC INFLATION FEARS Basic Supply n demand
I use fib levelz to mark my tp levels
Heading is what it means fundamentally
Forget gold forget bonds, what better place to invest ur about to inflate money than crypto i guess that's unless the banks don't plummet it to instill fear into the sheep of get rich quick masses withdrawing investment at a loss hence increasing market fluidity...ouch right anyway Banks in control of bitcoin so ur money definitely ain't safe especially with the masses coming from the inflation fears
I would say one more pump n dump
Google it

XAU letting the shorts cool then looking for upsideThis is an idea not a advice
News drifted Gold to the lowers side, now looking for supports and stabilisation before moving back to its average price.

Gold will come back to the $1800 level?On 16 July, gold has crashed over 60$ during the FOMC event. At that time, Commodity Futures Trading Commission (CFTC) data was highlighting selling pressure.
GOLD - COMMODITY EXCHANGE INC.
FUTURES ONLY POSITIONS AS OF 07/27/21
(CONTRACTS OF 100 TROY OUNCES) | OPEN INTEREST: 500,187
NON-COMMERCIAL & COMMERCIAL TOTAL
-----------------------------------------------------------------------
LONG 452,107 | SHORT 481,533
Ref: CFTC Gov
And on 27 July, CFTC data was said OI (Open Interest) of a gold future contract is 500,187 and total shorts 481,533 & buys 452,107 . But, gold prices increased.
We have to notice that the bullish rally wasn't powerful compare to the 16 July data. And selling pressure has higher compare to buyers. Hence gold has moved bearish side in the last trading session.
If gold wants to move upside, then it has to crossover my strong resistance. That will lead the gold's prices above 1840 - 1860 - 1882 - 1900 .
But if you focus fundamentally & CFTC data, XAUUSD will keep falling and touch the following targets: 1793.6 - 1783.6 - 1763.6 . Gold is making double top formation also.

XAU Long This is an idea not an advice
Looking at long after strong institutional upward after recent news and current correction, as expected in the post i made before.
However if the trend violates the red zone and drops below it will move back down to last support around 1795.
Fundamentally, due to pressure of inflation, gold is a security that most will look towards as a safety net. So upwards is mostly expected.
