Goldspot
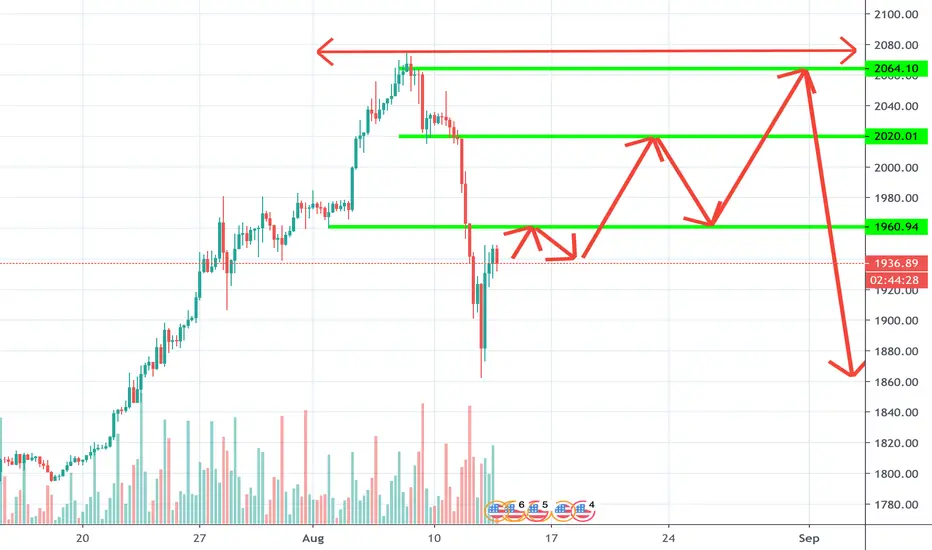
Buying the Dip. The dip has been taken due to high risk reward risking almost 300 to 400 pips while targeting the reversal trend till 1945.

Gold Hits A New All-Time High... $2461 Next Target!I've been buying Gold... Not on the computer but real physical gold.
Gold Spot (XAUUSD) hit a new All-Time High this month surpassing the peak hit back in September 2011... Wow.
I had this feeling/voice in my head in "repeat" saying "Buy gold, buy gold, buy gold, buy gold..."...
My God relax... Bought.
Anyways, I bought some gold, went back, and bought more yet there is still the feeling that I need to purchase even more.
This thing is going parabolic now so technically there can be a retrace soon... But this "soon" can be months or years...
But ignoring TA, I am getting the feeling that Gold will be $4,000 in just 1 or 2 years (this is not financial advice and just my own personal feeling).
Looking at the conventional markets and the economic meltdown that is due to take place, fiat printing at All-Time Highs... This is something completely possible.
I predicted the $1920 Gold price just a month ago... You can see the chart below:
June 19 | Gold Spot (XAU) Goes With The Bulls/GREEN ($1920 Possible)
And now, looking at TA, this is my next target as to where the price for Gold Spot will go... $2461...
Thanks a lot for your continued support.
Namaste.

My 2 Cents on XAUUSDWe saw gold bounce from the 51 (50) period MA on this one hour timeframe recently; and I have a feeling it could do the the same thing this upcoming week


GOLD/USD - My long ideaThis is my long idea for GOLD/USD. If it reached first target then I'll move my SL near the entry level.

XAUUSD AnalysisThe gold spot value has created a kind of channel or flag formation.
It may fall to 1679.876 price level because gold spot has been overbought and the U.S Dollar will definitely gain currency strength this week since the U.S Index has its reached support level.
So price may move up and down within the channel created or may break out at the upper side if its truly a flag formation.


XAUUSD Update: Quick scalp for Short then Rebound from Support!!At the moment we can see the 0.382 Fib level establishing itself as a formidable resistance level, with a rejection at this area by XAUUSD bringing it down to the 0.236 Fib level, where some consolidation might occur here before continuing its downward journey to the WHITE main support line @ 1695 area.
On the whole, we can see clearly from the H4 Time frame the formation of a descending triangular wedge, with the green line as the top.
Our opportunities for the next few days, to watch for:
- QUICK SCALP SHORT to the bottom, taking profit before the white support line @ 1695
- Watch for reversal confirmation at the white support line, an H1 or H4 bullish reversal pattern, before a BUY entry with target @ 0.382 Fib level @ 1718 for retest again
- It is possible XAUUSD rebound might not get past 0.382 Fib, but if it does, we aim for BUY TARGET 2 @ 0.5 Fib level which coincides with the top of the triangle wedge at 1727. I expect this level to post a formidable resistance for GOLD SPOT XAUUSD to overcome.
Economic sentiment is rapidly going towards the bull side, I would expect some drop in gold prices in the short term at least!
As always, feel free to like and follow if you enjoyed my post!
Best Regards,
GOLD D ROGER


XAUUSD GOLD SPOT Technical Analysis: Reaching channel top!From the H1 and H4 Time Frame we can see gold faithfully following an ascending channel as a major trend, with the support line shown in light blue and major resistance lines in yellow (dotted and non-dotted).
Short Term BULLISH + Mid Term BEARISH:
I expect to see Gold moving up a little more for a slightly extended BUY opportunity, however, will expect a pullback from the resistance lines @ 1778-1788 USD/troy ounce region. Historically gold has been respecting this levels quite well, being rejected strongly for 3 times since, pulling back all the way to the bottom of the ascending channel line (blue line). During the pullback expect a consolidation phase at the nearest support level @ 1750-1760 region.
# Note: There's a chance the bullish momentum may bring GOLD above the channel, from there we would expect a breakout to 1800 and up for a BUY --> Observe whether GOLD gets rejected by 1788 region
For the short opportunity from the channel top:
I would advice watching H4 or H1 Heiken ashi, gold follows momentum pretty well.
Watch for reversal signs in the VOLUME BARS as confirmation. (etc. green bars dropping and next 2 bars are red)
Trade carefully, with stop loss above the channel line for the short opportunity.
As usual, feel free to like and follow if you like what I shared = )
Regards,
GOL D ROGER

GOLD XAUUSD Putting on a Show ! Welcome and good day to all!
As can be seen in the chart, there are two possibilities that are showing itself:
1) Possible formation of a new descending channel, that will mean a reversal of the major uptrend!
2) Continuation of the major ascending channel, the descending channel formation is just part of the channel waves
I would place my money on the BULLS
Honestly this is what my friend calls "Putting on a show", where our job is to educatedly guess what other patterns GOLD SPOT will come up with.
Technical and Fundamental Analysis (BULLISH) :
- Historically, the uptrend support line (ascending channel white line) has always been held, with strong rebounds upon touching it --> Now it has very recently rebounded
- Fundamentals are bullish, with rising tensions between US-China trade wars along with the controversial Hong Kong security law imposed by China --> Rising tensions indicate more risks which drives investors towards risk hedges like GOLD and CRYPTO, means more BUYING PRESSURE
- We may in due time see more second wave pandemic counts increase rapidly, as these takes time to detect (Asymptomatic ppl infecting others cant be detected until an infection cluster shows up)
However, to watch for POSITIVE NEWS OF VACCINE RESULTS --> these will heavily reduce risk aversion and lead to GOLD SELL OFF
I expect these vaccine reports to be released near July (Testings take approx 4 months at least, with the big testings results ready by end of year 2020)
Short term Opportunities:
- TO BUY, watch for BREAKOUTS from resistance level 0.786 fib @ 1738
- TO SELL, watch for BREAKDOWNS from support level @ 1730
As always, trade carefully with stop loss orders and happy trading!
Feel free to like and follow if you enjoyed my ideas!
Best Regards,
GOLD D ROGER
A humble trader

xauusd clear pathi was waiting for the pool back and happened so we are expecting a rise up till the point and above unless we have vaccine news there is a big chance of rise according to the pool back
good luck every one let me know about your opinion
thank u

GOLD SPOT XAUUSD Forecast: Rocket Time ^WELCOME TO MY PAGE AND FEEL FREE TO LIKE AND SUPPORT IF YOU LOVE WHAT YOU SEE = )
Overall I'm definitely bullish on gold, aside for some small retracements and corrections here and there.
I see a strong rebound from the 0.786 level and if that happens, we have a strong support for further bullish momentum for the next week.
ITS GOLD TIME!
***Also an interesting note I found analyzing Gold charts: Volumes react in a very predictable way, if you could count and set a timer for the 8th-10th hour of small volume bars in H1 TF, you could certainly time the breakout accurately to the hour. I would best remind you that THIS ONLY WORKS FOR H1 and above time frames. After this, go onto M15 and M5 to spot micro trends for entry confirmation.
As always, trade safely with stop losses and carefully, I wish you all the best of profits.
Regards,
GOL D ROGER

XAUUSD GOLD SPOT : Shooting to the Moon?? Fibonacci AnalysisGood day and welcome to my page, feel free to like and comment if you like what I shared!
GOLD SPOT XAUUSD has broken out of the ascending wedge, shooting to 1733 at the moment. For now, we wait for a pullback to the triangle wedge upper line, also coinciding with the 0.618 Fibonacci retracement level @ around 1720-1723 region. A very good LONG/BUY OPPORTUNITY from there towards 1740 region and possibly beyond.
As always, feel free to comment any thoughts, I will welcome any discussion = )
Regards,
GOL D ROGER

XAUUSD GOLD SPOT: The Future of Gold???WELCOME TO MY PAGE AND FEEL FREE TO LIKE AND SUPPORT BY FOLLOWING, I hope everyone has a great day in the market today = )
Chart above shows XAUUSD in H1 Time Frame. Continuing from our previous idea, XAUUSD Gold has indeed followed our plan as stated, a BREAKDOWN from the top of the channel line (GREEN) towards the bottom.
Now, we look for how GOLD reacts at the support levels @ 1690 region:
- A REBOUND definitely means a LONG opportunity to the top of channel line @ 1717-1720 area
- A BREAKDOWN from support level @ 1690 would likely mean a major trend reversal for gold (Bullish to bearish)
Following a breakdown would likely mean a retouch of the bottom of channel line, rejection then SELL pressure to our next major support @ 1671
Fundamental Analysis:
As always, it is good to supplement technical analysis with confirmation from news signals, thus allowing a higher rate of profitability and wins.
- A possible strengthening Dollar this week beginning
- Gold prices had been supported last week by market signals suggesting that U.S. official interest rates could turn negative next year as the Fed is forced to resort to ever-more dramatic measures to support the economy. Two senior Fed officials – Atlanta Fed President Raphael Bostic and Chicago counterpart Charles Evans – may both touch on the subject when they speak later Monday.
- Flow of hot money into gold is easing off : Physical demand from Indian retails suffer due to higher prices and a weakening rupiah
- World Gold Council data suggest imports fell 50% from a year ago in the first quarter, while Chinese imports fell by 62%.
Notably, many ETFs who have held gold since May may begin a slow sell off with their inventories to secure profits as they respond to news and the reopenings of economies.
OVERALL TREND, Im Bearish on Gold due to the above reasons.
Of course things can change and to watch out for:
1) Implementation of Negative rates by Fed --> implies a backwardation of fiat monetary system and a shift onto gold instead (You can read about how it works here--> www.goldmoney.com)
2) News of second wave of Pandemic
As always, good luck with all your trades and FEEL FREE TO LIKE AND SUSCRIBE IF YOU LIKE WHAT YOU SEE
Regards,
GOL D ROGER


GOLD SPOT XAUUSD SHORT OPPORTUNITYA bearish double top pattern has been seen to be formed at the top level of the ascending wedge channel. Now, gold appears to be consolidating in a range.
An hourly close below the support line @ 1710 would bring us to a SHORT OPPORTUNITY to TP1 @ 1695 and TP2 @ 1685
Remember to place stop loss orders, and FEEL FREE TO LIKE AND FOLOW IF YOU LIKE WHAT YOU SEE HERE! = ))
Regards,
Gol D Roger

XAUUSD Technical and Fundamental AnalysisA bullish flag pattern seems to be forming in the D1 Timeframe, currently possibly on its THIRD rebound of the bottom of the wedge.
Short Term Opportunities to watch for:
- A STRONG REJECTION AND REBOUND FROM SUPPORT @ 1680 --> possible LONG opportunity to the top of the wedge @ 1710
- A BREAKDOWN below support 1680 --> SHORT opportunity to the nearest support line @ 1637
- A BREAKOUT above 1720 would bring us for LONG to next resistance @ 1735, and beyond that, the historical resistances last touched in 2012-13, @ 1795 and @ 1909
Fundamental Analysis:
However, I would be watching the news closely as Unemployment Rates (8 May), Jobless Claims (7 May) , CORE CPI, and Fed Budget (12 May) are due for release. The US Treasury has also said it would borrow an astonishing $2.999 trillion during the June quarter, five times larger than the previous single-quarter record. (www.investing.com)
These points to impending inflation and therefore BUYING pressure on the ultimate hedge of inflation and risk: GOLD
Just the two cents of a humble beginner trader,
Feel free to leave any comments or feedback :)

XAUUSD: $1707 Next Short TargetFirst off, please don't take anything I say seriously. As always, this is on opinion basis. That being said, let me get into a few points. Right now, Gold is very bullish on the Forex market, and in most financial markets in general. The demand curve is seemingly going up. This is why it also has long potential. However, for a short term self-off target for Gold (since I prefer doing shorts for day trades), the target I would set-off is $1707, then reinvest in the dip couple dollars down and so forth following the day's range trendline.

Gold Spot Looks Like A DropOne of our readers asked about Gold (XAUUSD), how is the chart looking now? What is it saying?
For Gold Spot (XAUUSD), the chart is starting to look bearish after a lower high and a candle close below EMA10 (green line).
We have the MACD, pictured below, printing a bearish cross.
We also spotted bearish divergence with the RSI.
We have the RSI closing lower while XAUUSD was closing higher:
Our first target if prices continue to drop will be $1644.84 or EMA50.
If this level breaks, prices can go even lower and hit ~$1550... This is not financial advice.
Thanks a lot for reading.
Namaste.

XAUUSD : UPTREND CHANNEL BREAKOUT Hey guys if you like my ideas you can like it or share with your friends
Uptrend change breakout retest confirm
Short gold

XAUUSD possible to buy!!!As we can see gold now currently sideways
but the gold still in uptrend.
Upside might be over 1700 and downside can be around 1608.
Support will be around 1638 and then 1608.
If the price go up we should take a closely look around 1670 level.
In my plan it will pull back to 1660 and then continue go up to be over 1700
Lucky all everyone
