GOLD (XAUUSD): Move Up Ahead?!
Friday's fundamentals made Gold very bullish during the New York session.
The price formed a high momentum bullish candle on a daily,
breaking a minor daily resistance area.
It gives us a confirmed Change of Character CHoCH and indicates
a highly probable bullish continuation next week.
I think that the price will reach 3400 level.
❤️Please, support my work with like, thank you!❤️
I am part of Trade Nation's Influencer program and receive a monthly fee for using their TradingView charts in my analysis.
Goldtechnicalanalysis

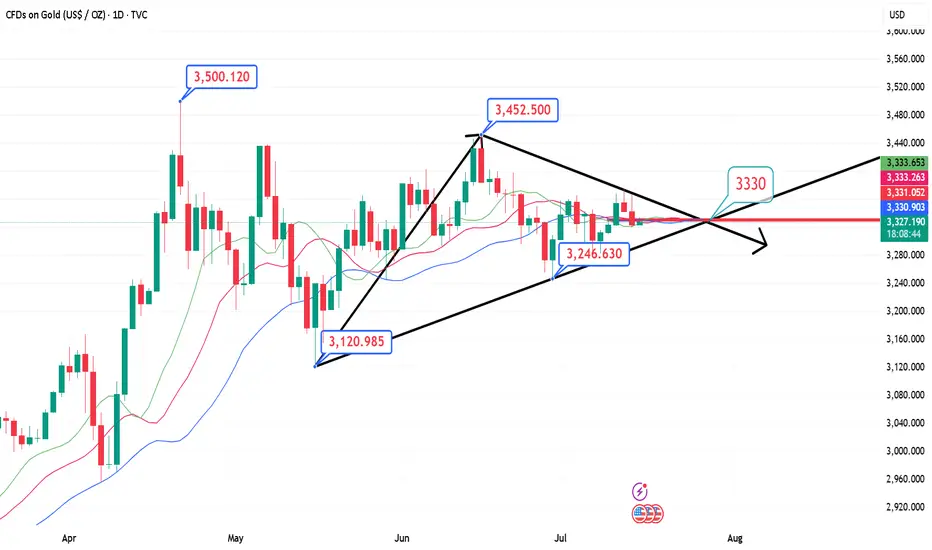
GOLD (XAUUSD): Detailed Support & Resistance Analysis
Here is my fresh support & resistance analysis for Gold.
Vertical Structures
Vertical Resistance 1: Rising trend line
Horizontal Structures
Support 1: 3327 - 3344 area
Support 2: 3246 - 3275 area
Resistance 1: 3431 - 3451 area
The price is currently coiling on a trend line.
Your next bullish confirmation will be its breakout.
❤️Please, support my work with like, thank you!❤️
I am part of Trade Nation's Influencer program and receive a monthly fee for using their TradingView charts in my analysis.

Will Upcoming Data Determine the Next Gold's Direction?Macro approach:
- Gold retreated this week, reversing early gains to trade near four-week lows amid renewed US dollar strength and caution ahead of the Fed's policy decision.
- The retreat was mainly pressured by stronger-than-expected US economic data and a tentative revival in risk appetite, offsetting pockets of safe-haven demand.
- Key drivers included robust US GDP growth for 2Q, a bounce in consumer confidence, and the Fed's steady rates with a more hawkish tone, suggesting cuts may be further out.
- Meanwhile, recent US-EU and US-China trade deals eased some global uncertainty, damping gold's appeal as a hedge.
- Market participants also eyed the labor market's continued cooling, but resilient consumer spending further buoyed the dollar.
- Gold may remain volatile, with potential upside if upcoming US PCE inflation and NFP reports disappoint expectations. Any escalation in trade tensions or signals of Fed policy easing could renew support for gold prices.
Technical approach:
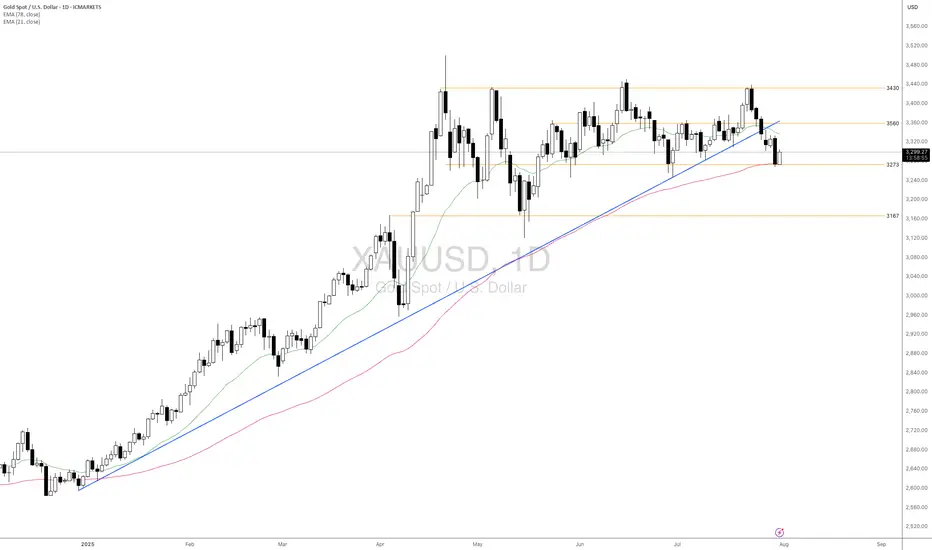
- XAUUSD fluctuated within the range of 3285-3560, which is below the broken ascending trendline. The price between the two EMAs awaits an apparent breakout to determine the next trend.
- If XAUUSD breaks below the support at 3273, confluence with EMA78, the price may plunge to retest the following support at 3167.
- On the contrary, remaining above the support at 3273 may lead XAUUSD to retest the resistance at around 3560.
Analysis by: Dat Tong, Senior Financial Markets Strategist at Exness
Gold Holds Trendline Amid Rising MomentumFenzoFx—Gold remains above the ascending trendline, trading around $3,386.0. Technical indicators like RSI 14 and Stochastic show rising momentum, reinforcing the bullish bias.
Immediate support lies at $3,347.0. If this holds, XAU/USD may climb toward the monthly VWAP at $3,412.0.
The bullish outlook is invalidated if Gold closes below $3,347.0, which opens the door for further downside toward the next support at $3,307.7.

Gold: $3,348.0 Resistance in Focus for BullsFenzoFx—Gold's decline reached the ascending trendline near $3,314.0. The bullish trend remains intact while price holds above the trendline.
Immediate resistance is $3,348.0, and a close above this level could lift the market toward $3,389.0 and potentially $3,451.0, aligning with recent higher-lows.

GOLD (XAUUSD): Support & Resistance Analysis for Next Week
Here is my latest structure analysis and important
supports and resistances for Gold for next week.
Consider these structures for pullback/breakout trading.
❤️Please, support my work with like, thank you!❤️
I am part of Trade Nation's Influencer program and receive a monthly fee for using their TradingView charts in my analysis.

GOLD (XAUUSD): Important Demand Zone Ahead
Gold is currently retracing from a key daily horizontal resistance.
Here are important structures to watch.
Horizontal Structures
Support 1: 3350 - 3377 area
Support 2: 3310 - 3324 area
Support 3: 3282 - 3301 area
Support 4: 3245 - 3374 area
Resistance 1: 3431 - 3451 area
Resistance 2: 3493 - 3500 area
Vertical Structures
Vertical Support 1: rising trend line
Vertical and Horizontal Supports 1 compose a contracting demand zone.
Probabilities are high the price will pull back from that.
❤️Please, support my work with like, thank you!❤️
I am part of Trade Nation's Influencer program and receive a monthly fee for using their TradingView charts in my analysis.

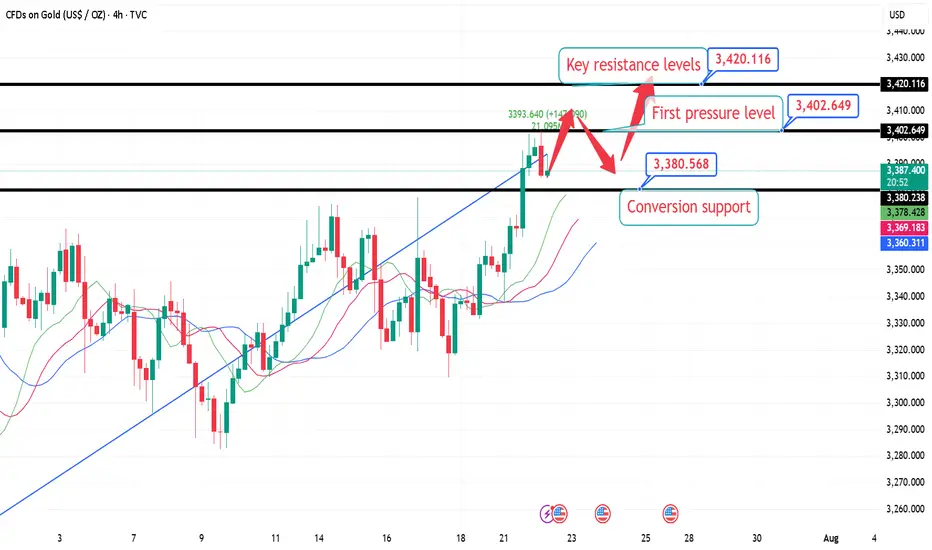
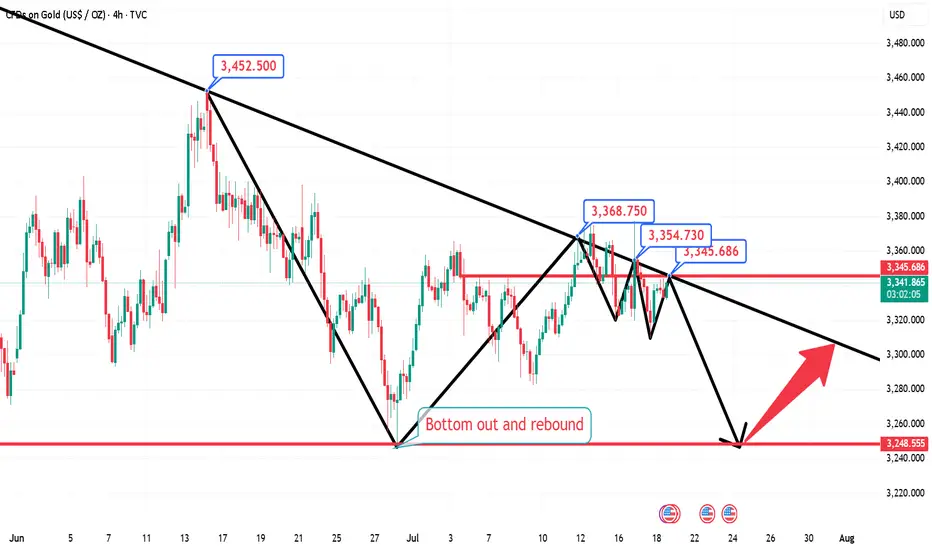
7.22 London Gold Market Analysis and Operation SuggestionsFrom the market perspective, the trend suppression line from the historical high of 3500 to the secondary high of 3452 has moved over time and is now around 3420, which can be used as an important resistance level reference for this week; the previous resistance level of 3376 can be converted into support after breaking through. For intraday short-term operations, focus on this range of callbacks and go long, wait for the key resistance level to be touched before going short, or see if there is an opportunity to arrange a mid-term short order based on the real-time trend.
Specific intraday operation ideas:
①. When the gold price falls back to around 3380, participate in long orders and call, protect the position of 3374, and first look at the position of 3402, the high point on Monday;
②. After yesterday's high point breaks, wait for a correction to around 3395 to continue to participate in long orders and call, protect the position of 3388, and look at the key suppression level of 3420;
③. (Aggressive orders, for those who are afraid of missing out) If you are short or have enough positions, you can first participate in long orders with a light position at the current price of 3388, and wait for 3380 to increase your position, and the target is the same as above.
Analysis of short-term gold trading on July 22Technical aspects:
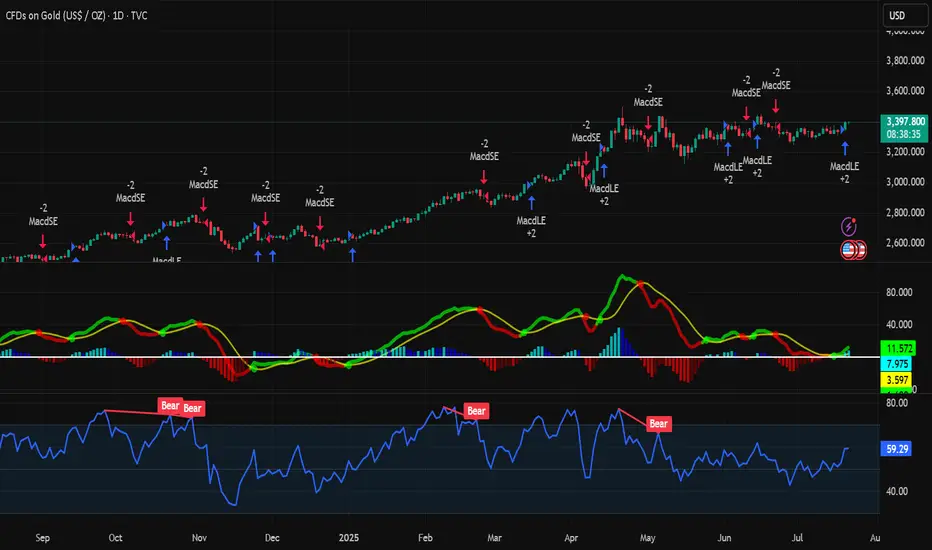
From the daily candlestick chart, gold has recently shown signs of breaking upward after five weeks of sideways fluctuations. In terms of MACD indicators, the MACD bar chart has turned from green to red, and the fast and slow lines have formed a "golden cross", strengthening the expectation of a short-term technical rebound.
At the same time, the 14-day RSI index rebounded to 57.67, still in the neutral and strong area, and has not yet entered the overbought area, indicating that the price still has room to rise. Analysis shows that the middle track of the Bollinger Band 3342 constitutes initial support, while the strong support below is at the two previous lows of 3247.87 and 3120.64.
If the bulls maintain their advantage above the integer position of 3400, they are expected to hit the high point of 3451.14 in the short term, and even further test the historical high of 3499.83; on the contrary, if they fall back below 3342, the short-term upward momentum will be tested.
Bull analysis:
If gold successfully stands above 3400, the market will turn its attention to the two key resistance areas of 3451 and 3499, the high point of the year. Breaking through the former will open up the space to test the historical high upward; combined with the current MACD golden cross pattern, if the capital side and the fundamentals continue to cooperate, it is not ruled out that there will be a short-term accelerated rise.
Bear analysis:
If the breakthrough fails, especially if gold falls back below the middle track of Bollinger, the adjustment pressure will be restarted, and the lower edge of the previous consolidation range of 3300 will constitute an important support. If it falls below again, it is necessary to pay attention to the important technical support near 3247 and the 100-day moving average of 3180.
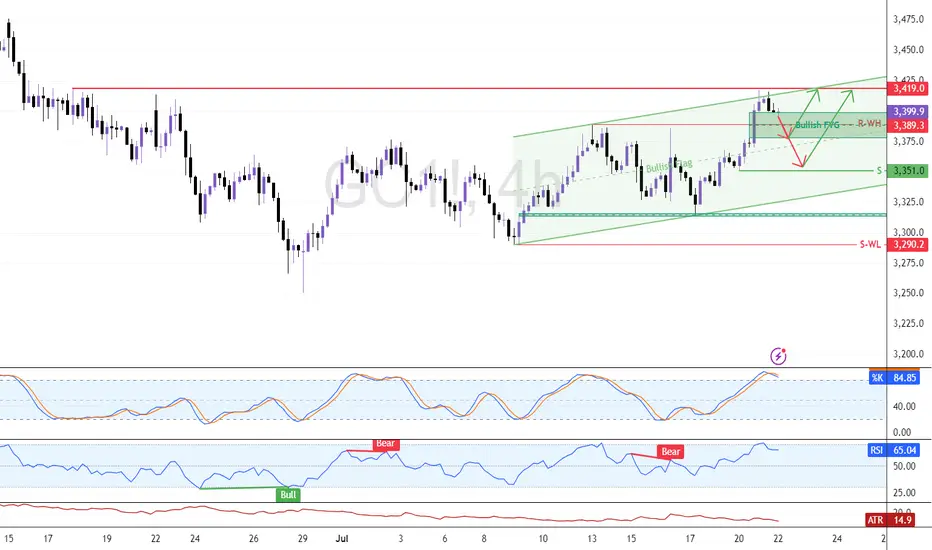
Eye These Levels to Go Long On GoldFenzoFx—Gold remains bullish but eased at $3,419.0 resistance. The Stochastic at 85.0 suggests a pullback may follow. Traders can watch support at $3,389.0 for short-term scalping.
Swing entries may emerge near $3,351.0 if bullish signals appear, such as candlestick patterns, structure breaks, or fair value gaps. Updates will follow if price reacts to these levels.
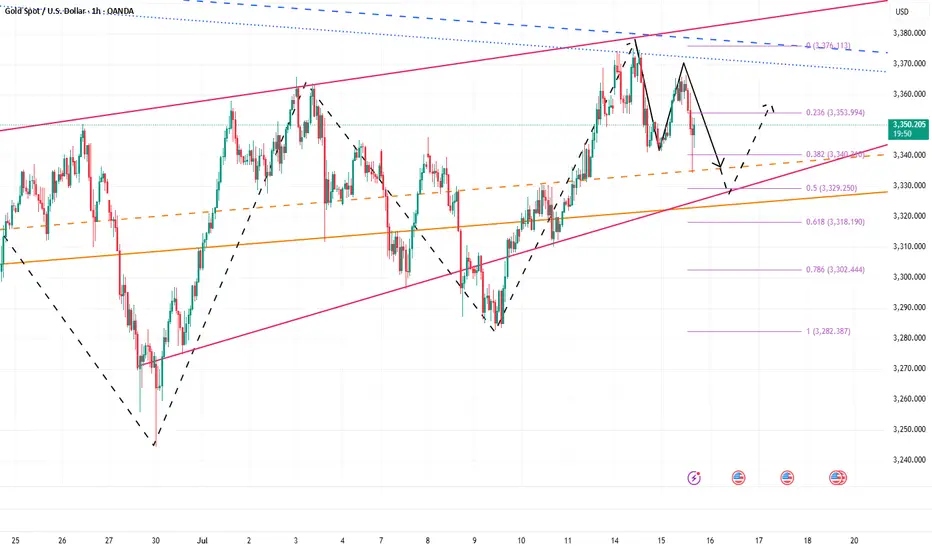
7.22 Gold falls back and continues to be bullish, 3400 is not thFrom the 4-hour analysis, the short-term support below is 3370, the important support is 3350-55, and the upper resistance is 3400-05. The overall support during the day is to maintain the main tone of high-altitude and low-multiple cycles in this range. For the middle position, watch more and do less, be cautious in chasing orders, and wait patiently for key points to enter the market.

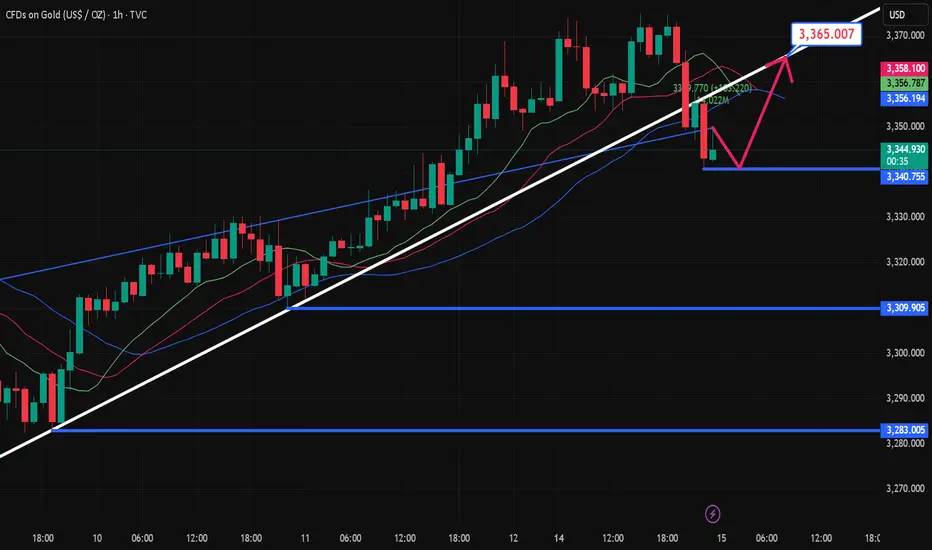
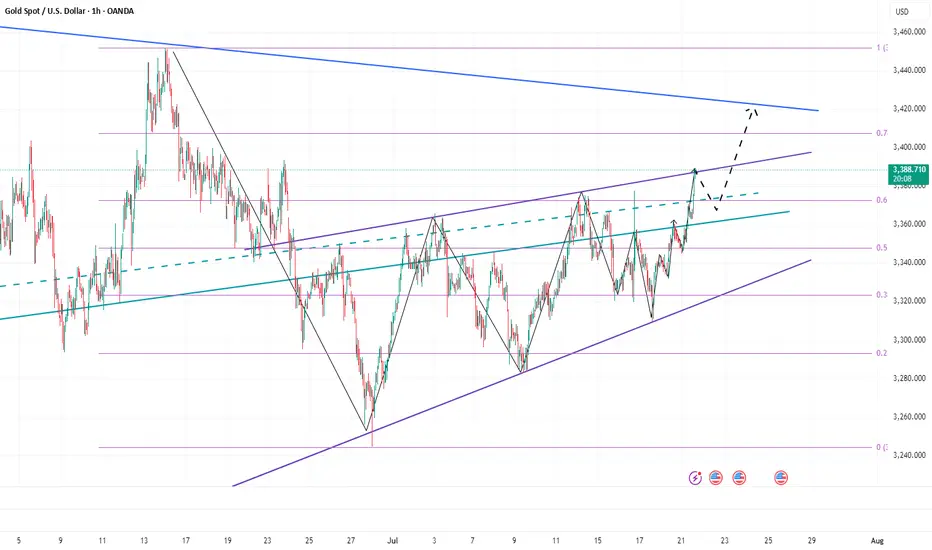
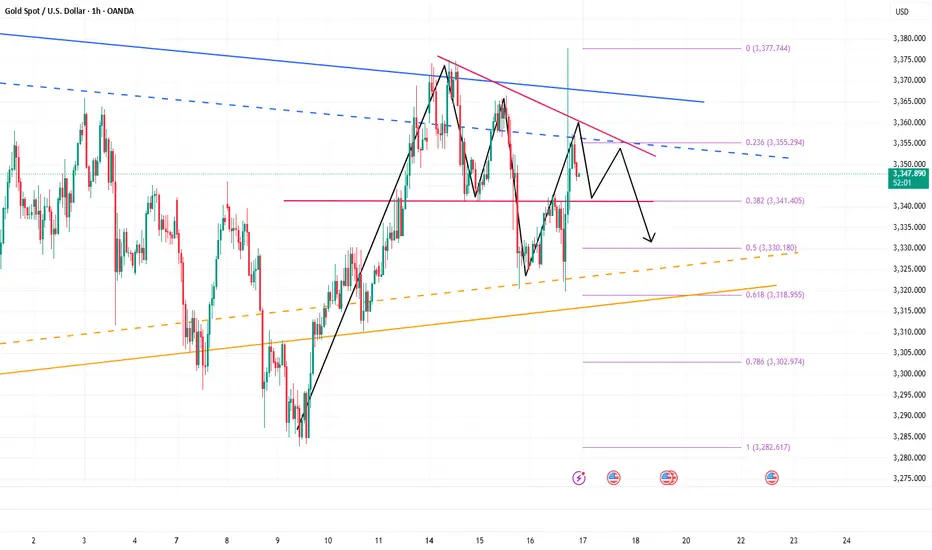
Warning Signs After Gold’s Sharp Rise — Is a Pullback Coming?Today, gold rebounded from around 3345, and has now rebounded to around 3389, which is only one step away from the 3400 mark. Gold has hardly retreated during the rise, and the rise is strong. However, we can see from the small-level candle chart that gold suddenly accelerated its rise after consolidating around 3365, and continued to around 3390, and is now oscillating near the recent high trend line.
After gold accelerated its rise and oscillated near the recent high trend line, this made me have to be more cautious, because we must be careful that the acceleration of gold's rise in the short term is a trap for buyers, so even if we are bullish on gold in the short term, we should not directly chase gold at a high level; according to the current structure of gold, I think it is necessary for gold to retest the 3370-3360 area support before continuing to rise and hitting 3400. Only after verifying that the support in this area is effective can it be conducive to a better rise in gold!
So for short-term trading, I think we can still try to short gold now, and then wait patiently for gold to retest the 3370-3360 area.
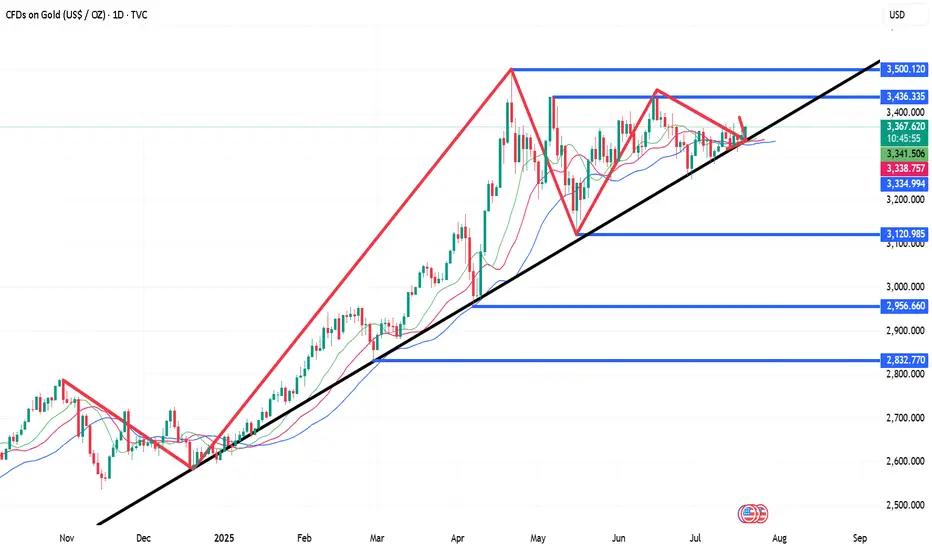
Analysis of short-term operations of gold on July 21Daily Analysis:
On the daily chart, it can be seen that gold has rebounded from the main rising trendline again, and bargain hunters have set clear risks below the trendline, betting on a price rebound to the 3438 resistance level. Bears need the price to break below the trendline to open up space for a deeper correction, with the next target looking at the 3120 level.
4-hour analysis
On the 4-hour chart, it can be seen that there is a secondary resistance area near 3377. If the price rebounds to this level, it is expected that bears will intervene here and set risks above the resistance, with the goal of pushing the price below the main trendline. Bulls will look for the price to break through this resistance to increase their bullish bets on the 3438 level.
Buy first when gold falls back, and pay attention to the strengtGold went on a roller coaster ride last week. It rose to around 3377 at the beginning of the week and then fell back under pressure. After stabilizing near 3309 on Thursday, it strengthened again on Friday and came under pressure near 3361. It fell back slightly to around 3344 at the opening in the morning and is currently rising again. In the morning, pay attention to the opportunity to buy first after the pullback, pay attention to the strength of the European session, and pay attention to the pressure near 3378/80 on the upside.

Step-By-Step Guide to Building a Winning Gold Trading Strategy
In the today's article, I will teach you how to create your first profitable gold trading strategy from scratch.
Step 1: Choose the type of analysis
The type of analysis defines your view on the market.
With technical analysis you rely on patterns, statistical data, technical indicators, etc. for making trading decisions.
Fundamental analysis focuses on factors that drive the prices of gold such as micro and macroeconomics, news and geopolitics.
A combination of technical and fundamental analysis implies the application of both methods.
For the sake of the example, we will choose pure technical approach.
Step 2: Specify the area of analysis
Technical and fundamental analysis are complex and multilayered subjects. That is why it is crucially important to choose the exact concepts and techniques that you will apply in gold trading.
For example, with a technical analysis, you can trade harmonic patterns, or apply a combination of key levels and technical indicators.
With fundamental analysis, you can build your trading strategy around trading the economic calendar or important news releases.
Here we will choose support & resistance levels and smart money concepts.
Step 3: Select a trading time frame
Your trading time frame will define your trading style. Focusing on hourly time frame, for example, you will primarily catch the intraday moves, while a daily time frame analysis will help you to spot the swing moves.
You can also apply the combination of several time frames.
We will choose the combination of a daily and an hourly time frames.
Step 4: Define your trading zones
By a trading zone, I mean an area or a level on a price chart from where you will look for trading opportunities.
For example, a technical indicator trader may apply moving average as the trading point.
For the sake of the example, we will choose support and resistance levels on a daily time frame as our trading areas.
Step 5: Choose confirmations
Confirmation is your entry reason . It is the set of conditions that indicates a highly probable projected outcome.
For an economic calendar traders, the increasing CPI (inflation) figures can be a solid reason to open a long position on Gold.
Our confirmation will be a local change of character on an hourly time frame.
Step 6: Define your stop loss placement, entry and target selection and desired reward to risk ratio
You should know exactly where should be your entry point, where will be your stop loss and where should be the target.
We will open a trading position immediately after a confirmed change of character, stop loss will lie below the lows if we buy or above the highs if we sell.
Target will be the next daily structure.
Minimal reward to risk ration should be 1.5.
Step 7: Define Your Lot Size and Risk Per Trade
You should have precise rules for the calculation of a lot size for each trade.
For our example, we will strictly risk 1% of our trading deposit per trade.
Step 8: Set trade management rules
When the trade is active, trade management rules define your action:
for example, whether you strictly wait for tp or sl, or you apply a trailing stop loss.
In our strategy, we will move stop loss to entry 10 minutes ahead of the release of the US news in the economic calendar.
Step 9: Back test your strategy
Study the historical data and back test at least 50 trading setups that meet your strategy criteria.
Make sure that the strategy has a positive win rate.
Step 10: Try a trading strategy on a demo account
Spend at least a month on demo account and make sure that you obtain positive overall results.
If you see consistent profits on a demo account, it is the signal for you that your strategy is ready , and it's time to start trading on a real account.
In case of negative results, modify your trading conditions and back test them again, or build a new strategy from scratch.
❤️Please, support my work with like, thank you!❤️
I am part of Trade Nation's Influencer program and receive a monthly fee for using their TradingView charts in my analysis.
7.18 Gold intraday operation strategy, short-term short first stFrom the 4-hour analysis, the short-term support below continues to focus on around 3316-25, the short-term suppression above focuses on the 3340-45 line, and the key pressure above focuses on the 3380 line. The overall support of 3316-3345 range still maintains the main tone of high-altitude and low-multiple cycles. In the middle position, watch more and do less, be cautious in chasing orders, and wait patiently for key points to enter the market.
False breakout? Gold reverses sharply after news surgeBecause of the news that Trump hinted at firing Powell, gold surged strongly in the short term and passed to 3377, recovering the recent decline in one fell swoop. We went long on gold near 3323 in advance, and went long on gold near 3340 again after gold retreated, hitting TP: 3345 and 3355 respectively. The two long trades successfully made a profit of 370pips, with a profit of more than $18K.
Although gold has risen sharply in the short term and effectively destroyed the downward structure, it is mainly news that drives the market. After Trump denied firing Powell, gold rose fast and fell fast. So we can't chase long gold too much. First, the sustainability of the news-driven market needs to be examined, and second, the certainty of Trump's news is still unreliable. He always denies himself the next day.
After the gold price retreated quickly, a long upper shadow appeared in the candlestick chart, indicating that the upper resistance should not be underestimated. Therefore, we should not rush to buy gold. We can still consider shorting gold in the 3355-3365 area. We should first focus on the area around 3340. If gold falls below this area during the retreat, gold will return to the short trend and test the area around 3320 again, or even fall below this area after multiple tests and continue to the 3310-3300 area.
Analysis of 7.17 Gold Operation: Buy High and Sell LowYesterday, the trend of gold in the first half was quite regular. The rebound in the Japanese session was under pressure, and the European session continued to fall back to test the 3320 mark. The key here has been repeatedly emphasized yesterday. The gold market in the second half was more exciting. First, the news was released that Trump was ready to draft the dismissal of the Federal Reserve Chairman. Gold directly rose by 50 US dollars and broke through the recent high of 3375. Then he said that he had no intention of dismissing the Federal Reserve Chairman. Gold rushed up and fell back by 40 US dollars. The daily line finally closed with an inverted hammer pattern with a very long upper shadow line.
After the end of this pattern, today's market is still bearish. If the market is extremely weak, it will continue to fall below 3358. Pay attention to the attack and defense of the 3320 mark below. If it falls below, it will open the downward space to test the 3300 mark. During the day, we will temporarily set the small range of 3320-3358 to run, sell high and buy low, and retreat to 3325. One low long, defend yesterday's low, look up to 3335, 3342, 3358, and then reverse high.

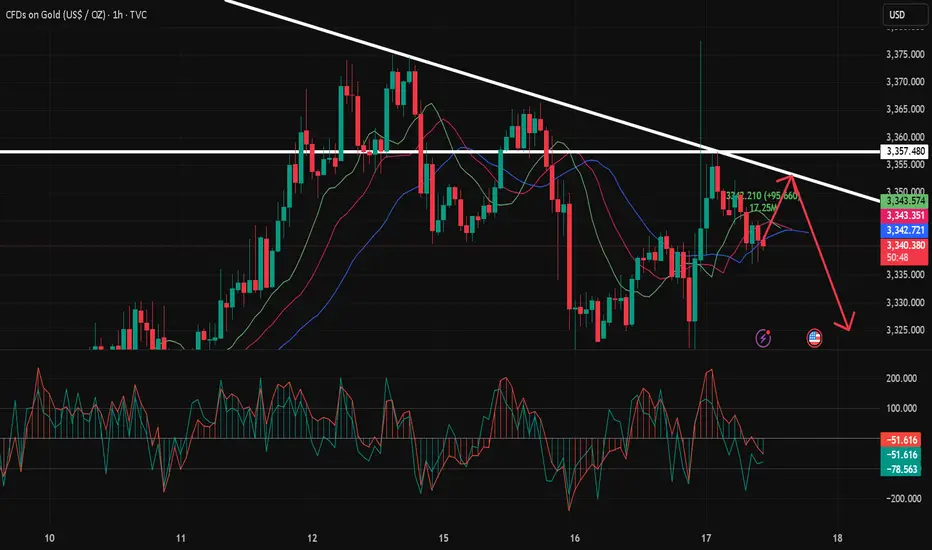
7.17 Gold Short-Term Operation Technical Analysis!!!After a strong rise in the 1-hour gold price, it quickly fell back and closed with a long upper shadow line. The gold bulls did not successfully stabilize the market. This market is actually a venting of the news. The gold bulls are not very confident about rising again. The 1-hour gold moving average is still in a dead cross short pattern. So the gold rebound will continue to be short. The 1-hour gold pattern excludes the influence of the upper shadow line stimulated by yesterday's news. In fact, the whole rhythm is still fluctuating and falling. The upper shadow line is not long, and it is probably just a lure to buy more. After the ups and downs of gold last night, it rebounded again to the 3357 line or continued to fall under pressure. So gold will continue to rebound in the early trading and continue to be short at highs under the pressure of 3357.
Golden Support Holds — Bulls Poised for Another Leg Higher"If gold cannot break through the 3365-3375 area, gold will fall under pressure again, or refresh the recent low of 3341, and continue to the 3335-3325 area." Gold's performance today is completely in line with my expectations. Gold just retreated to a low of around 3320, but soon recovered above 3325, proving that there is strong buying support below.
From the current gold structure, the short-term support below is mainly concentrated in the 3320-3310 area. If gold slows down its downward momentum and its volatility converges when it approaches this area, then after the gold bearish sentiment is vented, a large amount of off-site wait-and-see funds will flow into the gold market to form strong buying support, thereby helping gold regain its bullish trend again, thereby starting a retaliatory rebound, or a technical repair rebound.
Therefore, for short-term trading, I still insist on trying to go long on gold in the 3330-3320 area, first expecting gold to recover some of its lost ground and return to the 3340-3350 area.
Gold is accelerating downward, pay attention to important supporThe U.S. inflation data for June was released overnight. The actual data showed that U.S. inflation rebounded slightly in June, but it did not exceed expectations. After the data was released, Trump made a speech at Truth A post on Social said that given the low consumer prices, the Fed should lower interest rates. He has been calling for a rate cut for some time, so the market still has some uncertainty about the timing of the Fed's subsequent rate cuts, but the probability is in September. The probability of keeping interest rates unchanged this month is high. The US dollar index is also supported and continues to rebound. Gold fluctuated higher from around 3344 in the morning of the previous trading day. During the European session, it refreshed the intraday high and touched the 3366 line under pressure and maintained repeated narrow consolidation. After the data was released, it first rebounded quickly to the 3360 line and then quickly fell back. After two repetitions, it finally moved downward. In the evening, it fell below the intraday low and once touched around 3320 and then stabilized and rebounded. The daily line closed with a middle shadow. Technically, the continuation of the previous convergence triangle after the break is currently returning to the downward channel again.
Pay attention to the pressure of 3342/44 during the day, and pay attention to the support near 3308 below. If it falls below 3308 again, it will return to the downward channel.
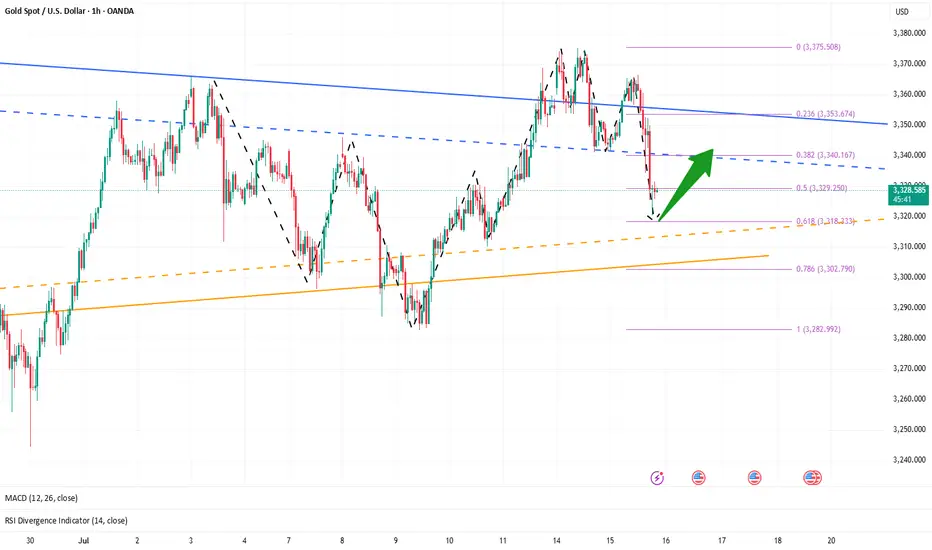
Don’t hesitate, a massive gold move Is brewingRefer to my previous trading idea. Gold retreated as expected. We almost caught the highest point of the day and shorted gold near 3365, and successfully hit TP: 3346, which enabled us to successfully profit 190pips in short-term trading, with a profit of nearly $10K, which is a good result in short-term trading.
Currently, the lowest point of gold in the retracement process has reached around 3335, which has fully released the short energy and vented the bearish sentiment in the market. All the bad news is out, which means good news! Although gold fell from 3375 to 3335, the retracement was as high as $40, but the rising structure has not been completely destroyed. The previous W-shaped double bottom support structure and the resonance effect of the inverted head and shoulder support structure still exist. As long as gold stays above 3325, gold bulls still have the potential to attack.
Moreover, after this round of retracement, the bearish sentiment of gold was vented, and the liquidity was greatly increased, attracting more buyers to actively enter the market. Gold may start a retaliatory rebound, and even touch 3375 again or even break through and continue to the 3380-3390 area.
So for short-term trading, I think we can try to go long on gold in the 3335-3325 area appropriately, first looking forward to gold regaining lost ground: 3350-3360 area, followed by 3380-3390 area.
7.15 Gold Market Analysis and Operation SuggestionsFrom the 4-hour analysis, the short-term support below focuses on the neckline of the hourly line of last Friday, 3340-45, and focuses on the support of 3325-30. The intraday retracement continues to follow the trend and the main bullish trend remains unchanged. The short-term bullish strong dividing line focuses on the 3325 mark. The daily level stabilizes above this position and continues to follow the trend and bullish rhythm. Before falling below this position, continue to follow the trend and follow the trend. Maintain the main tone of participation.
Gold operation strategy:
1. Go long when gold falls back to 3340-45, and add more when it falls back to 3325-30, stop loss 3317, target 3365-70, and continue to hold if it breaks;