Don’t be afraid of pullbacks, we can still go long on goldFundamentals:
1. First, pay attention to the dynamics of Trump and the Federal Reserve;
2. Pay attention to whether the geopolitical conflicts escalate, including the situation between India and Pakistan, Russia and Ukraine, and the situation between the United States and Iran.
Technical aspects:
Compared with yesterday, although the bullish momentum is weak, it has not fallen below the support of the 3005-2995 area, and even failed to fall below 3000. In addition, as gold fluctuates and falls, there is a large amount of buying funds entering the market in the short term. In the recent short-term structure, gold has built a very obvious turning point near the 3300 area. Therefore, gold may still rebound to above 3330 before NFP.
Short-term trading strategy:
You can still consider continuing to go long on gold in the 3310-3300 area, TP: 3325-3335
Goldtechnicalanalysis

GOLD (XAUUSD): Updated Support & Resistance Analysis
With a strong bullish rally that we saw on Gold since the beginning
of the week, I prepared for you the updated support & resistance analysis.
Resistance 1: 3340 - 3357 area
Resistance 2: 3390 - 3406 area
Resistance 3: 3440 - 3450 area
Support 1: 3235 - 3246 area
Support 2: 3135 - 3167 area
Support 3: 2957 - 2983 area
Consider these structures for pullback/breakout trading.
❤️Please, support my work with like, thank you!❤️
I am part of Trade Nation's Influencer program and receive a monthly fee for using their TradingView charts in my analysis.

Gold is brewing a big drop!After the tariff issue was moderately cooled, gold returned to calm and volatility gradually narrowed! From the candle chart, although gold did not form an effective decline, the bullish momentum slowed down significantly!
Since gold rose near 2970, it has reached a high of around 3246. The bulls did not get a respite. After the news returned to calm, gold may usher in a technical retracement repair; gold has been blocked near 3246 many times in the past two days, and the upper shadow line clearly shows a rejection signal! In the current gold structure, gold has formed a secondary high point near 3232, and it is very likely to combine the 3246 high point to form a double top structure, which is conducive to the decline of gold to a certain extent;
In addition, compared with the market's expected targets of 3300 and 3400, the upper side belongs to an unknown area and is more risky, while the lower side has a previous historical track. From the perspective of market psychology and risk preference, gold prices may be more willing to retreat.
So in the short term, I will still not give up my short position. Once gold falls below the 3205-3200 zone, the area around 3190 will not be able to stop the decline of gold. The retracement target area is located in: 3160-3140 zone.
The trading strategy verification accuracy rate is more than 90%; one step ahead, exclusive access to trading strategies and real-time trading settings

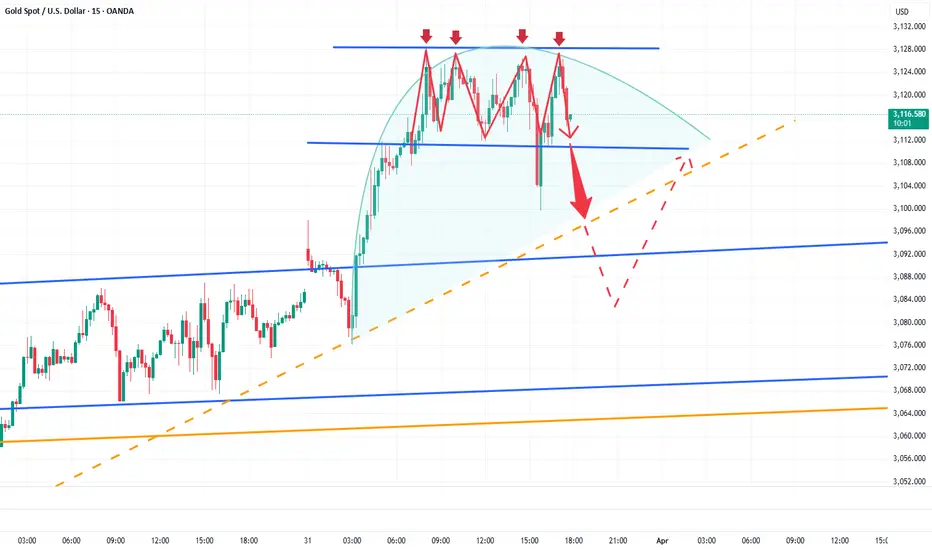
Gold’s decline is not over yet, aim at: 3160-3150Gold fell below the 3200 mark several times during the test. Although it recovered above 3200 several times, the rebound momentum is gradually weakening, giving short sellers the opportunity to counterattack.
From the perspective of the morphological structure, gold has perfectly constructed an arc top structure, laying a solid foundation for gold to usher in a retracement at any time. The 4-hour candle chart shows that the fall has just begun, so gold still has plenty of room for retracement. At present, gold has rebounded slightly after touching around 3200, but if it cannot break through the 3216-3220 zone during the rebound, it will further confirm the downward trend of gold, then gold will inevitably retreat to the 3160-3150 zone, and in the process of decline, once the profit chips are cashed in or even panic selling is triggered, gold may even have the opportunity to retreat to the 3130-3120 zone!
Therefore, in terms of short-term trading, I still advocate shorting gold in batches. The decline of gold has not ended. Let us look forward to gold bringing us huge profits during the retracement!
The trading strategy verification accuracy rate is more than 90%; one step ahead, exclusive access to trading strategies and real-time trading settings

GOLD (XAUUSD): Support & Resistance Analysis For Next Week
Here is my latest structure analysis
and important support & resistance levels/zone on Gold for next week.
Consider these structures for pullback/breakout trading.
❤️Please, support my work with like, thank you!❤️
I am part of Trade Nation's Influencer program and receive a monthly fee for using their TradingView charts in my analysis.

GOLD (XAUUSD): The Next Important Resistance Levels
Gold updated the All-Time High yesterday and trades
in the no-man's land again.
Here are the next potentially significant resistances
based on psychological levels.
Resistance 1: 3247 - 3252 area
Resistance 2: 3397 - 3302 area
Important historic supports:
Support 1: 3128 - 3167 area
Support 2: 2953 - 2982 area
Consider these structures for pullback/breakout trading.
❤️Please, support my work with like, thank you!❤️
I am part of Trade Nation's Influencer program and receive a monthly fee for using their TradingView charts in my analysis.

It is hard not to make a profit by trading CPI like thisI have to say that gold is indeed in a bullish pattern at present. After all, gold did not even fall below 3110 during the correction process. However, the current fluctuations are relatively cautious, and we are waiting for the guidance of CPI data, which may exacerbate short-term fluctuations!
To be honest, although gold is in a bullish pattern, the resistance above cannot be ignored, especially the 3150-3155 area and the previous high of 3167. It is not ruled out that gold will form a secondary high during the rise and form a double-top structure with the previous high of 3167, so I will not be a radical in the short term and set the target at 3200.
In addition, during the CPI data period, it is not ruled out that gold will rise and then fall back, so I do not advocate blindly chasing gold. On the contrary, I will definitely try to short gold in the 3050-3060 area. However, the market's long sentiment is high, and it is not advisable to have too high expectations for the magnitude of the correction in short-term trading. The first retracement target area is: 3105-3095, followed by 3080!

Buy gold, expect a rebound to 3000Gold just fell to 2958, but quickly rebounded to above 2965. The short-term support of 2965-2960 was not effectively broken. Gold quickly recovered above the short-term support, proving that bulls still have room to fight back. I expect gold to at least rebound and test the 3000 position again, so in short-term trading, we should not be too bearish on gold.
I actually reminded everyone in the last article update that we can buy gold when gold falls. In this extremely fierce market, with a cautious trading mentality, I actually do not expect too much about the rebound space of the bulls. Once gold touches around 3000, I will leave the market safely and lock in profits!
The trading strategy verification accuracy rate is more than 90%; one step ahead, exclusive access to trading strategies and real-time trading settings

Gold still has the potential to bounce back to 3070!Gold has been experiencing significant volatility driven by fundamental factors. While bearish sentiment appears to remain dominant, the recent downside move has already priced in much of the negative risk. As such, traders should avoid an overly one-sided bearish bias in the current environment.
After bottoming out near the 2970 level, gold staged a strong rebound. During the ensuing consolidation phase, the 3010–3000 zone has provided consistent support, signaling the emergence of a short-term demand zone. This indicates that the bulls have not completely capitulated and may attempt to stage a corrective rally toward the 3050 level, or potentially even as high as 3070.
From a short-term trading perspective, we may consider initiating long positions within the 3015–3005 range, aiming for an upside target of 3050, with a possible extension toward the 3070 resistance area.
The trading strategy verification accuracy rate is more than 90%; one step ahead, exclusive access to trading strategies and real-time trading settings

GOLD (XAUUSD): Updated Support & Resistance Analysis
Here is my latest structure analysis for Gold for next week.
Support 1: 2997 - 3015 area
Support 2: 2952 - 2955 area
Support 3: 2916 - 2933 area
Support 4: 2880 - 2890 area
Support 5: 2832 - 2858 area
Resistance 1: 3136 - 3167 area
Consider these structures for pullback/breakout trading next week.
❤️Please, support my work with like, thank you!❤️
I am part of Trade Nation's Influencer program and receive a monthly fee for using their TradingView charts in my analysis.

GOLD (XAUUSD): Detailed Support Resistance Analysis
Here is my latest structure analysis for Gold.
Vertical Structures
Vertical Support 1: Rising trend line
Horizontal Structures:
Resistance 1: 3149 - 3151 area
Support 1: 3099 - 3104 area
Support 2: 3048 - 3057 area
Support 3: 3024 - 3036 area
Support 4: 2997 - 3001 area
Consider these structures for pullback/breakout trading.
❤️Please, support my work with like, thank you!❤️
I am part of Trade Nation's Influencer program and receive a monthly fee for using their TradingView charts in my analysis.

Gold Investors Beware: Bears Are Quietly AssemblingGold’s candlestick chart has displayed multiple upper shadows above the 3025-3030 zone, widely regarded as a clear rejection signal. With repeated failures to break through this resistance, gold is showing signs of forming a potential short-term top. This not only caps the upside but could also act as a key indicator of a possible bearish reversal.
Following the Asian session's opening, gold experienced a slight gap up but failed to sustain its momentum, maintaining a range-bound movement instead. The lack of strong bullish follow-through reflects weak buying interest.
Additionally, recent statements from Trump suggest a softened stance on tariff policies, with his rhetoric appearing less aggressive. If the tariffs are implemented in a more moderate manner or market reactions are less severe than anticipated, risk-off sentiment could subside, leading to a significant pullback in gold prices.
But given the presence of strong buying interest and bullish sentiment consolidation, expectations for an extensive decline remain limited. The primary support to monitor lies in the 3110-3100 range. If gold break below this zone, it may trigger an accelerated drop, with the next downside target at the 3095-3085 region.
The trading strategy verification accuracy rate is more than 90%; one step ahead, exclusive access to trading strategies and real-time trading settings

Good news for bears, gold will fall back to 3095-3085Driven by Trump’s tariff policies and geopolitical risks, gold has sustained a strong upward trajectory. However, after reaching around 3128, its momentum has visibly slowed, with multiple signs of pullbacks emerging within the short-term structure.
From the candlestick chart, it’s evident that gold has faced repeated rejection signals above 3125, characterized by long upper shadows. The 3125 level has now formed a notable resistance zone and appears to be acting as a short-term consolidation high. This price action increases the likelihood of a potential top formation.
Moreover, gold’s recent strength is largely attributed to growing concerns of a global trade war sparked by Trump’s tariff policies, prompting investors to rotate out of risk assets like equities and into safe-haven assets such as gold. However, if Trump softens his stance on the tariffs or adopts a more diplomatic approach to maintain confidence in the U.S. dollar, risk appetite may recover. This would likely drive funds back into equities and other risk assets, leading to an outflow from gold.
For gold trading, I prefer to avoid aggressively chasing long positions at this stage, as downside risks persist. If gold fails to decisively break through the 3125-3135 resistance zone, the bullish momentum may weaken, increasing the likelihood of a downward move. If gold break below the 3100 level during a pullback, it could accelerate further declines, with potential targets in the 3095-3085 range.
The trading strategy verification accuracy rate is more than 90%; one step ahead, exclusive access to trading strategies and real-time trading settings

Multiple top signs appear, short gold!Although gold rebounded quickly after hitting 3100, it does not rule out the process of testing and confirming the top. I think that in the short term, we can still short gold in batches with the help of 3025-3035 zone suppression. Then wait patiently for gold to retrace!
If gold can fall below the 3100-3095 zone during the decline, gold may accelerate downward to the area around 3085 under the stimulation of selling. Let us wait and see!
The trading strategy verification accuracy rate is more than 90%; one step ahead, exclusive access to trading strategies and real-time trading settings
Short gold, pullback to 3110-3095 zoneToday gold rebounded sharply after falling back to around 3076. The current highest rebound is around 3128. The current highest rebound is around 3128. Although part of the reason is due to the support of the market's risk aversion, I think it is more of a catharsis of the market's bullish sentiment.
So at this time, we should not chase long gold; because with the sharp rebound of gold, the risk of going long is gradually accumulating; secondly, we can refer to the trend of silver. After reaching the high point, it has begun to fall. I think gold may refer to the trend of silver and choose to fall in the short term.
Therefore, in terms of short-term trading, you may wish to consider shorting gold in the 3125-3135 zone, and the 3105-3095 zone is the first focus of our attention to long gold levels after a short-term correction.
You must keep your trading mind active, only in this way can you avoid too many stupid trading signals.The trading strategy verification accuracy rate is more than 90%; one step ahead, exclusive access to trading strategies and real-time trading settings

Gold Approaches 3100, Short Opportunity EmergesGold has reached a high of around 3085, now just a step away from the 3100 level. However, for short-term trading, I view the 3085-3105 range as an ideal zone to consider short positions on gold.
📍Short-Term Trading Strategy:
Consider scaling into short positions within the 3085-3105 range. Pay close attention to position sizing and risk management when setting up trades.
📍Key Support Levels to Watch:
-First target: 3065-3055
-Second target: 3045-3040
The trading strategy verification accuracy rate is more than 90%; one step ahead, exclusive access to trading strategies and real-time trading settings

Gold (XAU/USD) Technical Analysis and Surge Factors Current Price: Gold is trading around $3,074.31 per ounce, marking a significant rise of 0.6% and reaching a record high of $3,077.44.
Technical Analysis
Support and Resistance Levels:
Support: The psychological level at $3,000 has been a robust support, with prices consistently holding above this mark during recent consolidations.
Resistance: The new all-time high at $3,077.44 now serves as the immediate resistance level.
Moving Averages:
The 50-day Simple Moving Average (SMA) is trending upward, reinforcing the ongoing bullish momentum.
Relative Strength Index (RSI):
The RSI is approaching overbought territory, suggesting that while the bullish trend is strong, a short-term pullback could occur.
Key Factors Behind Today's Surge
U.S. Tariff Announcements:
President Donald Trump's recent implementation of a 25% tariff on auto imports has intensified fears of a global trade war. This uncertainty has driven investors towards safe-haven assets like gold.
Market Reactions:
The announcement led to a decline in Asian stock markets, with significant losses in South Korea and Japan. The auto industry, vital to these economies, faced substantial impacts, prompting investors to seek refuge in gold.
Analyst Forecasts:
Financial institutions have revised their gold price forecasts upwards. Citi Research increased its three-month gold price target to $3,200 per ounce, citing robust demand from official sectors and exchange-traded funds.
NOTE
Gold's ascent to record highs is primarily driven by escalating trade tensions and the resultant market uncertainty. Technical indicators support the bullish trend, though caution is warranted due to potential overbought conditions. Investors should monitor geopolitical developments and market reactions closely, as these will continue to influence gold's trajectory in the near term.
Stay Informed & Trade Wisely! 🛡️📈

Gold Faces Repeated Rejections, Bearish Outlook RemainsAlthough gold has yet to confirm a significant downtrend, it has faced multiple rejections around the 3030-3040 resistance zone in recent sessions. Notably, after touching 3036 yesterday, gold experienced a sharp pullback, forming a long upper shadow on the candlestick chart. This price action has diminished the supportive effect of the underlying W-bottom structure.
If gold continues to struggle to break above the 3030-3040 zone, the current seemingly strong price action may prove to be a false signal, merely a setup for a subsequent decline. Additionally, with geopolitical risks easing and no significant fundamental drivers supporting further upside, I remain optimistic about a bearish continuation in gold.
We can consider scaling into short positions within the 3028-3038 range, patiently targeting a retest of the 3010-3000 zone. A confirmed break below 3000 could accelerate further downside toward the 2995-2985 region.
I would make more detailed trading plans and trading signals every day according to the real-time market situation, which is also the testimony of every successful transaction and profit of mine; the article has a certain lag, if you want to copy the trading signals to make a profit, or master independent trading skills and thinking, you can choose to join the channel at the bottom of the article

Gold is expected to rise to the 3030-3040 zone againGold encountered a clear rejection signal after reaching around 3036, indicating the presence of resistance and a technical need to retest support. Currently, gold is undergoing this support retest.
Within the current structure, gold has established a notable W-bottom pattern, with key support formed around the 3000 and 3003 levels. This structural support remains relatively strong. If gold manages to hold above the 3015-3005 support zone during the retest, a renewed upward move is likely. In that scenario, gold could resume its ascent, potentially retesting the 3030-3040 resistance range.
So in terms of short-term trading, if gold pulls back to the 3015-3005 zone, we can consider going long on gold in moderation.I would make more detailed trading plans and trading signals every day according to the real-time market situation, which is also the testimony of every successful transaction and profit of mine; the article has a certain lag, if you want to copy the trading signals to make a profit, or master independent trading skills and thinking, you can choose to join the channel at the bottom of the article

Gold Likely to Extend Decline Toward the 2995-2985 ZoneGold encountered resistance and pulled back after reaching around 3026 during the rebound, failing to break the descending channel effectively. In the short term, bearish momentum remains dominant. On the daily chart, gold has closed with three consecutive bearish candlesticks, it weakens rebound expectations and suggests further downside remains possible.
The key short-term level to watch is around 3010. If gold breaks below this level during the pullback, the downtrend structure will become more pronounced. This would likely lead to another test of the 3000 level, with further downside potential extending toward the 2995-2985 range.
I remain committed to shorting gold on rebounds. My primary plan is to enter short positions within the 3020-3030 range. I will make more detailed trading plans and trading signals every day according to the real-time market situation, which is also the testimony of every successful transaction and profit of mine; the article has a certain lag, if you want to copy the trading signals to make a profit, or master independent trading skills and thinking, you can choose to join the channel at the bottom of the article

The rebound presents a perfect opportunity to short gold.📍Gold has once again rebounded to the 3020-3025 range in the short term. You might think the bulls have regained control, but I see this rebound as a prime opportunity to short gold.
📍Currently, a new descending channel has formed within gold’s short-term structure. Despite multiple rebound attempts, the price has failed to break above this channel, further reinforcing its downward pressure. Additionally, on the daily chart, gold has printed three consecutive bearish candlesticks, undermining bullish sentiment and weakening confidence. This has also diminished the effectiveness of the 3000 support level, increasing the likelihood of further downside.
🔎Trade Idea:
Xauusd: Sell at 3015-3025
TP:3005-2995
SL:Adjust according to risk tolerance.
📩Trading means that everything has results and everything has feedback. I have been committed to market trading and trading strategy sharing, striving to improve the winning rate of trading and maximize profits. If you want to copy trading signals to make a profit, or master independent trading skills and thinking, you can follow the channel at the bottom of the article to copy trading strategies and signals

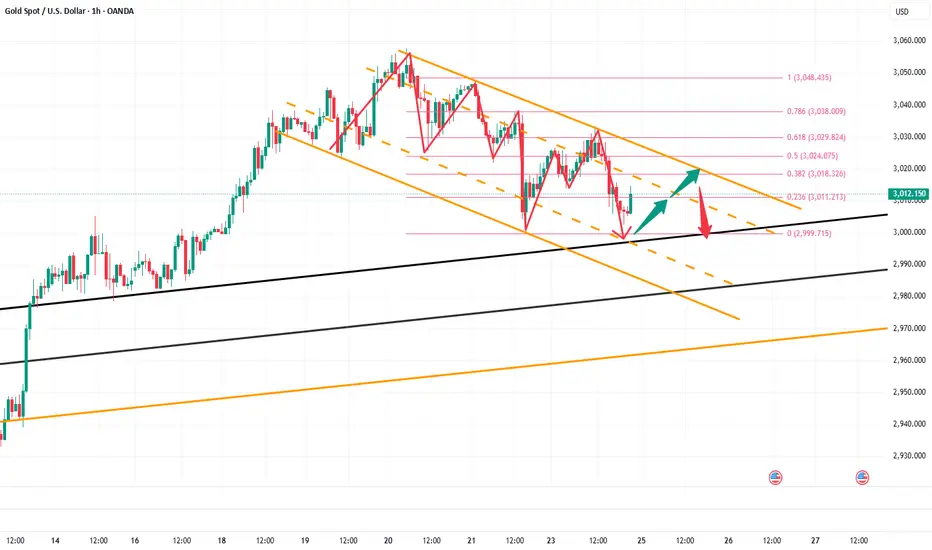
The downward channel appears, or there will be a deep callback📍Gold's current upward momentum appears weak, with signs of a descending channel forming in the short-term technical structure. If gold fails to decisively break through the 3015-3025 resistance zone, it will confirm and reinforce the descending channel pattern, exerting further technical pressure on the metal.
📍Moreover, if gold breaks below the critical 3000 level during its decline, it would severely undermine bullish confidence, triggering further downside. In this scenario, the downside potential would expand, with gold likely extending its decline toward the 2990-2980 support zone.
🔎Trade Idea:
Xauusd: Sell at 3015-3025
TP:3005-2995
SL:Adjust according to risk tolerance.
📩Trading means that everything has results and everything has feedback. I have been committed to market trading and trading strategy sharing, striving to improve the winning rate of trading and maximize profits. If you want to copy trading signals to make a profit, or master independent trading skills and thinking, you can follow the channel at the bottom of the article to copy trading strategies and signals

Short gold at the right time after rebound📍Gold experienced a sharp decline to around 3002 in the short term — did it catch you off guard? Despite the rapid drop, I remained committed to my trading logic and strategy. As long as gold holds above the 3005-2995 support zone, a rebound toward the 3015 level remains likely. After stabilizing, gold has already rebounded above 3014, nearly reaching our target zone of 3015. In response, we opted to manually close our positions to lock in profits.
📍Looking ahead, our primary focus will be on the 3015-3025 resistance zone. In the short term, gold has shown signs of forming a descending channel structure. If it fails to decisively break above the 3015-3025 zone and invalidate the downtrend channel, there remains a possibility of a retest of the 3000 level, with further downside potential toward the 2995-2985 range.
🔎Trade Idea:
Xauusd: Sell at 3015-3025
TP:3010-3000
SL:Adjust according to risk tolerance.
📩Trading means that everything has results and everything has feedback. I have been committed to market trading and trading strategy sharing, striving to improve the winning rate of trading and maximize profits. If you want to copy trading signals to make a profit, or master independent trading skills and thinking, you can follow the channel at the bottom of the article to copy trading strategies and signals