🔃🔃 ( GOLD first Long) and short) technical analysis 👍Hello traders 💯 what do think about Gold moving this week?
I think 💭 gold moving this week first Long 2030 + 2040 Breakdown fullback down 👇
2000+ 1980
Technical analysis 👍👇
TVC:DXY FXOPEN:XAUUSD
DXY INDEX FULLBACK Up this week 105.000 FXOPEN:XAUUSD TVC:DXY
Technical analysis 👍👇
Safe trade ❤ plaes like ❣️ and comments FXOPEN:XAUUSD TVC:DXY
Goldtrade

⤵⤵ gold fundamental analysis)technical analysis). traders are you looking for a bearish trandline gold Market this week gold fullback down 👇 1980? Gold seller reject the resistance levels breakdown I think 💬 gold moving down 2040 fullback down 1980
Fundamental Analysis of Gold FXOPEN:XAUUSD TVC:DXY
The outlook created by the fundamental analysis of the gold market remains strong with the growing uncertainty in the world economy and rapidly expanding money supply. As governments try to cope with financial turbulence, they print more and more fiat money (money that is not backed with material assets). This fuels inflation that eats away government bonds yields. If the yields themselves are lower than the inflation, then you actually lose purchasing power by holding these bonds. In such a situation, investors switch to assets they believe will allow them to preserve their wealth. Gold is precisely one of such assets.
Entry 2021
Entry 2040
Target 1980
safe trade ❣️🙏 pales like 👍 and comments 👇

XAUUSD Top-down analysis Hello traders, this is a complete multiple timeframe analysis of this pair. We see could find significant trading opportunities as per analysis upon price action confirmation we may take this trade. Smash the like button if you find value in this analysis and drop a comment if you have any questions or let me know which pair to cover in my next analysis.

gold short scalp tradeThe price has rejected the high end of its range, which has been consistent over the past few weeks. After the breakout, there has been no proper retest. We are considering taking a bearish approach to finish off the move, but keep in mind this makes scalping a bit risky since it could potentially retest the breakout. It's important to manage the trade properly, especially since this is an Asian trade.

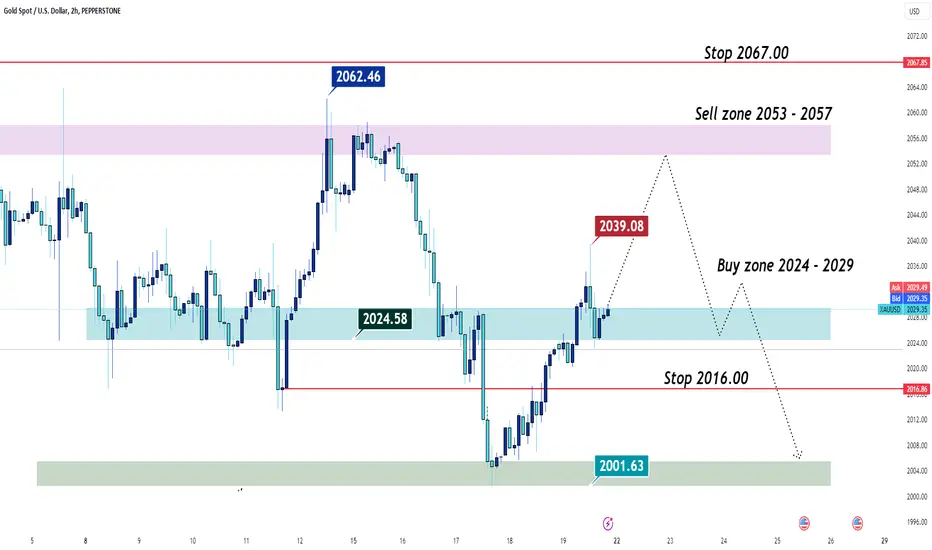
XAUUSD buy order at 2029.00XAUUSD 1H Classic bullish formation trading type should be swing Trade.
Analyze recommends opening a buy order at 2029.00 and one more buy limit of 2024.00.
Target should be 2035 - 2040 - 2050. And stop Lost 2016.00. Use proper money management.
GOLD H1 / FVG TAKEN / GOOD OPPORTUNITY FOR A LONG TRADE ✅💲Hello traders!
This is my idea related to Gold H1. I see a very nice retracement from the resistance level. Also, the FVG on M15 was taken, and I expect a bullish move until the price of 2048, were we have a valid FVG.
Traders, if you liked my idea or if you have a different vision related to this trade, write in the comments. I will be glad to see your perspective.
____________________________________
Follow, like, and comment to see my content:
www.tradingview.com

GOLD H1 / SHORT TRADE ACTIVATED / STRATEGY CONFIRMED ✅Hello Traders!
In the previous analysis, I expected a retracement from the resistance level and I was looking for a short-trade from the OB.
Now we can see a very clear retracement. A good opportunity to execute short trades for scalpers or on small time frames.
Congrats to those who executed the trade.
Traders, if you liked my idea or if you have a different vision related to this trade, write in the comments. I will be glad to see your perspective.
____________________________________
Follow, like, and comment to see my content:
www.tradingview.com

Gold: go back to 1680In the chart analysis, I am examining the recent uptrend movement in the 1D timeframe.
We can observe a clear pattern of 5 impulse waves, with the fifth wave forming an Ending Diagonal. This indicates an upcoming change in the trend direction.
The price has broken below the lower trendline of the Ending Diagonal, reaching the target of the origin point of Diagonal Wave 1 as anticipated.
This confirms that our analysis is on track.
Currently, I anticipate the price to reach a level between 2007 and 20024, where it will retest the lower trendline of the Diagonal and complete Wave X of the correction.
Subsequently, we expect to see the price decline to at least 1880, which will complete Wave Y of the correction.
If the price continues to decline further, with a 1D or 4H candle closing below 1875, it is crucial to consider the possibility of being in a downtrend with 5 impulse waves.
In such a scenario, I anticipate that our Wave 3 will conclude between 1830 and 1800, followed by a corrective Wave 4, which could retrace to around 1880 before continuing its downward move to complete Wave 5 near 1680.
Note: Critical Point of Analysis: 1D or 4H candle closing above 2048/2050.


GOLD H4 / NEW TRADING IDEA ✅Hello Traders!
This is my idea related to GOLD H4. I see a good opportunity for a SHORT TRADE from the OB.
As a take profit, I see the price of 2015.
Traders, if you liked my idea or if you have a different vision related to this trade, write in the comments. I will be glad to see your perspective.
____________________________________
Follow, like, and comment to see my content:
www.tradingview.com

⤴️⤴️GPBUSD) bullish on the market) analysis)🖼️🚀The dollar crept higher on the first trading day of the year as attention turned to economic data this week that may provide clues on the Federal Reserve's next moves, while bitcoin surged ahead of $45,000 for the first time since April 2022.
The dollar index
DXY
, which measures the U.S. currency against six rivals, fell 2% in 2023, snapping two years of gains. It was last at 101.44, up 0.059%, as investors weighed the prospect of the Fed cutting rates this year.
The dollar's ascent weighed on the Japanese yen
USDJPY
the most, with the Asian currency down 0.35% at 141.36 per dollar, having slid 7% in 2023.
Rescue teams in Japan on Tuesday struggled to reach isolated areas hit by a powerful earthquake on New Year's Day, with reports of more than 20 people dead in a disaster that toppled buildings and knocked out power to thousands of homes.
Markets are now pricing in an 86% chance of interest rate cuts from the Fed to start from March, according to CME FedWatch tool, with over 150 basis points (bps) of easing anticipated in the year.
"The question is when and how fast rate cuts will be delivered," Marc Chandler, chief market strategist at Bannockburn Global Forex, said in a note.
"Moderating price pressures and weaker growth impulses have seen the pendulum of market sentiment swing dramatically from the 'higher for longer' mantra of most of last year to pricing in aggressive easing" from central banks, Chandler said.
The focus now switches to a slew of economic data due this week, including the data on job openings and nonfarm payrolls. Minutes from the last Fed meeting in December are scheduled for release on Thursday and will provide insight into the central bankers' thinking around rate cuts this year.
"The positive sentiment from end-2023 may roll over into this week as all eyes turn to the U.S. jobs report on Friday," said Nicholas Chia, macro strategist at Standard Chartered.
At its December policy meeting, the Fed adopted an unexpectedly dovish tone and forecast 75 basis points in rate reductions for 2024.
That contrasted with other major central banks, including the European Central Bank (ECB) and Bank of England (BoE), which reiterated they will hold rates higher for longer.
Still, traders are pricing in 158 bps of cuts by the ECB this year, while the BoE is also expected to cut rates by 144 bps in 2024.
The euro
EURUSD
was down 0.13% to $1.103, inching away from the five-month peak of $1.11395 it touched last week. The single currency gained 3% last year, its first yearly gain since 2020.
Sterling
GBPUSD
was last at $1.2729, up 0.05% on the day, having clocked its strongest performance last year since 2017 with a 5% gain, although a weakening economy and election uncertainty make a repeat performance unlikely.
Elsewhere, the Australian dollar
AUDUSD
was up 0.35% at $0.68335. The New Zealand dollar
NZDUSD
was little changed at $0.63155.
The crypto world started the year with a bang, with bitcoin
BTCUSD
touching a 21-month peak of $45,532 on rising expectations that the U.S. Securities and Exchange Commission would soon approve exchange-traded spot bitcoin funds.

GOLD H1 / Hello Traders!
This is my idea related to GOLD H1. I expect a retracement from the important resistance level at the price of 2048 where I will search for a LONG TRADE in case of confirmation.
Traders, if you liked my idea or if you have a different vision related to this trade, write in the comments. I will be glad to see your perspective.
____________________________________
Follow, like, and comment to see my content:
www.tradingview.com

📊 (GOLD DOUBLE TOP) if breakout) 2090 moving)💥💥hello trader’s what do you think about gold) ?
Traders are looking 👀 a double top
Resistance levels if breakout. Nxet Target 2090 Waiting for breakout
key levels 2043
key levels 2076
Key levels 2090
(Follow me don’t miss next ideas)

GBPJPY) 4H) tame frame ) analysis)Speculation about when the Bank of Japan will end its negative interest rate policy (NIRP) has been rife, but seen as more likely to come in January than December.
Price action in JPY-related FX option markets isn't offering many clues, with increased demand and high volatility risk premiums for both meetings, and also for a speech by BoJ Governor Kazuo Ueda on Dec. 25.
Deutsche shares sentiment with other banks who expect the Bank of Japan to maintain its current monetary policy framework in December, while hinting at an end to the NIRP at its Jan. 23 meeting. Deutsche attribute a 60% probability to hints being made.
In terms of fundamentals, Deutsche believe that ending NIRP in January is appropriate because the forecast in the outlook report will change since the data already imply a virtuous circle in wages and prices. In terms of practicalities, it is because financial institutions would have sufficient time to prepare for it.
Deutsche suspect that the BoJ will hint at the upcoming policy revision by including some key points in its statement; that it will assess and confirm the virtual circle between wages and prices by the January meeting, with the results to be published at the same time as the outlook report; and that, as a result of this assessment, the policy revision will be judged appropriate and it will continue to emphasize an accommodative policy stance and stable JGB markets even after the revision.
Overnight expiry FXO implied volatility

AUDUSD Top-down analysis Hello traders, this is a complete multiple timeframe analysis of this pair. We see could find significant trading opportunities as per analysis upon price action confirmation we may take this trade. Smash the like button if you find value in this analysis and drop a comment if you have any questions or let me know which pair to cover in my next analysis.

GOLD M45, Key level, see why ... 📈Hello Traders!
I'm coming up with updates related to GOLD M45.
As you can see, GOld took the liquidity level mentioned in the previous post, I consider it an important level to execute a LONG TRADE.
Also, on the chart, we can recognize the level of accumulation , for now, we are in the manipulation stage, and I expect a distribution until the 2060 level.
Follow, like, and comment to see the daily/weekly content.💯
www.tradingview.com

Buy Zone and Target for GOLDGold reached ATH!!!
Here is my buy zone and target!
Play safe, i would NOT short this!

Emergency alert for all gold bugsThe Month of May is days away from closing. A ‘shooting star’ candle is printing. Price action must climb up and over 2020 to prevent this candle from printing. Should it close as is then price action will correct 20% to 1550, for starters.
This is not the bull market gold dealers are advertising (remember they are pulling it out the ground for 800 an ounce). And that is nothing before mentioning gurus all over the internet calling for 3k and beyond.
Ww

Gold Nears Six-Month Peak Amid Fed's Moderate Policy OutlookGold prices continue their positive trend for the fourth consecutive day, nearing a multi-month peak. The belief that the Federal Reserve has completed interest rate hikes and is initiating policy easing in 2024 remains supportive. From a technical perspective, the overnight breakthrough above the horizontal resistance at $2,008-$2,010 is considered a new catalyst for bullish traders. Furthermore, oscillators on the daily chart comfortably stay in the positive zone, indicating that there is still room before entering overbought conditions. This, in turn, suggests that the path of least resistance for gold prices is to the upside.
Therefore, a potential next move targeting the examination of the next relevant resistance around $2,035 seems to be a plausible scenario. This momentum could further extend towards the intermediate hurdle at $2,048 on the way to the year-to-date peak, around the $2,078 level touched in May.
On the flip side, the current breach of the resistance level at $2,010-$2,008 appears to immediately shield against downward pressure before reaching the $2,000 mark. Further selling pressure leading to a descent below the $1,988-$1,987 zone could pave the way for deeper losses. Gold prices might then swiftly descend towards the $1,978 zone on the way to the region of $1,967-$1,966 and the support area at $1,955. A convincing break below this level would expose the Simple Moving Average (SMA) 200-day, currently closing near the $1,942 area, and converging at $1,935-$1,934, encompassing the SMA 100 and 50 days.

Gold / XAUUSD ~ Nov-Dec Snapshot (2H Intraday)TVC:GOLD chart mapping/analysis for last week of November.
TBC further details/write-up via ideas section.

XAUUSD , We expect the price ...Hello guys
According to the chart that you can see the price broke the trendline and now the correction movement is 100% and now we expect the price can drop from this area and touch our targets.
IF THE PRICE CAN BREAK THE 1996 TO UP, THIS ANALYSIS WILL FAIL.
if you have any question and need any help , send us messages
Good Luck
AA

GOLD (XAUUSD): Structure Analysis & Key Levels 🥇
Here are the important key levels to watch on Gold next week.
Horizontal Key Levels
Horizontal Resistance 1: 2004 - 2010 area
Horizontal Support 1: 1931 - 1938 area
Horizontal Support 2: 1873 - 1889 area
Vertical Key Levels
Vertical Resistance 1: Falling trend line
Consider these structures for pullback/breakout trading next week.
❤️Please, support my work with like, thank you!❤️

XAUUSDTOANDA:XAUUSD
⛔"Daily crypto market analyses I provide are personal opinions & not financial advice. Trading carries risks, so do your own research & seek advisor's help.#DYOR"
Don't forget to like and comment
