Profited $12K, short gold after reboundToday we have made very good profits in both long and short gold transactions. First of all, we shorted gold today near the 2446 position. Gold successfully hit TP: 2430 during the short-term decline; after gold hit the 2407 position, it stopped falling and rebounded. We then went long gold near the 2410 position, and we manually closed the position above 2420 to make another profit. In today's transaction, I made a total profit of more than FWB:12K , which is considered a good trading result!
So is gold expected to continue to hit 2450 or even higher? In fact, as far as the short-term market is concerned, gold has continued to fall, and the signs of short-term peaking are relatively obvious. It is unlikely that it will hit a new high again in the short term.Gold has fallen from its highs and a large number of profit-making orders have been realized. Gold may even fall further. Next, we will first focus on the 2405-2400 support area. If gold falls below this area, gold will truly establish a top trend and continue its decline.
Therefore, in terms of subsequent transactions, if the market does not stabilize, do not go long gold easily. We will mainly focus on shorting gold at high levels, focusing on the 2430-2435 area at the top; focusing on the gains and losses at the 2400 position below. Trading requires courage and even more decisiveness. Execution is the only criterion for profitability.I share detailed trading strategies and trading signals every day. You can follow the channel at the bottom of the article to get detailed trading signals and learn trading logic. People who are already in it have already made a lot of money. Let us enjoy the journey of making money together. !
Goldtradeidea

20 consecutive wins, continue to short gold after reboundToday, the overall gold market is in a volatile market. Gold fell and touched near 2310 multiple times before rebounding. It touched near 2323 again and then fell back again. Gold is currently trading near 2313. Today we successfully captured the profit from gold's rebound in trading. We went long gold in the 2314-2312 area and successfully hit TP: 2322. Continuing our 20-game winning streak in gold trading! Transaction results worthy of recognition!
Gold is currently trading near the 2313 position, but I do not recommend going long on gold here. The safest trading strategy is to wait for gold to rebound and then short gold again. From the short-term structure point of view, gold rebounded many times and then fell back, but it did not effectively break through the 2330 position, which consumed the gold bull momentum to a certain extent; it also showed that there were many resistances above and it was still difficult for gold to rise.
Moreover, the situation in the Middle East has worsened, but the reaction of gold seems to be small, and there has been no sharp rise, so we still have to be cautiously bullish on gold; gold fluctuated and fell back in the short term, and it did not have enough power to break through yesterday's new high during the rebound. This volatile downward trend is expected to be maintained in the short term. As gold falls back after rising high many times, we can appropriately move the short-term resistance area downward to the 2325-2320 area; while the strong resistance area above is still at the 2330-2335 area.
So in the next trading, I will insist on shorting gold after the rebound.Friends who have followed the channel so far have made good profits as long as they follow my trading signals. If you want to receive detailed trading signals, if you want to learn the latest trading thinking and trading logic, you can choose to follow the channel at the bottom of the article, so that losses will no longer happen and making money will become a pleasure!

Are you worried about your gold long position?Gold fell back from around 2330 today and is currently oscillating within a narrow range around the 2312-2315 area. In fact, it is still quite difficult to trade gold today. It is relatively ideal to participate in shorting gold near the 2330 position, but we cannot aggressively chase short gold during the decline. Therefore, if we did not short gold near the 2330 position, then we could only wait and see.After all, gold still has the potential to attack the 2335 area.
Gold is currently oscillating within a narrow range around the 2315-2312 area. This seemingly bottom-but-not-bottom trend brings great confusion to our transactions. There should be many voices in the market that are bearish on gold to the 2290-2280 area. In fact, according to my trading thinking, although gold has fallen sharply, it still maintains a volatile attitude overall, so I will not aggressively chase gold short.
After all, the NFP market shows a long lower shadow line on the candle chart. Before falling below, gold's downside space is still limited; even if it falls below this area, it will take a certain period of time. So based on gold's own fluctuations, I don't think gold can even fall below the 2300-2395 area today.
In addition, gold has repeatedly touched the 2312 position to stop falling in the short term, and has repeatedly seen lower shadows in the ultra-short term, so the 2310-2305 area is still valid. Therefore, we can rely on the support of this area to go long gold, with the target being the 2320-2325 area.
Friends who have followed the channel so far have made good profits as long as they follow my trading signals. If you want to receive detailed trading signals, if you want to learn the latest trading thinking and trading logic, you can choose to follow the channel at the bottom of the article, so that losses will no longer happen and making money will become a pleasure!

Gold is bullish to the 2335-2345 area before falling backToday we made a good profit in gold long and short transactions, which gave us a good start for this week's trading. First, we shorted gold near the 2323 position in the morning. When gold fell back and touched the 2316 position many times, it stopped falling, so I closed the position near the 2317-2316 position in time to lock in profits in time;Then we went long gold near the 2315 position and set TP: 2328. Gold successfully hit TP during the rebound to above 2330; just now gold hit TP: 2320 again during the fall, and the total profit in today's transaction was: $23K. And continue the good results of 18 consecutive wins!
During today's rebound, gold strongly broke through the 2310-2315 resistance area and broke through the high point since May. Gold has turned from weak to strong in the short-term; it has successfully built a triple bottom structure in the short-term structure and established effective support below. The short-term upward momentum is intact, and gold still has the potential to continue to rise. However, as the weekly candle chart weakened last week, we must also be careful of the market falling back after rising high. The main pressure above is focused on the 2335-2345 area.
Therefore, we are still very flexible in the next transaction. First, we can use the support below to go long gold; after waiting for gold to rise, we can use the resistance area to short gold. In this way, we can strive for maximum profits in long and short transactions.
I share detailed trading strategies and trading signals every day. You can follow the channel at the bottom of the article to get detailed trading signals and learn trading logic. People who are already in it have already made a lot of money. Let us enjoy the journey of making money together. !

Gold stands at 2900 as expected, go long gold!Gold fell sharply to around 2281, then fluctuated sideways, broke upward and stood above 2900. Although this decline in gold exceeded my expectations, it still stopped its decline in the 2280 area. Then gold is still likely to use the 2280 area as support and replicate the trend after April 23, and may build a new upward channel in the short term.
At present, we are mainly observing two positions, one is 2290. If gold effectively stands above 2290, then gold will turn from weak to strong in the short term, and may even continue to rebound to around 2300;In addition, we need to pay attention to 2280 below. If gold falls below 2280, gold may continue its weak correction and even continue to test the 2270-2260 area downwards to find support.
Currently, I still hold a long position near the 2386 position. Now that gold is trading above 2290, we still have a certain profit. We will continue to hold it first, with a tentative target of around 2300. In addition, the Federal Reserve's interest rate decision is coming soon, which will bring us better trading opportunities and better profits waiting for us. Let us look forward to today's gold market!
I share detailed trading strategies and trading signals every day. You can follow the channel at the bottom of the article to get detailed trading signals and learn trading logic. People who are already in it have already made a lot of money. Let us enjoy the journey of making money together. !

Falling below 2300, start going long goldGold fell to 2300 as expected and continued its correction to reach a minimum near 2293. Gold shorts have an absolute advantage. We followed the trend and shorted gold today near the 2323 position. Obviously, our short position was eliminated by hitting TP and making a profit. Congratulations on once again achieving good trading results!
Gold is currently trading near the 2296 position, and gold once again hit the 2293 position to stop falling and rebound. I believe that after gold fell, many people are trying their best to short gold, and it is not even ruled out that many people are chasing short gold below 2300. In fact, in my opinion, I personally do not recommend continuing to chase short gold. On the contrary, we should consider gradually going long gold below 2300.
Although gold is extremely weak after its sharp decline, it may even fall further. However, gold did not break through the 2290 area support. This situation is consistent with the situation on April 23. Therefore, gold may once again replicate the trend of April 23, start to stop falling and rebound using the 2290 area as support, and may build a new upward channel in the short term (the trend is as shown in the figure).
Therefore, in short-term trading, I will gradually go long gold below 2300 in batches.I share detailed trading strategies and trading signals every day. You can follow the channel at the bottom of the article to get detailed trading signals and learn trading logic. People who are already in it have already made a lot of money. Let us enjoy the journey of making money together. !

Profited $11K, continue to be long goldToday we made a nice profit on both long and short gold trades. First, we shorted gold near 2337 and 2342, and gold hit TP during the fall: 2330; after gold fell back, we went long gold below 2330, and gold hit TP again during the second bottoming process: 2340,We took profit by hitting TP on both trades, resulting in a profit of over $11K. Today's results are very good for the first trading day of the week.
Gold fluctuated and rebounded today after testing below 2320. We can see from the recent gold trend that although the gold trend is relatively weak, gold has repeatedly rebounded after testing support, and multiple long lower shadow lines have appeared below, proving that the buying support below is strong. As for the short-term structure of gold, gold has successfully built a double-bottom structure during its bottom-out and recovery process, which is conducive to gold's continued rebound. As the recent lows continue to move upward, gold has formed a perfect upward channel in the short-term structure, and gold is expected to continue its rebound.
The current short-term resistance of gold is in the 2350-2355 area. If gold breaks through this area, gold's short advantage will be gone, and gold will try to hit the upward channel pressure area of 2360-2365.If gold continues its rebound and breaks through this area, gold will have the opportunity to try to touch above 2390 again, or even 2400.
Therefore, in the next short-term trading, we will change our trading strategy as the market trend changes. In short-term trading, we will mainly go long gold on the fallback.Only when gold touches the 2355, 2365 position area for the first time, we may have the opportunity to strive for gold correction profits.
I share detailed trading strategies and trading signals every day. You can follow the channel at the bottom of the article to get detailed trading signals and learn trading logic. People who are already in it have already made a lot of money. Let us enjoy the journey of making money together. !

Mainly go long gold in the 2320 support areaToday, gold fluctuated and recovered after testing near the 2319 position. It hit near the 2344 position and then stagnated again. Gold is currently trading near the 2335 position. At present, we can see that gold as a whole is weakly fluctuating in the 2345-2315 area. What I have given you today is the gold short trading strategy and signals, short gold in the 2336-2340 area and 2340-2345 area respectively. At present, our gold short position has made a good profit.
According to the strength of the current market, it is difficult for both gold bulls and bears to continue, so it is difficult for gold to form a unilateral market in a short period of time. However, gold has been supported in the 2320-2315 area many times, indicating that the buying support below is strong.Then if gold has sufficient buying power, it still has room to try to hit the 2355-2360 area. Once gold breaks through this area, gold's short advantage will disappear, and it may even try to test the 2390-2400 area again.
In the current market trading, if gold does not make a strong breakthrough, then gold can still be regarded as oscillating in the 2345-2315 area as a whole. Then our trading rhythm is very simple, and we carry out high-sell and low-slag operations in this area. In addition, what needs to be noted in trading is that if you have profits, you must harvest them in time. Don't always covet the profits at the lowest point and the highest point. We will be satisfied if we can get most of the profits in the middle.
I share detailed trading strategies and trading signals every day. You can follow the channel at the bottom of the article to get detailed trading signals and learn trading logic. People who are already in it have already made a lot of money. Let us enjoy the journey of making money together. !

Profited $63K this week, will continue to short goldFirst, let’s summarize this week’s trading situation. There were a total of 22 transactions in this week’s trading day, of which 3 transactions suffered losses, with a total loss of about $3.4K. Almost all of the other 19 transactions were made by hitting TP and making a profit. It is about FWB:67K , so the net profit this week is $63K, and the trading winning rate this week is as high as over 86%. It is a very good trading result. I will start a new trading journey tomorrow.I hope we can achieve better trading results in the new week!
How do you view the next gold market? Judging from the recent trend of gold, gold's unilateral rise has continued to reach new highs and was blocked near 2430. After geopolitical tensions eased, market risk aversion dissipated, and gold bears counterattacked, falling as low as around 2290 to find support. However, the decline has not been well extended and has not been able to effectively fall below the 2300 mark, indicating that there is still a large amount of buying support below. Then it began to rebound in shock, and on Friday it rebounded and hit the high of 2354 for testing.
Although the current correction of gold is limited, the lows have begun to move upward slowly, and the short-term upward channel remains intact.But I think that 2430 is a clear peak, and the 2400 mark has been failed to be successfully crossed after multiple shocks.Now that the high level is gathering momentum, the price has fallen back, and the decline is still expected to continue. However, due to the large amount of buying support from the bulls, a complete decline needs to digest the bulls’ momentum before it can proceed further. Next, we need to focus on the 2355-2360 area.If gold fails to effectively break through this area multiple times, gold will continue to fall back.
In trading, the current market fluctuations are actually not small, which is beneficial for short-term trading. However, what needs to be noted in trading is that if you have profits, you must harvest them in time. Don't always covet the profits at the lowest point and the highest point. It is already very good to get most of the profits in the middle.
I share detailed trading strategies and trading signals every day. You can follow the channel at the bottom of the article to get detailed trading signals and learn trading logic. People who are already in it have already made a lot of money. Let us enjoy the journey of making money together. !

Boldly short gold in the 2345-2350 areaGold rebounded to above 2340 in the short term, which looks very strong. However, from the perspective of the entire rebound process, although gold has continued to consolidate the bottom during the rising shock, it has provided solid support for gold's rise. However, judging from the overall rebound strength, gold is currently not enough to form a reversal trend. It should only be seen as a repair to this round of decline. So overall, gold's rebound is not strong, so there are still good short-selling opportunities in trading.
The current short-term resistance of gold is the 2350 area. Technical pressure is all concentrated in the 2350-2355 area, and this area is exactly 50% of the downward trend from 2417 to 2291, so the 2350 area is a relatively strong resistance area. . Therefore, in trading, we can first boldly short gold in the area near 2345, and then add short gold in the area near 2350. Then just wait for gold to fall and profit!
I share detailed trading strategies and trading signals every day. You can follow the channel at the bottom of the article to get detailed trading signals and learn trading logic. People who are already in it have already made a lot of money. Let us enjoy the journey of making money together. !

GOLD - Trade PlanGold has been very bullish for the last two days but it went bearish from the last hours of market closing now we have two plans to trade with gold one is the sell plan and the other is the buy plan which will executed as it touches support or resistance

Gold made huge profits from short selling last week, next week?
We basically focused on shorting gold last week. The rebound is to give short selling opportunities. Although gold rebounded during the process, it eventually shot up and fell back. When gold shot up and fell back at a high level, it was a bull market. The gold 1-hour moving average is about to enter. If gold rebounds near 2165 next week, it will be the moving average resistance, and the trend line will suppress near 2167. If gold rebounds near 2165 next week, we can continue to short. Judging from last week's closing price, there are signs of further adjustments at the beginning of the Golden Week. Friends who have not entered the market can just prepare for it.
It is often more reasonable to follow a good trading signal than to trade randomly on your own.Hope it helps you.

SELLS ON XAUUSD (GOLD)Price broke out of my counter trend line around 2037. Trying to respect a major trend line around 2047. Nothing strange haha...just anticipating a retest to where the breakout occurred.
Manage risk!!!
EIGHTCAP:XAUUSD

GOLD SELL MORE HERE TREND BROKEN !!!HELLO TRADERS
As i can see Gold drop on yesterday interest rates results and Powell speech make a pullback in $ and now if we see the uptrend has just broken and now we can sell here more on positive Jobless Claims, ISM Manf PMI and tomorrow NFP so our risk reward ratio is great on this trade we already selling from 2055 Zone let's see what markets brings it's just an trade idea do a proper analysis before any tare we apricate Ur comments and love Stay Tuned for more updates

Possible gold short opportunity at level 2060 USD as previsous TOP , We notice some weak of bulls as we can see the divergence on CCI mixed with Pin Bare on Weekly timeframe
we expected a possible breaking uptrendline for the next three ou fours weeks.
TP and SL are clearly showing

GOLD SELLHello, according to my analysis of the gold market, there are good opportunities for selling. The price has reached a very important stage. The price reached a strong resistance at 1945.60. There is a downward trend as shown in the analysis. A very negative candlestick was formed on the 4-hour chart. We also notice a strong correction on the Fibonacci Golden Ratio of 61%. All these factors confirm that the market is for sale. good luck for everbody

Xauusd - 15Min Analysis Counter trend trade :
Slight correction expected after a beautiful drop in Gold yesterday,
Possible to hit the previous lowest low on the daily or 4Hr timeframe (marked with a simple line for possible rejection) or price could easily break the current lower low (might occur just before 14:30 sast - news - normally 30 min before news)
This is Biased in my belief that a small correction occurs after a big drop or rally
This correctional move setup is for a temporary buy - very risky - hoping to make some cents, awaiting my next trend trade sell setup around the same area expected to reject price (previous daily lowest low or the previous 15 min OB before the drop - there’s two I see so the closest to current price.
NB!: this is a down trend and this is simply a test of theory that I’m taking - simply trade with the trend and note this is not advice.

Continue to short gold and keep making moneyYesterday and today I have made it very clear to everyone about gold trading ideas. We mainly focus on shorting gold at high levels. Today we are short gold in the 1925-1927 area and near 1923, and have successfully reached my expected profit target. Obviously, we got another good profit today.
Regarding the current structural trend of gold, the short energy of gold has the upper hand. In the short term, gold maintains a volatile downward trend, while local rebounds show weakness. Therefore, next we focus on the short-term resistance above. If gold cannot effectively break through the short-term resistance, that is a good time for us to short gold. In the short term, focus on the 1922 and 1928-1930 area resistance. If there is an opportunity, you can short gold appropriately around this area.
In fact, as long as you grasp the rhythm, it is easy to profit from gold trading. If you don't know the accurate trading rhythm, you can follow my trading ideas. I post my trading ideas every day and I also post free trading signals on a regular basis. Many friends have given feedback that it is very helpful. If you want to learn market trading logic, or you want clear trading signals and get more profits, I can satisfy you. Be sure to follow the bottom of the article to view the details!

XAUUSD:25/9 Today’s Trading StrategyGold stabilized at the 1920 mark last Friday and ushered in a shock rebound and recovery. The Asian and European markets fluctuated sideways above 1925, showing a defensive trend. In the evening, the US market accelerated slightly and reached the 1929 line, falling back and closing with shock. From the perspective of technical analysis, gold Judging from the above, the current trading daily level structure shows that after the market rebounded higher in the first half of the week last week, there was a dive on Wednesday night, breaking the illusion of the bulls. A big negative line on Thursday reversed the rebound. Although the rebound closed on Friday, it was just a retaliatory rebound for the previous consecutive declines and did not affect the downward trend. Therefore, the bottom is expected to continue this week. In the short-term bull counterattack last Friday, the market broke through the 1924 suppression level, but under the heavy pressure of 1930, the rebound was curbed. The golden four-hour line continues to remain above the 50 moving average. The fall of the K-line is a normal trend. The more the fall, the higher the rebound. This is inevitable. At the same time, the bottom continues to maintain a big positive line to stop the decline, and strongly supports the K-line, 50 The moving averages continue to show signs of rising upward. Although the lows are also constantly rising, the stochastic indicator is currently trending toward a dead cross, running bearish and downward, and the BOLL central axis is temporarily suppressed. Therefore, in the short term within the day, there may be a shock retracement first and then Downward trend. Therefore, in the short term during the day, Jiesse still recommends short selling at high prices to operate!
Gold operating strategy:
SELL:1927-1930
SL1935
TP1:1923
TP2:1918

Gold little flutuated ahead of Fed and other rate decisionsThe gold market is currently in a holding pattern as investors await monetary policy updates from the Federal Reserve and other central banks this week. Gold prices are relatively stable, with the most active futures contract settling just slightly higher and spot gold showing a small decline.
Market analysts suggest that gold traders are cautious and waiting for these central bank decisions, including the Fed, Bank of England, Bank of Japan, and People's Bank of China. The focus is on the Fed's decision, and any signals regarding interest rate hikes could impact gold's direction. If there's optimism that central banks are done raising rates, it could be positive for gold, but uncertainties remain.
The European Central Bank recently raised rates to 4%, signaling it might be the last hike for a while. The Fed is not expected to raise rates during its upcoming meeting, but investors are eager to hear Chairman Jerome Powell's comments for clues about the rest of the year. The possibility of a hard economic landing could drive safe-haven flows into gold.
In summary, gold markets are on hold as traders await central bank decisions, with a focus on the Fed's announcement and Powell's remarks. The recent increase in U.S. consumer prices adds complexity to the inflation outlook.


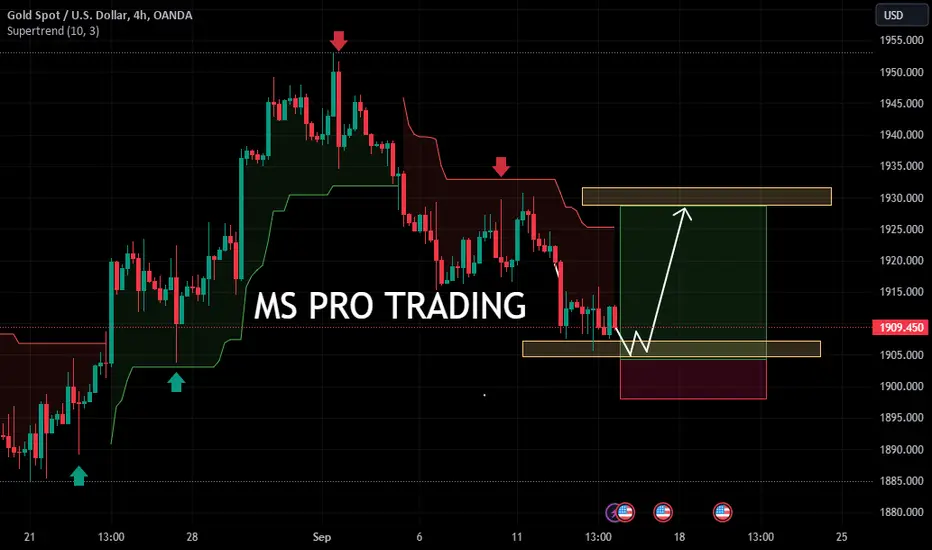
Gold Buyer's Bias?On Friday Gold price test its 11th sep high 1930 and drop to 1923.
Current setup:
Price drop to fvg fair value gap 1922 and also 50% fib level close bullish in 15 min chart which shows that this short retracement from 1930 to 1922 and now price goes to new high for the coming week.
BUY SETUP:
On the monday open go for long after breakout of gray zone which i mentioned in the charts/ stop loss below 61 level of fib level.
On Wednesday important news event fed speech and fed rates.

What do you say today, Gold Movements,Buy or Sell?Dear traders, Today again, gold is running at $1914.00 and $1908.00 prices, with gold moving up and down but in the same price range. We have strong reasons to buy gold, but first we need confirmation.
If you like our analysis, then you can boost our posts. You can leave a comment in the comment section.
Good luck and best wishes to everyone.