GOLD 1H CHART ROUTE MAP UPDATE & TRADING PLAN FOR THE WEEKHey Everyone,
Please see our updated 1h chart levels and targets for the coming week.
We are seeing price play between two weighted levels with a gap above at 3340 and a gap below at 3418. We will need to see ema5 cross and lock on either weighted level to determine the next range.
We will see levels tested side by side until one of the weighted levels break and lock to confirm direction for the next range.
We will keep the above in mind when taking buys from dips. Our updated levels and weighted levels will allow us to track the movement down and then catch bounces up.
We will continue to buy dips using our support levels taking 20 to 40 pips. As stated before each of our level structures give 20 to 40 pip bounces, which is enough for a nice entry and exit. If you back test the levels we shared every week for the past 24 months, you can see how effectively they were used to trade with or against short/mid term swings and trends.
The swing range give bigger bounces then our weighted levels that's the difference between weighted levels and swing ranges.
BULLISH TARGET
3340
EMA5 CROSS AND LOCK ABOVE 3340 WILL OPEN THE FOLLOWING BULLISH TARGETS
3463
EMA5 CROSS AND LOCK ABOVE 3463 WILL OPEN THE FOLLOWING BULLISH TARGET
3483
EMA5 CROSS AND LOCK ABOVE 3483 WILL OPEN THE FOLLOWING BULLISH TARGET
3508
BEARISH TARGETS
3418
EMA5 CROSS AND LOCK BELOW 3418 WILL OPEN THE FOLLOWING BEARISH TARGET
3393
EMA5 CROSS AND LOCK BELOW 3393 WILL OPEN THE SWING RANGE
3372
3353
EMA5 CROSS AND LOCK BELOW 3393 WILL OPEN THE SECONDARY SWING RANGE
3330
3306
As always, we will keep you all updated with regular updates throughout the week and how we manage the active ideas and setups. Thank you all for your likes, comments and follows, we really appreciate it!
Mr Gold
GoldViewFX
Goldtrading

GOLD 4H CHART ROUTE MAP UPDATE & TRADING PLAN FOR THE WEEKHey Everyone,
This is an update from last weeks 4H chart route map, as levels are still valid and playing out as analysed. I have only updated the swing ranges accordingly.
3376 and 3438 was hit perfectly last week with ema5 cross and lock confirmation. We are now looking for ema5 cross and lock above 3438 for a continuation into 3498. Failure to lock above will follow with a rejection into the lower Goldturns for support and bounce inline with our plans to buy dips.
We will see levels tested side by side until one of the weighted levels break and lock to confirm direction for the next range.
We will keep the above in mind when taking buys from dips. Our updated levels and weighted levels will allow us to track the movement down and then catch bounces up.
We will continue to buy dips using our support levels taking 20 to 40 pips. As stated before each of our level structures give 20 to 40 pip bounces, which is enough for a nice entry and exit. If you back test the levels we shared every week for the past 24 months, you can see how effectively they were used to trade with or against short/mid term swings and trends.
The swing range give bigger bounces then our weighted levels that's the difference between weighted levels and swing ranges.
BULLISH TARGET
3376 - DONE
EMA5 CROSS AND LOCK ABOVE 3376 WILL OPEN THE FOLLOWING BULLISH TARGETS
3438 - DONE
EMA5 CROSS AND LOCK ABOVE 3438 WILL OPEN THE FOLLOWING BULLISH TARGET
3498
EMA5 CROSS AND LOCK ABOVE 3498 WILL OPEN THE FOLLOWING BULLISH TARGET
3551
BEARISH TARGETS
3302
EMA5 CROSS AND LOCK BELOW 3302 WILL OPEN THE FOLLOWING BEARISH TARGET
3235
EMA5 CROSS AND LOCK BELOW 3235 WILL OPEN THE SWING RANGE
3171
3113
EMA5 CROSS AND LOCK BELOW 3113 WILL OPEN THE SECONDARY SWING RANGE
3045
2987
As always, we will keep you all updated with regular updates throughout the week and how we manage the active ideas and setups. Thank you all for your likes, comments and follows, we really appreciate it!
Mr Gold
GoldViewFX

GOLD DAILY CHART ROUTE MAPHey Everyone,
Following up on our previous analysis, price action has continued to respect our Goldturn channel beautifully. After the strong move to 3272, we saw another push toward the channel top near 3433. This time, the ascending movement to the channel top was completed perfectly, hitting inline with our 3433 axis target.
The key takeaway here is that the channel levels are being respected with precision, validating the strength and reliability of our Goldturn channel framework. 3272 continues to provide solid support, and price remains well-contained within our defined range, reaffirming our strategy of buying dips near the lower end rather than chasing strength at the top.
We will now look for a break above the channel and then support to form above the channel top to confirm a continuation higher. However, failure to lock above the channel will likely result in a rejection back into the range, reinforcing the significance of these key levels.
We remain focused on trading within this structure, using our weighted Goldturns to guide entries on the lower timeframes (1H and 4H). As long as the range remains intact, we’ll continue to target quick 30–40 pip intraday moves while keeping an eye out for a breakout setup.
This is the beauty of our Goldturn channels, drawn using weighted averages rather than pure price action. This method helps us filter out noise and stay on the right side of the market, avoiding common traps.
Keep a close eye on how price behaves around 3272 and 3433. A clean break and sustained hold above the channel top could shift the game, but until that happens, we stick to the range plan.
Let’s stay patient and disciplined.
Mr Gold
GoldViewFX

GOLD WEEKLY CHART MID/LONG TERM ROUTE MAPHey Everyone,
Following up on last week’s chart update, we saw another perfect test of the channel top, right in line with our Goldturn Channel expectations. The new weekly candle completed the channel top challenge with precision.
Our weekly chart idea is now playing out perfectly. We continued to get strong support above 3281, followed by another hit onto the 3387 channel top. But this time, we got something new: a body close above 3387, which confirms the gap to 3482 as active. We’ll now look for that 3482 target to be hit, ascending inline with the channel top.
Any rejection around these upper levels will likely see price retrace to find support at lower Goldturn levels. These are opportunities we’ll be watching closely to buy back in.
Price action remains well-contained between 3281 and 3387, but with that recent close above 3387, we’re now shifting focus toward higher expansion. The structure is rising, and the channel is guiding price beautifully, offering more room for smart, calculated positioning.
As long as we hold above the half-line and especially above 3281, we stay in buy-the-dip mode, favouring long setups from intraday Goldturn zones for quick 20–40 pip scalps or more extended swing entries when structure permits.
Should we see a failure to maintain above 3387 or a close back below 3281, we’ll reassess potential movement toward the lower channel boundary. Until then, the structure remains bullish within the channel and price is following our path perfectly.
The Goldturn methodology continues to prove its worth, cutting through noise, filtering out the fake outs, and keeping us on the right side of the market.
Stay sharp, stay patient.
MR GOLD
GOLDVIEWFX

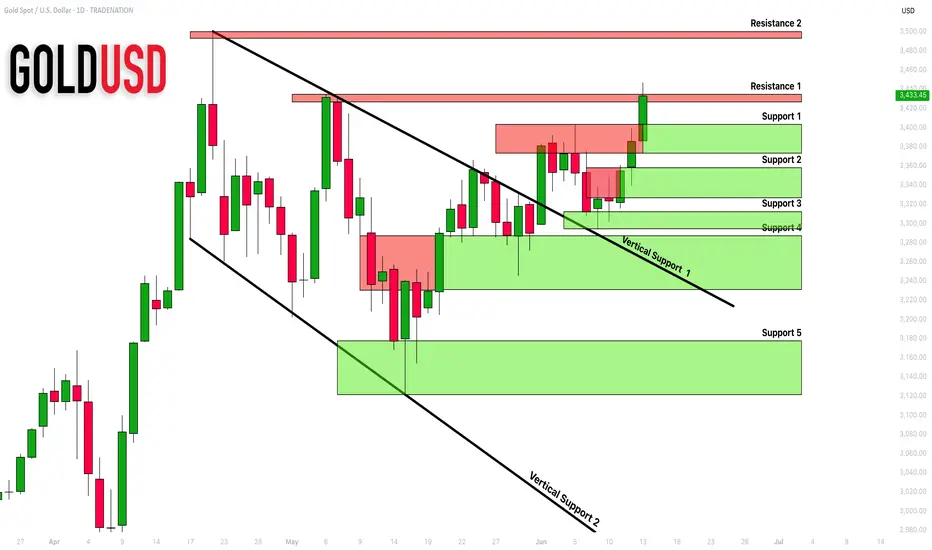
GOLD (XAUUSD): Support & Resistance Analysis For Next Week
Here is my latest structure analysis and
important supports & resistances for GOLD XAUUSD
for next week.
Consider these structures for pullback/breakout trading.
❤️Please, support my work with like, thank you!❤️
I am part of Trade Nation's Influencer program and receive a monthly fee for using their TradingView charts in my analysis.
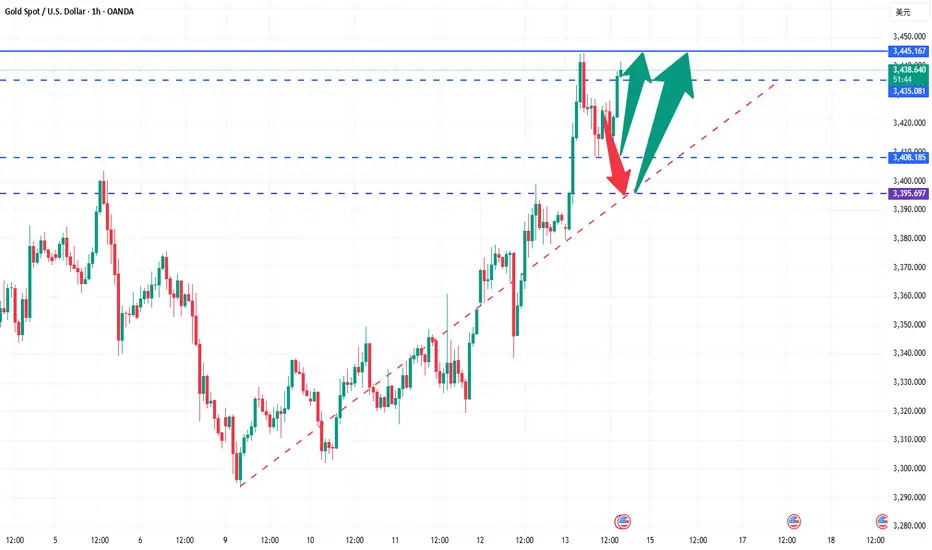
Bulls are in control, and pullbacks are opportunities!Gold rose directly at the opening today due to risk aversion, reaching a high of around 3446.8. We successfully stopped profit twice when we went long. Subsequently, we also notified everyone to enter short positions at 3445 and exit with profit at 3425. Pay attention to the support situation at 3395-3408. Going long on pullbacks is still the main trend at present.
From the current gold trend analysis, today's gold mid-line pulled up and broke through and stood above the 3400 mark to further continue its strength. The short-term support below is around 3310-3408, and the key support below is around the recent top and bottom conversion position of 3395-3405. The intraday pullback relies on this position to continue to be bullish and the short-term bullish dividing line moves up to 3345-3350. The daily level stabilizes above this position and continues to maintain the trend of low-long rhythm. Be cautious about short orders against the trend. I will give you tips on specific operations, and pay attention in time.
Gold operation strategy: Buy gold when it falls back to around 3395-3405, and target around 3425-3440. If it is strong, continue to buy gold at the support of 3410-3408.
When operating, be sure to strictly set stop loss, strictly control risks, and respond to market fluctuations steadily.

GOLD ROUTE MAP UPDATEHey Everyone,
Great finish after completing each of our targets throughout the week with ema5 lock confirmations on our proprietary Goldturn levels. Yesterday we finished off with 3388 and stated we would look for ema5 cross and lock above 3388 to open 3428 and failure to lock will follow with a rejection.
- This played out perfectly with the cross and lock confirmation and then the target hit at 3428 completing the range.
BULLISH TARGET
3318 - DONE
EMA5 CROSS AND LOCK ABOVE 3318 WILL OPEN THE FOLLOWING BULLISH TARGETS
3352 - DONE
EMA5 CROSS AND LOCK ABOVE 3352 WILL OPEN THE FOLLOWING BULLISH TARGET
3388 - DONE
EMA5 CROSS AND LOCK ABOVE 3388 WILL OPEN THE FOLLOWING BULLISH TARGET
3428 - DONE
We’ll be back now on Sunday with our multi-timeframe analysis and trading plans for the week ahead. Thanks again for all your likes, comments, and follows.
Wishing you all a fantastic weekend!!
Mr Gold
GoldViewFX

Hit the target with one strike! Gold perfectly cashed in 3435Gold closed sideways at a high level yesterday, and closed positive again overnight. It opened back to 3379 and pulled up strongly, breaking through the 3400 mark and then increasing in volume. The recent low-multiple bullish ideas have been realized. There is no doubt that it will continue to be bullish and long today. The market has turned from the previous sweeping upward to a strong unilateral trend. The upper side will first look at the previous high pressure of 3435. Continued breakthrough will further open up the upper space, or it will hit 3500 or even a new high again. The lower support focuses on the top and bottom conversion position of 3395-3405, and then pay attention to the 1H cycle support near 3410. The intraday operation is mainly long on the decline.
Operation suggestion: Go long on gold when it falls back to 3395-3345, and look at 3434 and 3450. If it is strong, continue to go long with the support of 3415-3410.
When operating, be sure to strictly set stop loss, strictly control risks, and respond to market fluctuations steadily.
GOLD (XAUUSD): Waiting For Another Breakout
Following the latest news, I think you would agree with me that
Gold will most likely rise more.
Your technical confirmation can be a bullish breakout of the underlined
blue resistance and a daily candle close above 3435.
It will be an important trigger that will push the prices way up to a current ATH.
❤️Please, support my work with like, thank you!❤️
I am part of Trade Nation's Influencer program and receive a monthly fee for using their TradingView charts in my analysis.

The summit is just around the corner, just one final push away!Gold closed sideways at a high level yesterday, and closed positive again overnight. It opened back to 3379 and pulled up strongly, breaking through the 3400 mark and then increasing in volume. The recent low-multiple bullish ideas have been realized. Today, there is no doubt that it will continue to be bullish and long. The market has turned from the previous sweeping upward to a strong unilateral trend. The upper side will first look at the previous high pressure of 3435. Continued breakthrough will further open up the upper space, or it will hit 3500 or even a new high again. The lower support focuses on the top and bottom conversion position of 3395-3405, and then pay attention to the 1H cycle support near 3410. Intraday operations are still mainly based on falling back and long.
Operation suggestion: Go long when gold falls back to 3395-3345, and look at 3434 and 3450. If it is strong, continue to go long with the support of 3415-3410.

XAUUSD Analysis todayHello traders, this is a complete multiple timeframe analysis of this pair. We see could find significant trading opportunities as per analysis upon price action confirmation we may take this trade. Smash the like button if you find value in this analysis and drop a comment if you have any questions or let me know which pair to cover in my next analysis.

Iran tensions rise: a setup brewing for gold and oil Geopolitical tensions surrounding Iran might fuel safe-haven demand for gold.
A break above $3,403 might open the door for a test of the May high at $3,437. However, price action over the last two sessions potentially indicates that buyers are reluctant to drive spot prices above $3,400.
At the same time, analysts are suggesting that oil could climb toward $120 if Israel takes military action against Iran. “I don’t want to say it’s imminent, but it looks like something that could very well happen,” President Trump said during a White House event.
Meanwhile, cooler-than-expected US CPI and PPI prints have potentially strengthened expectations that the Federal Reserve could begin cutting interest rates by September, with a second cut possibly following before year-end.

GOLD ROUTE MAP UPDATEHey Everyone,
Another PITASTIC day on the charts, with our analysis playing out perfectly.
Yesterday after completing the target at 3352, we stated that we’ll be watching for a confirmed cross and lock above 3352 for a continuation. We got the cross and lock above 3352 opening 3388.
- 3388 was hit perfectly today completing this target. We will now look for a ema5 cross and lock above 3388 for a continuation. If price fails to lock above, we could see rejections leading back into the lower Goldturns, where we’ll look for support and bounce.
We will keep the above in mind when taking buys from dips. Our updated levels and weighted levels will allow us to track the movement down and then catch bounces up.
We will continue to buy dips using our support levels taking 20 to 40 pips. As stated before each of our level structures give 20 to 40 pip bounces, which is enough for a nice entry and exit. If you back test the levels we shared every week for the past 24 months, you can see how effectively they were used to trade with or against short/mid term swings and trends.
The swing range give bigger bounces then our weighted levels that's the difference between weighted levels and swing ranges.
BULLISH TARGET
3318 - DONE
EMA5 CROSS AND LOCK ABOVE 3318 WILL OPEN THE FOLLOWING BULLISH TARGETS
3352 - DONE
EMA5 CROSS AND LOCK ABOVE 3352 WILL OPEN THE FOLLOWING BULLISH TARGET
3388 - DONE
EMA5 CROSS AND LOCK ABOVE 3388 WILL OPEN THE FOLLOWING BULLISH TARGET
3428
EMA5 CROSS AND LOCK ABOVE 3428 WILL OPEN THE FOLLOWING BULLISH TARGET
3478
BEARISH TARGETS
3281
EMA5 CROSS AND LOCK BELOW 3281 WILL OPEN THE FOLLOWING BEARISH TARGET
3254
EMA5 CROSS AND LOCK BELOW 3254 WILL OPEN THE FOLLOWING BEARISH TARGET
3210
EMA5 CROSS AND LOCK BELOW 3210 WILL OPEN THE SWING RANGE
3179
3146
As always, we will keep you all updated with regular updates throughout the week and how we manage the active ideas and setups. Thank you all for your likes, comments and follows, we really appreciate it!
Mr Gold
GoldViewFX

Go with the flow and seize the gold trading opportunityGold rose and fell yesterday due to the influence of CPI data, and fluctuated violently during the session. There were obvious signs of a wash. In the evening, it rose again driven by the news, closed positive on the daily line, continued its strong upward trend at the opening and set a new high, showing an obvious bullish pattern. The overall structure maintains the bullish idea of low-long and trend-following.
From the 4H cycle, gold rose continuously after stepping back and stabilizing the middle track. The moving average system showed a bullish arrangement, and the Bollinger band opened and expanded, further confirming the continuation of the strong pattern. However, the current price is still running within the triangle convergence range, and has not yet effectively broken. It is not advisable to blindly chase more in the short term.
In terms of operation, it is recommended to take the step back and do more. Pay attention to the short-term support below the 3360-3358 range, and focus on the 3350-3340 range. You can rely on the support to arrange long orders in batches. Pay attention to the 3389 and 3400 areas on the upper short-term pressure. If the high is weak, you can try short-selling in combination with the actual trend.
Operation suggestion: It is recommended to buy gold near 3340-3350, and the target is 3366 and 3382. If it is strong, it is recommended to buy gold at the support of 3358-3360!
All recent trading strategies and ideas have been realized, and the point predictions are accurate. If your current gold operation is not ideal, we hope to help you avoid detours in your investment. Welcome to communicate with us!

GOLD IS MOVING UPWARD.#xauusd #gold
Hello friends, very busy this days and also no well, had little health issue. But I was watching gold closely in that days too, caught some great moves. In previous analysis I mentioned gold will move upward, unfortunately gold breaked the pattern and moved down to 3394 after that we see again upward movement started. Again a bearish flag pattern is formed but due to tension in geopolitics gold is strongly bullish also yesterday was CPI news where dollar news was negative and dollar move down due to which gold pushed upward. Today gold opening was in gap in upward.
Today I am expecting to move upward and later on it will definitely come down to fill the gap near 3355. So our main target is now 3380-3391-3402.
Comment and like for analysis. Love it then follow
Any Query Reach Us or comment down.
Follow for more updates.
Rudra Vasaikar Wishes You A Great And Very Amazing Trading Life. Trade Safe, Trade Right.
RISK WARNING 🔴 🔴 🔴
There is high risk of loss in Trading Forex, Crypto, Indices, CFDs, Features and Stocks. Choose your trade wisely and confidently, please see if such trading is appropriate for you or not. Past performance is not indicative of future results. Highly recommended - Information provided by Pro Trading Point are for Educational purpose only. Do your investment according to your own risk. Any type of loss is not our responsibility.
HAPPY TRADING.
#gold #xauusd #xauusdtrading #goldtrading #goldanalysis #forextrading #forex #trendline #goldsignals #goldnews goldlatestanalysis #xauusdtradesetup #forextradingguide #fxgold
beyong technical analysis, chart patterns, gold, goldanalysis, goldideas, goldlong, goldsignals, goldlatestanalysis, goldtrading, goldtradingview, technical indicators, xauusdanalysis,

GOLD ROUTE MAP UPDATEHey Everyone,
Another solid day on the charts, with our analysis unfolding exactly as anticipated.
As mentioned yesterday, after the cross and lock above 3318, we identified a gap at 3352 that remained unfilled, acting as a magnet for price action. Since then, price has been consolidating in a tight range between 3318 and 3352.
Today, we saw a perfect move up, completing the target at 3352. From here, we’ll be watching for a confirmed cross and lock above 3352 for a continuation. If price fails to lock above, we could see rejections leading back into the lower Goldturns, where we’ll look for support and bounce.
We will keep the above in mind when taking buys from dips. Our updated levels and weighted levels will allow us to track the movement down and then catch bounces up.
We will continue to buy dips using our support levels taking 20 to 40 pips. As stated before each of our level structures give 20 to 40 pip bounces, which is enough for a nice entry and exit. If you back test the levels we shared every week for the past 24 months, you can see how effectively they were used to trade with or against short/mid term swings and trends.
The swing range give bigger bounces then our weighted levels that's the difference between weighted levels and swing ranges.
BULLISH TARGET
3318 - DONE
EMA5 CROSS AND LOCK ABOVE 3318 WILL OPEN THE FOLLOWING BULLISH TARGETS
3352 - DONE
EMA5 CROSS AND LOCK ABOVE 3352 WILL OPEN THE FOLLOWING BULLISH TARGET
3388
EMA5 CROSS AND LOCK ABOVE 3388 WILL OPEN THE FOLLOWING BULLISH TARGET
3428
EMA5 CROSS AND LOCK ABOVE 3428 WILL OPEN THE FOLLOWING BULLISH TARGET
3478
BEARISH TARGETS
3281
EMA5 CROSS AND LOCK BELOW 3281 WILL OPEN THE FOLLOWING BEARISH TARGET
3254
EMA5 CROSS AND LOCK BELOW 3254 WILL OPEN THE FOLLOWING BEARISH TARGET
3210
EMA5 CROSS AND LOCK BELOW 3210 WILL OPEN THE SWING RANGE
3179
3146
As always, we will keep you all updated with regular updates throughout the week and how we manage the active ideas and setups. Thank you all for your likes, comments and follows, we really appreciate it!
Mr Gold
GoldViewFX

XAUUSD: Neutral trade preparing a major breakout.Gold is neutral on its 1D technical outlook (RSI = 53.070, MACD = 17.020, ADX = 34.480) a direct consequence of the sideways trading between the 4H MA50 and 4H MA200. The price action has rebounded on the former LH trendline, validating that it has resumed the long term bullish trend. The pattern that has prevailed so far is a Channel Up, and the current consolidation is similar to its first bottom sequence. We are bullish, aiming again for the 1.236 Fibonacci extension (TP = 3,420).
## If you like our free content follow our profile to get more daily ideas. ##
## Comments and likes are greatly appreciated. ##

GOLD ROUTE MAP UPDATEHey Everyone,
Quick update following on from yesterday’s post.
As expected, we got the push up after the EMA5 cross and lock above 3318, but price just fell short of our bullish target at 3352, leaving it open. This level now acts as a magnet, with price currently playing between 3318 and 3352, creating a tight range.
We're watching closely for tests on both 3318 and 3352, with direction confirmed only by EMA5 cross and lock. The gap to 3352 still remains, so any bullish momentum should aim to fill this cleanly.
Until one of these levels breaks with confirmation, we’ll likely continue seeing choppy movement in this range. We’ll keep using dips into support for intraday buys, targeting our usual 20–40 pip bounce trades as structure allows.
Once again, thank you all for your ongoing support and engagement, we’ll continue to keep you updated throughout the week, as price unfolds and setups confirm.
Mr Gold
GoldViewFX

XAUUSD Analysis todayHello traders, this is a complete multiple timeframe analysis of this pair. We see could find significant trading opportunities as per analysis upon price action confirmation we may take this trade. Smash the like button if you find value in this analysis and drop a comment if you have any questions or let me know which pair to cover in my next analysis.

GOLD ROUTE MAP UPDATEHey Everyone,
Great start tot he week with our chart idea playing out, as analysed.
We started today with our bullish target at 3318 hit, followed with ema5 cross and lock opening 3352. Rejection here will see lower open Goldturns tested for support and bounce and further cross and locks will confirm a continuation.
We will see levels tested side by side until one of the weighted levels break and lock to confirm direction for the next range.
We will keep the above in mind when taking buys from dips. Our updated levels and weighted levels will allow us to track the movement down and then catch bounces up.
We will continue to buy dips using our support levels taking 20 to 40 pips. As stated before each of our level structures give 20 to 40 pip bounces, which is enough for a nice entry and exit. If you back test the levels we shared every week for the past 24 months, you can see how effectively they were used to trade with or against short/mid term swings and trends.
The swing range give bigger bounces then our weighted levels that's the difference between weighted levels and swing ranges.
BULLISH TARGET
3318 - DONE
EMA5 CROSS AND LOCK ABOVE 3318 WILL OPEN THE FOLLOWING BULLISH TARGETS
3352
EMA5 CROSS AND LOCK ABOVE 3352 WILL OPEN THE FOLLOWING BULLISH TARGET
3388
EMA5 CROSS AND LOCK ABOVE 3388 WILL OPEN THE FOLLOWING BULLISH TARGET
3428
EMA5 CROSS AND LOCK ABOVE 3428 WILL OPEN THE FOLLOWING BULLISH TARGET
3478
BEARISH TARGETS
3281
EMA5 CROSS AND LOCK BELOW 3281 WILL OPEN THE FOLLOWING BEARISH TARGET
3254
EMA5 CROSS AND LOCK BELOW 3254 WILL OPEN THE FOLLOWING BEARISH TARGET
3210
EMA5 CROSS AND LOCK BELOW 3210 WILL OPEN THE SWING RANGE
3179
3146
As always, we will keep you all updated with regular updates throughout the week and how we manage the active ideas and setups. Thank you all for your likes, comments and follows, we really appreciate it!
Mr Gold
GoldViewFX

Everybody loves Gold Part 3Gold strategy proving functional and reliable thus far.
Everybody loves Gold Part 3 takes a heavy bias towards the down side; all be it following the predicted price as highlighted.
As always price action determines trades.

GOLD 1H CHART ROUTE MAP UPDATE & TRADING PLAN FOR THE WEEKHey Everyone,
Please see our updated 1h chart levels and targets for the coming week.
We are seeing price play between two weighted levels with a gap above at 3318 and a gap below at 3281. We will need to see ema5 cross and lock on either weighted level to determine the next range.
We will see levels tested side by side until one of the weighted levels break and lock to confirm direction for the next range.
We will keep the above in mind when taking buys from dips. Our updated levels and weighted levels will allow us to track the movement down and then catch bounces up.
We will continue to buy dips using our support levels taking 20 to 40 pips. As stated before each of our level structures give 20 to 40 pip bounces, which is enough for a nice entry and exit. If you back test the levels we shared every week for the past 24 months, you can see how effectively they were used to trade with or against short/mid term swings and trends.
The swing range give bigger bounces then our weighted levels that's the difference between weighted levels and swing ranges.
BULLISH TARGET
3318
EMA5 CROSS AND LOCK ABOVE 3318 WILL OPEN THE FOLLOWING BULLISH TARGETS
3352
EMA5 CROSS AND LOCK ABOVE 3352 WILL OPEN THE FOLLOWING BULLISH TARGET
3388
EMA5 CROSS AND LOCK ABOVE 3388 WILL OPEN THE FOLLOWING BULLISH TARGET
3428
EMA5 CROSS AND LOCK ABOVE 3428 WILL OPEN THE FOLLOWING BULLISH TARGET
3478
BEARISH TARGETS
3281
EMA5 CROSS AND LOCK BELOW 3281 WILL OPEN THE FOLLOWING BEARISH TARGET
3254
EMA5 CROSS AND LOCK BELOW 3254 WILL OPEN THE FOLLOWING BEARISH TARGET
3210
EMA5 CROSS AND LOCK BELOW 3210 WILL OPEN THE SWING RANGE
3179
3146
As always, we will keep you all updated with regular updates throughout the week and how we manage the active ideas and setups. Thank you all for your likes, comments and follows, we really appreciate it!
Mr Gold
GoldViewFX

GOLD 4H CHART ROUTE MAP UPDATE & TRADING PLAN FOR THE WEEKHey Everyone,
Please see our updated 4h chart levels and targets for the coming week.
We are seeing price play between two weighted levels with a gap above at 3376 and a gap below at 3302. We will need to see ema5 cross and lock on either weighted level to determine the next range.
We will see levels tested side by side until one of the weighted levels break and lock to confirm direction for the next range.
We will keep the above in mind when taking buys from dips. Our updated levels and weighted levels will allow us to track the movement down and then catch bounces up.
We will continue to buy dips using our support levels taking 20 to 40 pips. As stated before each of our level structures give 20 to 40 pip bounces, which is enough for a nice entry and exit. If you back test the levels we shared every week for the past 24 months, you can see how effectively they were used to trade with or against short/mid term swings and trends.
The swing range give bigger bounces then our weighted levels that's the difference between weighted levels and swing ranges.
BULLISH TARGET
3376
EMA5 CROSS AND LOCK ABOVE 3376 WILL OPEN THE FOLLOWING BULLISH TARGETS
3438
EMA5 CROSS AND LOCK ABOVE 3438 WILL OPEN THE FOLLOWING BULLISH TARGET
3498
EMA5 CROSS AND LOCK ABOVE 3498 WILL OPEN THE FOLLOWING BULLISH TARGET
3551
BEARISH TARGETS
3302
EMA5 CROSS AND LOCK BELOW 3302 WILL OPEN THE FOLLOWING BEARISH TARGET
3235
EMA5 CROSS AND LOCK BELOW 3235 WILL OPEN THE SWING RANGE
3171
3113
EMA5 CROSS AND LOCK BELOW 3113 WILL OPEN THE SECONDARY SWING RANGE
3045
2987
As always, we will keep you all updated with regular updates throughout the week and how we manage the active ideas and setups. Thank you all for your likes, comments and follows, we really appreciate it!
Mr Gold
GoldViewFX
