GOLD WEEKLY CHART MID/LONG TERM ROUTE MAPHey Everyone,
Following up on last week’s chart update, we saw another perfect test of the channel top, right in line with our Goldturn Channel expectations. The new weekly candle completed the channel top challenge with precision, once again confirming the strength of our resistance levels.
As anticipated, the rejection came in cleanly, followed by a correction into EMA5 detachment, which halted just short of the 3281 level, a crucial axis we've been tracking for multiple weeks. This level continues to act as firm support, holding price within an evolving range.
We’re now seeing price action contained between 3281 and 3387, with potential for expansion higher as the ascending channel continues to rise. This expanding structure offers more room for strategic positioning, especially as price coils tighter within the upper band.
The 3387 gap remains active and is an obvious magnet if momentum builds. As long as we stay above the half line and especially above 3281, we remain in buy the dip mode, favouring long setups off our intraday Goldturns for quick 20 40 pip scalps or swing entries when conditions align.
Should we see a deeper pullback or close below 3281, we’ll reassess potential movement toward the lower channel boundary. Until then, the structure remains bullish within the channel.
The Goldturn methodology continues to prove its worth, cutting through noise and keeping us aligned with the real structure of the market.
Stay sharp, stay patient.
MR GOLD
GOLDVIEWFX
Goldtrading

Gold Analysis with Signals
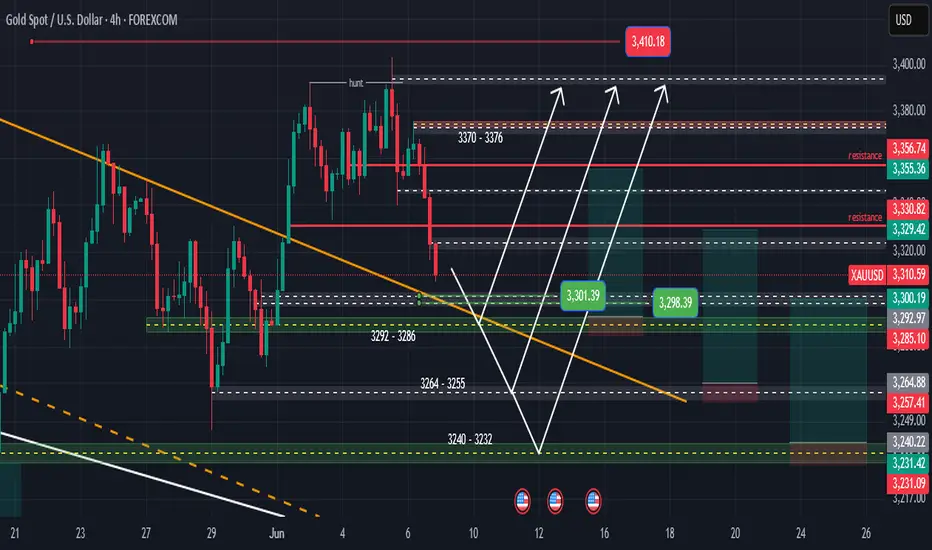
For the beginning of the market, we expect the price correction to continue to the specified support levels (buy signals), which will be completed until the downward channel is broken, and after collecting liquidity, we will continue to see the price rise. The 4-hour minor ceiling still has buyers' liquidity that has not been settled.
GOLD (XAUUSD): Important Supports & Resistances for Next Week
Here is my latest structure analysis for Gold.
Vertical Structures
Vertical Support 1: Falling trend line
Vertical Support 2: Falling trend line
Horizontal Structures
Horizontal Support 1: 3231 - 3286 area
Horizontal Support 2: 3121 - 3177 area
Horizontal Resistance 1: 3372 - 3404 area
Horizontal Resistance 2: 3427 - 3423 area
Horizontal Resistance 3: 3492 - 3500 area
Consider these structures for pullback/breakout trading.
❤️Please, support my work with like, thank you!❤️
I am part of Trade Nation's Influencer program and receive a monthly fee for using their TradingView charts in my analysis.

GOLD ROUTE MAP UPDATEHey Everyone,
A great finish to the week with our 1H chart idea finishing off with the rejection from 3389 with no further cross and lock above that level confirming the rejection. We continued to see a drop into the lower Goldturns with each level giving 20 to 40 pip bounces.,
We are now seeing 3334 Goldturn being tested. Lets see if we get the 20 to 40 pip reactional bounce before close of play.
We’ll be back now on Sunday with our multi-timeframe analysis and trading plans for the week ahead. Thanks again for all your likes, comments, and follows.
Wishing you all a fantastic weekend!!
MR GOLD

Today’s gold strategy: go long on support and short on pressure!Today, there is a high probability that the volatile bullish trend will continue. In terms of operation, we should seize the opportunity of short-term bullish. The key support level of the daily line is around 3350-3355. If it falls back to this level, you can arrange short-term bullish with a light position. If the market is strong and there is no obvious correction, you can enter the long position in advance at the 3370 line. Pay attention to the upper resistance level of 3400-3405. Once it breaks through effectively, wait for the opportunity to arrange short positions after the surge. In the volatile market, both long and short positions have opportunities. Don't chase the rise and sell the fall. Be sure to wait patiently for the right time to enter the market and strictly control the position.
Gold operation suggestions: short gold rebounds around 3400-3405. Go long gold when it falls back to around 3350-3360. Go long at 3370 first if it is strong and does not pull back.

GOLD 1H CHART ROUTE MAP UPDATEHey Everyone,
As anticipated, the market structure continues to respect our key levels and EMA5 dynamics to the letter.
After the clean bounce from 3334 into 3359, price did indeed push back toward 3389 for the retest, just as outlined. Once again ema5 failed to cross and lock above 3389, confirming rejection again. It’s important to highlight that price did retest 3389 exactly as projected, completing the range once again.
Crucially, no further EMA5 cross and lock above 3389 was seen, reconfirming the rejection and driving price back into the lower Goldturns, which we will now look for support and bounce off these levels.
The structure continues to unfold with precision, showing once again how effective our level based framework is when paired with EMA5 confirmations. This setup keeps us well aligned with market momentum.
As always, we remain focused and continue to buy dips using our support levels, capturing those 20 to 40 pip opportunities. As we’ve proven time and again, each level gives enough of a bounce for a quality entry and exit.
We encourage everyone to backtest our levels, we’ve shared them weekly for the past 3 years , and the data speaks for itself. These levels continue to work brilliantly with both short/mid term trends and countertrends.
BULLISH TARGET 3305 – ✅ DONE
EMA5 CROSS AND LOCK ABOVE 3305 WILL OPEN THE FOLLOWING BULLISH TARGETS
3334 – ✅ DONE
3359 – ✅ DONE
3389 – ✅ DONE (retested as forecasted)
EMA5 CROSS AND LOCK ABOVE 3389 WILL OPEN THE FOLLOWING BULLISH TARGET
3428
EMA5 CROSS AND LOCK ABOVE 3428 WILL OPEN THE FOLLOWING BULLISH TARGET
3478
BEARISH TARGETS 3271
EMA5 CROSS AND LOCK BELOW 3271 WILL OPEN THE FOLLOWING BEARISH TARGET
3227
EMA5 CROSS AND LOCK BELOW 3227 WILL OPEN THE SWING RANGE
3185
3146
Stay sharp, manage risk, and trust the levels. We’ll continue providing updates as the structure develops further.
Thank you again for all your likes, comments, and continued support.
Mr Gold
GoldViewFX

GOLD (XAUUSD): Strong Bullish Pattern
Following my previous analysis, Gold in going up.
Your next signal to buy will be a bullish breakout
of a neckline of an ascending triangle pattern on a 4H time frame.
A 4H candle close above 3392 will confirm a violation.
Next resistances will be 3408 / 3428
❤️Please, support my work with like, thank you!❤️
I am part of Trade Nation's Influencer program and receive a monthly fee for using their TradingView charts in my analysis.

Ascending triangle on gold: $3,280 or $3,560 next? Gold has climbed following softer-than-expected US economic data, which has strengthened speculation for at least two Federal Reserve rate cuts this year. ADP employment figures showed just 37K new jobs, well below the 111K forecast.
President Donald Trump, posting on Truth Social, called on “too slow” Fed Chair Jerome Powell to cut rates immediately.
The repeated tests of the $3,400 level suggest that selling pressure at this zone could be weakening. Lower interest rates tend to support gold prices, as the metal offers no yield. However, a daily close below the recent swing low of $3,280 would undermine the pattern.

GOLD ROUTE MAP UPDATEHey Everyone,
Another powerful day in the markets with our chart idea unfolding exactly as anticipated.
In yesterday’s update, we highlighted that all our targets 3305, 3334, and 3359 were hit following the EMA5 cross and lock confirmation. We also pointed out the EMA5 lock above 3359, opening a clear gap to 3389, which was also hit perfectly. The absence of a further EMA5 lock above confirmed a precise rejection, sending price back down into the lower Goldturns for support, just as projected. We then had the bounce off the 3334 level, another clean reaction, just like we stated.
Now today, after testing and bouncing from 3334 into 3359, price is now charging back toward 3389 for a potential retest, as that level remains open once again.
The structure is playing out beautifully, we will stick to the plan, and manage risk wisely.
We will continue to buy dips using our support levels taking 20 to 40 pips and track the movement with ema5 lock or rejection. As stated before each of our level structures give 20 to 40 pip bounces, which is enough for a nice entry and exit. If you back test the levels we shared every week for the past 24 months, you can see how effectively they were used to trade with or against short/mid term swings and trends.
The swing range give bigger bounces then our weighted levels that's the difference between weighted levels and swing ranges.
BULLISH TARGET
3305 - DONE
EMA5 CROSS AND LOCK ABOVE 3305 WILL OPEN THE FOLLOWING BULLISH TARGETS
3334 - DONE
EMA5 CROSS AND LOCK ABOVE 3334 WILL OPEN THE FOLLOWING BULLISH TARGET
3359 - DONE
EMA5 CROSS AND LOCK ABOVE 3359 WILL OPEN THE FOLLOWING BULLISH TARGET
3389 - DONE
EMA5 CROSS AND LOCK ABOVE 3389 WILL OPEN THE FOLLOWING BULLISH TARGET
3428
EMA5 CROSS AND LOCK ABOVE 3428 WILL OPEN THE FOLLOWING BULLISH TARGET
3478
BEARISH TARGETS
3271
EMA5 CROSS AND LOCK BELOW 3271 WILL OPEN THE FOLLOWING BEARISH TARGET
3227
EMA5 CROSS AND LOCK BELOW 3227 WILL OPEN THE SWING RANGE
3185
3146
As always, we will keep you all updated with regular updates throughout the week and how we manage the active ideas and setups. Thank you all for your likes, comments and follows, we really appreciate it!
Mr Gold
GoldViewFX

XAUUSD:Go long
Gold in yesterday bottom pick up, back to hit a low after pumping, and then stabilize and pull up, the daily line is a single negative back to step, corrected gold continues to be bullish, short - term back to step support to see 3355-3360
Trading Strategy:
BUY@3355-60
TP:3375-80
↓↓↓ More detailed strategies and trading will be notified here ↗↗↗
↓↓↓ Keep updated, come to "get" ↗↗↗

GOLD (XAU/USD) Analysis – Head & Shoulders & Target📌 Overview:
Today’s GOLD market presented an excellent educational setup using the MMC (Market Maker Cycle) methodology. We identified a Head & Shoulder reversal pattern, volume contraction at a key zone, a Major Break of Structure (BOS), and finally, a clear shift in market structure leading to a strong bullish move.
Let’s break it down step-by-step:
🧠 1. Head & Shoulders Pattern – The Early Reversal Signal
The pattern started forming around May 26–28, a classic Head & Shoulders that signaled potential exhaustion of the downtrend:
Left Shoulder: Price attempted to rise but failed to break previous highs.
Head: Sellers pushed to form a deeper low, forming the head.
Right Shoulder: Buyers entered again at the previous demand, creating a higher low than the head—indicating weakening bearish momentum.
🟦 The neckline was drawn across the swing highs. Once broken, it confirmed the reversal.
📍Significance: This pattern formed inside a strong SR Interchange Zone, where support turned resistance and vice versa—adding confluence.
🛠 2. Major Break of Structure (BOS) – Confirmation of Trend Shift
After forming the right shoulder, price decisively broke above the neckline and previous highs—this was the Major Break of Structure (BOS).
This is critical in MMC because:
It signals the end of the accumulation or manipulation phase.
It confirms that smart money has taken control and is pushing price in the new direction.
BOS acts as an entry trigger for traders using structure-based strategies.
💥 A strong bullish candle closed above the BOS level, showing aggressive buying.
📉 3. Volume Contraction – Smart Money Behavior
Between May 31 and June 2, we observed a tight consolidation at the previous resistance zone (now support).
Volume was contracting, forming a compression zone—a common sign of liquidity buildup by institutional players.
🧠 Why is this important?
Low volume ranges typically lead to high-volume breakouts.
This is the “accumulation before expansion” phase.
Smart money often accumulates orders here before a major move.
When price broke out of this compression, it did so with high momentum—validating this theory.
🔄 4. Structure Shifting – New Bullish Market Cycle
Following the BOS and breakout from volume contraction, price aggressively shifted its structure:
Higher highs and higher lows started forming.
Price invalidated bearish order blocks and respected bullish zones.
A new bullish market cycle under MMC began unfolding.
🚀 Price is now headed toward the Next Reversal Zone (around $3,460–$3,470), where we expect significant reaction.
🔍 5. Key Levels Explained
🔵 SR Interchange (~$3,280): This acted as a strong base for the Head & Shoulder formation. A key demand zone if price retraces.
🟦 Volume Contraction Zone (~$3,330–$3,350): Launchpad for the bullish impulse.
🟥 Next Reversal Zone (~$3,460–$3,470): A likely profit-taking or short-term reversal zone. Watch for bearish setups or consolidation here.
🎯 Strategy Insights (Based on MMC)
Entry Opportunity: After BOS + Retest of neckline or volume contraction zone.
Risk Management: Stop loss just below the previous low or reversal zone.
Target Zones: Next Reversal Zone or Fibonacci extensions depending on strategy.
📈 Conclusion
This GOLD chart is a textbook example of how technical confluences create high-probability setups:
✅ Head & Shoulder at demand
✅ Break of structure confirms reversal
✅ Volume contraction signals smart money entry
✅ Bullish expansion shows structure shift
🔔 Final Thought:
Watch closely how price reacts around the Next Reversal Zone. If bearish price action appears, it may provide a short-term reversal or retracement trade. Otherwise, a clean break above could signal the continuation of the bullish leg.

The global market is volatile!Recently, the Trump administration's intermittent trade policies have exacerbated the volatility of the US dollar. Market concerns that escalating trade frictions may trigger a US recession have weakened the dollar's appeal as a safe-haven asset. Morgan Stanley strategists pointed out that the US dollar may continue to weaken in the next 12 months, as US interest rates and economic growth expectations are gradually converging with other major economies, further undermining the confidence of US dollar bulls.
In June, the gold market fluctuated significantly. On the first trading day of June, spot gold rose nearly 3% in a single day, breaking through the high of $3,392 at one point, but fell back to around $3,350 in the Asian market the next day, a drop of about 0.48%. From a technical perspective, the 3,325 line has become a key support level - if it falls below this position, the bullish momentum may weaken; on the contrary, it is expected to resume its upward trend after stabilizing. The upper resistance is 3380-3398, and the lower short-term support is at 3325.
Gold suggestion: retrace to 3335-3340 to arrange long orders, stop loss 3325, target 3378

XAUUSD: Bouncing off a former Resistance now turned Support.Gold is marginally bullish on its 1D technical outlook (RSI = 56.013, MACD = 32.440, ADX = 32.924) as it made a much needed pullback to test the former LH trendline. This is a Resistance turned Support trendline and as the 4H MA50 holds, we expect the breakout to extend to +7.39% from the bottom. TP = 3,485.
## If you like our free content follow our profile to get more daily ideas. ##
## Comments and likes are greatly appreciated. ##

GOLD ROUTE MAP UPDATEHey Everyone,
Another powerful day in the markets with our chart idea unfolding exactly as anticipated.
In yesterday’s update, we highlighted that all our targets, 3305, 3334, and 3359 were hit following the EMA5 cross and lock confirmation. We also pointed out the EMA5 lock above 3359, now left 3389 open.
✅ Today, that 3389 level was hit to perfection.
The absence of a further EMA5 lock above confirmed a precise rejection, sending price back down into the lower Goldturns for support and bounce inline with our plans to buy dips.
We will continue to buy dips using our support levels taking 20 to 40 pips and track the movement with ema5 lock or rejection. As stated before each of our level structures give 20 to 40 pip bounces, which is enough for a nice entry and exit. If you back test the levels we shared every week for the past 24 months, you can see how effectively they were used to trade with or against short/mid term swings and trends.
The swing range give bigger bounces then our weighted levels that's the difference between weighted levels and swing ranges.
BULLISH TARGET
3305 - DONE
EMA5 CROSS AND LOCK ABOVE 3305 WILL OPEN THE FOLLOWING BULLISH TARGETS
3334 - DONE
EMA5 CROSS AND LOCK ABOVE 3334 WILL OPEN THE FOLLOWING BULLISH TARGET
3359 - DONE
EMA5 CROSS AND LOCK ABOVE 3359 WILL OPEN THE FOLLOWING BULLISH TARGET
3389 - DONE
EMA5 CROSS AND LOCK ABOVE 3389 WILL OPEN THE FOLLOWING BULLISH TARGET
3428
EMA5 CROSS AND LOCK ABOVE 3428 WILL OPEN THE FOLLOWING BULLISH TARGET
3478
BEARISH TARGETS
3271
EMA5 CROSS AND LOCK BELOW 3271 WILL OPEN THE FOLLOWING BEARISH TARGET
3227
EMA5 CROSS AND LOCK BELOW 3227 WILL OPEN THE SWING RANGE
3185
3146
As always, we will keep you all updated with regular updates throughout the week and how we manage the active ideas and setups. Thank you all for your likes, comments and follows, we really appreciate it!
Mr Gold
GoldViewFX

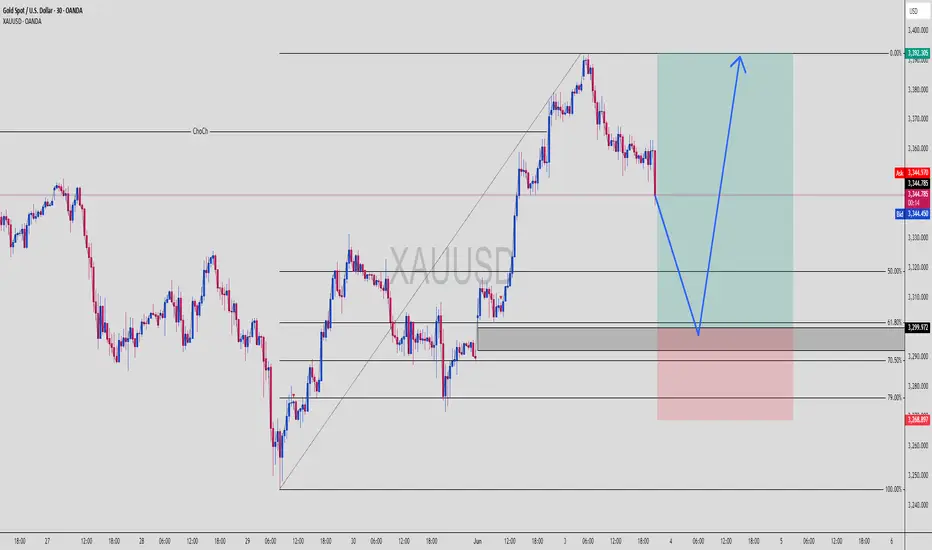
XAUUSD Golden Bounce? Discount OB Loading for LongXAUUSD | 30m Smart Money Buy Setup – Liquidity Sweep + Discount OB Combo
Gold’s about to act like… gold. 🤝
Price has pumped hard, and now we’re watching for a pullback into a premium discount zone — to trap sellers and give institutions their perfect entry.
Let’s break down this textbook Smart Money Concept setup:
📌 1. HTF Context:
Massive bullish impulse breaking old structure highs
Change of Character (ChoCh) confirmed — buyers are in control
Market is now retracing to rebalance inefficiencies + mitigate previous demand
📊 2. Key Levels:
🔻 Entry Zone (OB): Around 3,299.972
🔻 Deeper Discount (Fib 70.5–79%): 3,280.000 – 3,268.897
📈 TP1: Recent high – 3,392.305
🛡️ Stop Below: 3,268.897
🎯 RR Potential: 1:3+ – clean sniper shot
🧠 3. Smart Money Logic:
Price is pulling back into a refined OB zone inside discount territory
This zone overlaps with a clean FVG + 70.5% fib level
Price likely to tap into this zone, fake out sellers, then launch with momentum
🔁 4. Execution Plan:
✅ Wait for:
M5–M15 bullish BOS or engulfing candle inside the OB
Strong rejection wick off the refined OB/FVG
Entry confirmation = go long with tight SL
TP = HTF resistance / liquidity highs
Remember: Let price come to you. Don’t chase the setup. Be a sniper, not a machine gunner. 🎯
💡 5. Why This Long is Gold (Literally):
✅ Perfect structure flip (ChoCh)
✅ OB inside a clean discount zone
✅ Liquidity resting below = magnet before reversal
✅ Risk:Reward is beautiful
This isn’t just a bounce — this is a smart money rebalance play, and gold loves to respect these zones with explosive moves 💥
💬 Drop “XAU Bounce 🔥” in the comments if you’re watching this unfold
📥 Save this for future entries
📈 Follow @ChartNinjas88 for the sharpest Smart Money setups on Gold & Majors
Gold retracement and consolidation is not a trend reversalJudging from the current 4-hour K-line pattern, the price broke through the previous high again after opening today, reaching a high of 3392. The trend of shock consolidation is maintained during the day, showing a slow correction trend. In the evening, it is necessary to wait for the price to show obvious signs of stabilization before trading with the trend. Focus on the support level of 3325-3335 below. The trading strategy at night is to choose a long position based on the correction range. If the price stabilizes and rebounds, the primary target above is 3380, and then further focus on the previous high of 3392-3400. If the resistance is effectively broken, the position can be continued and look above 3400. In terms of specific operations, it is recommended to consider establishing a long order when the price pulls back to the 3345-3355 range.
Operation strategy:
1. It is recommended to buy gold when it pulls back to around 3345-3355, with a stop loss at 3330, and a short-term view of 3360-3370, with a target of 3380-3400.

GOLD (XAUUSD): Bullish Continuation Confirmed
As we discussed yesterday, Gold managed to break and close above
a resistance line of a bullish flag pattern on a daily.
It opens a potential for more growth.
Our next resistance is 3429.
For buying, consider the expanding demand zone based
on a broken horizontal resistance and a trend line.
❤️Please, support my work with like, thank you!❤️
I am part of Trade Nation's Influencer program and receive a monthly fee for using their TradingView charts in my analysis.

GOLD ROUTE MAP UPDATEHey Everyone,
Great start to the week with our chart idea playing out as analysed.
We started the day with our Bullish target hit at 3305 followed with ema5 cross and lock confirmation for 3334, which was hit perfectly with a further lock opening 3359 also completed.
We now have a cross and lock above 3359 opening 3389. We will continue to track the movement using cross and lock and any rejections on the levels will see price test the lower Goldturns for support and bounce.
We will keep the above in mind when taking buys from dips. Our updated levels and weighted levels will allow us to track the movement down and then catch bounces up.
We will continue to buy dips using our support levels taking 20 to 40 pips. As stated before each of our level structures give 20 to 40 pip bounces, which is enough for a nice entry and exit. If you back test the levels we shared every week for the past 24 months, you can see how effectively they were used to trade with or against short/mid term swings and trends.
The swing range give bigger bounces then our weighted levels that's the difference between weighted levels and swing ranges.
BULLISH TARGET
3305 - DONE
EMA5 CROSS AND LOCK ABOVE 3305 WILL OPEN THE FOLLOWING BULLISH TARGETS
3334 - DONE
EMA5 CROSS AND LOCK ABOVE 3334 WILL OPEN THE FOLLOWING BULLISH TARGET
3359 - DONE
EMA5 CROSS AND LOCK ABOVE 3359 WILL OPEN THE FOLLOWING BULLISH TARGET
3389
EMA5 CROSS AND LOCK ABOVE 3389 WILL OPEN THE FOLLOWING BULLISH TARGET
3428
EMA5 CROSS AND LOCK ABOVE 3428 WILL OPEN THE FOLLOWING BULLISH TARGET
3478
BEARISH TARGETS
3271
EMA5 CROSS AND LOCK BELOW 3271 WILL OPEN THE FOLLOWING BEARISH TARGET
3227
EMA5 CROSS AND LOCK BELOW 3227 WILL OPEN THE SWING RANGE
3185
3146
As always, we will keep you all updated with regular updates throughout the week and how we manage the active ideas and setups. Thank you all for your likes, comments and follows, we really appreciate it!
Mr Gold
GoldViewFX

XAUUSD Daily Sniper Plan — Monday, June 2, 2025“Equilibrium Warzone: Will Bears Break Structure or Bulls Reclaim Premium?”
👋 Welcome to the new week, traders. The battlefield is balanced — here’s how we dominate it.
Gold is trading just above equilibrium (3289–3290) after a messy week of premium traps, CHoCHs, and weak bullish continuations. The market has printed clear Lower Highs (LHs) across H1/M15 and failed to reclaim the supply at 3302–3308.
We are now caught in a compression box between M15 OB resistance and discount inefficiency, with liquidity stacked below.
🔹 Current Bias
🎯 Neutral-to-bearish under 3308
🔻 CHoCH + LH formed on both M15 and H1
🧠 Monday will reveal if we break 3270 floor or induce a final trap into premium
🔹 Intraday Structural Zones (Sniper Refined)
🔺 Resistance Zones Above Price
Zone Name Price Range Confluence
🔺 First OB Reaction 3296 – 3302 M15 OB + H1 rejection wick — soft inducement
🔺 Final LH Trap 3308 – 3322 Last Lower High + FVG fill + premium supply
🔺 Premium Killzone 3335 – 3355 Upper trap + internal liquidity — only visited if bulls reclaim structure
🔻 Support Zones Below Price
Zone Name Price Range Confluence
🔻 EQ Reaction Floor 3274 – 3262 Current support shelf + equilibrium wick lows
🔻 First Breakdown Zone 3248 – 3228 BOS origin + M15 CHoCH + clean liquidity stack
🔵 Swing Reentry Zone 3196 – 3172 M15 demand block + clean OB + deep FVG fill
⚫ Final HTF Demand 3150 – 3130 May HL + strong structure base — ultimate reversal point if dumped
🔹 Execution Plan for Monday
✅ Plan A — Sell Setup (Most Probable)
If price taps 3296–3302 early and rejects → short toward 3262
Confirm with M15 CHoCH + bearish PA
Target 3248 → 3228
Hold partials for extension into 3196 if momentum is clean
🔁 Plan B — Inducement Trap Then Drop
Spike into 3308–3322 → watch for LH rejection or FVG sweep
Sell setup becomes valid only if M15 fails to break structure up
Target remains same: 3262 → 3228
🛑 Invalid Buy Conditions
❌ No buys valid inside 3302–3322 → this is smart money trap zone
✅ Buy only valid if:
Deep discount reaction at 3196–3172, OR
Clean break + BOS above 3322, then hold → reentry toward 3355
📊 EMA Structure (5/21/50/100/200)
❌ EMA5 is under 21 and 50 → bearish
⚠️ Price is hugging EMA100 from below
✅ EMA200 (H1) sits at ~3172 → aligns with deep demand zone
Momentum favors sellers if 3308 holds
🔚 Final Thoughts — Battlefield Summary
Gold is stuck in range-to-distribution structure after failing to reclaim premium. With CHoCHs on all major intraday timeframes, momentum is now tilting bearish. The setup is clean: wait for the retest of structure above, then strike into demand zones where clean inefficiencies remain.
Don’t chase fake breakouts. Let price show its hand near OBs and EQ edges — and execute with clarity.
💬 If You Found This Valuable:
📌 Follow GoldFxMinds for live sniper plans, real zone maps, and execution clarity
💡 Smash a LIKE if you’re ready to wait, not chase
👇 Comment your take: Do we drop to 3228 first — or induce 3315 before the flush?
Trade sharp. Trade with structure.
— GoldFxMinds

GOLD (XAUUSD): Sense of Fear?!
As the Russia-Ukraine peace talks are going today,
Gold shows clear signs of worry.
The market turned bullish after the opening and is currenty
breaking a resistance line of a bullish flag pattern on a daily
that we discussed earlier.
To confirm the violation, we will need a daily candle close above that.
As the results of the talks are still unknown, more moves may occur today.
So the today's close will be very important.
Let's patiently wait.
❤️Please, support my work with like, thank you!❤️

Market Analysis: Gold Price Could Gain Bullish PaceMarket Analysis: Gold Price Could Gain Bullish Pace
Gold started a fresh increase above the $3,300 resistance level.
Important Takeaways for Gold Price Analysis Today
- Gold price started a steady increase from the $3,250 zone against the US Dollar.
- A connecting bearish trend line is forming with resistance at $3,318 on the hourly chart of gold at FXOpen.
Gold Price Technical Analysis
On the hourly chart of Gold at FXOpen, the price found support near the $3,250 zone, formed a base, and started a fresh increase above the $3,280 level.
The bulls cleared the $3,300 zone and the 50-hour simple moving average. There was also a move above the 61.8% Fib retracement level of the downward move from the $3,331 swing high to the $3,271 low. The RSI is now above 50 and the price could aim for more gains.
Immediate resistance is near the 76.4% Fib retracement level of the downward move from the $3,331 swing high to the $3,271 low at $3,318. There is also a connecting bearish trend line forming with resistance at $3,318.
The next major resistance is near the $3,330 level. An upside break above the $3,330 resistance could send Gold price toward $3,382. Any more gains may perhaps set the pace for an increase toward the $3,400 level.
Initial support on the downside is near the $3,300 zone. If there is a downside break below the $3,300 support, the price might decline further.
In the stated case, the price might drop toward the $3,270 support. The next major support sits at $3,250. Any more losses might send the price toward the $3,220 level.
This article represents the opinion of the Companies operating under the FXOpen brand only. It is not to be construed as an offer, solicitation, or recommendation with respect to products and services provided by the Companies operating under the FXOpen brand, nor is it to be considered financial advice.

GOLD Price Analysis: Key Insights for Next Week Trading DecisionIn this video, we dissect how gold traded last week (May 26–30), why the price hovered near the top of a descending channel, and what’s driving market indecision. From geopolitical tensions to Federal Reserve interest rate uncertainty, we connect the dots between fundamentals and technical structure, enabling you to make better-informed trading decisions.
📅 Key Events to Watch This Week:
✅ISM Manufacturing PMI
✅ADP Employment Change
✅ISM Services PMI
✅Average Hourly Earnings
✅Non-Farm Payroll (NFP)
🎯 In this analysis, I walk you through:
🔸My technical blueprint (key zones for buyers & sellers)
🔸My bullish and bearish scenarios based on the structure on the chart
🔔 Don’t forget to like the video in support of my work.
Disclaimer:
Based on experience and what I see on the charts, this is my take. It’s not financial advice—always do your research and consult a licensed advisor before trading.
#GoldAnalysis #XAUUSD #GoldPriceForecast #GoldTrading #ForexAnalysis #MarketOutlook #NFP #FOMC #TechnicalAnalysis #FundamentalAnalysis #GoldBulls #GoldBears #TradingStrategy #Darcsherry #XAUUSDAnalysis #GoldOutlook #GoldPricePrediction

GOLD 1H CHART ROUTE MAP UPDATE & TRADING PLAN FOR THE WEEKHey Everyone,
Please see our updated 1h chart levels and targets for the coming week.
We are seeing price play between two weighted levels with a gap above at 3305 and a gap below at 3271. We will need to see ema5 cross and lock on either weighted level to determine the next range.
We will see levels tested side by side until one of the weighted levels break and lock to confirm direction for the next range.
We will keep the above in mind when taking buys from dips. Our updated levels and weighted levels will allow us to track the movement down and then catch bounces up.
We will continue to buy dips using our support levels taking 20 to 40 pips. As stated before each of our level structures give 20 to 40 pip bounces, which is enough for a nice entry and exit. If you back test the levels we shared every week for the past 24 months, you can see how effectively they were used to trade with or against short/mid term swings and trends.
The swing range give bigger bounces then our weighted levels that's the difference between weighted levels and swing ranges.
BULLISH TARGET
3305
EMA5 CROSS AND LOCK ABOVE 3305 WILL OPEN THE FOLLOWING BULLISH TARGETS
3334
EMA5 CROSS AND LOCK ABOVE 3334 WILL OPEN THE FOLLOWING BULLISH TARGET
3359
EMA5 CROSS AND LOCK ABOVE 3359 WILL OPEN THE FOLLOWING BULLISH TARGET
3389
EMA5 CROSS AND LOCK ABOVE 3389 WILL OPEN THE FOLLOWING BULLISH TARGET
3428
EMA5 CROSS AND LOCK ABOVE 3428 WILL OPEN THE FOLLOWING BULLISH TARGET
3478
BEARISH TARGETS
3271
EMA5 CROSS AND LOCK BELOW 3271 WILL OPEN THE FOLLOWING BEARISH TARGET
3227
EMA5 CROSS AND LOCK BELOW 3227 WILL OPEN THE SWING RANGE
3185
3146
As always, we will keep you all updated with regular updates throughout the week and how we manage the active ideas and setups. Thank you all for your likes, comments and follows, we really appreciate it!
Mr Gold
GoldViewFX
